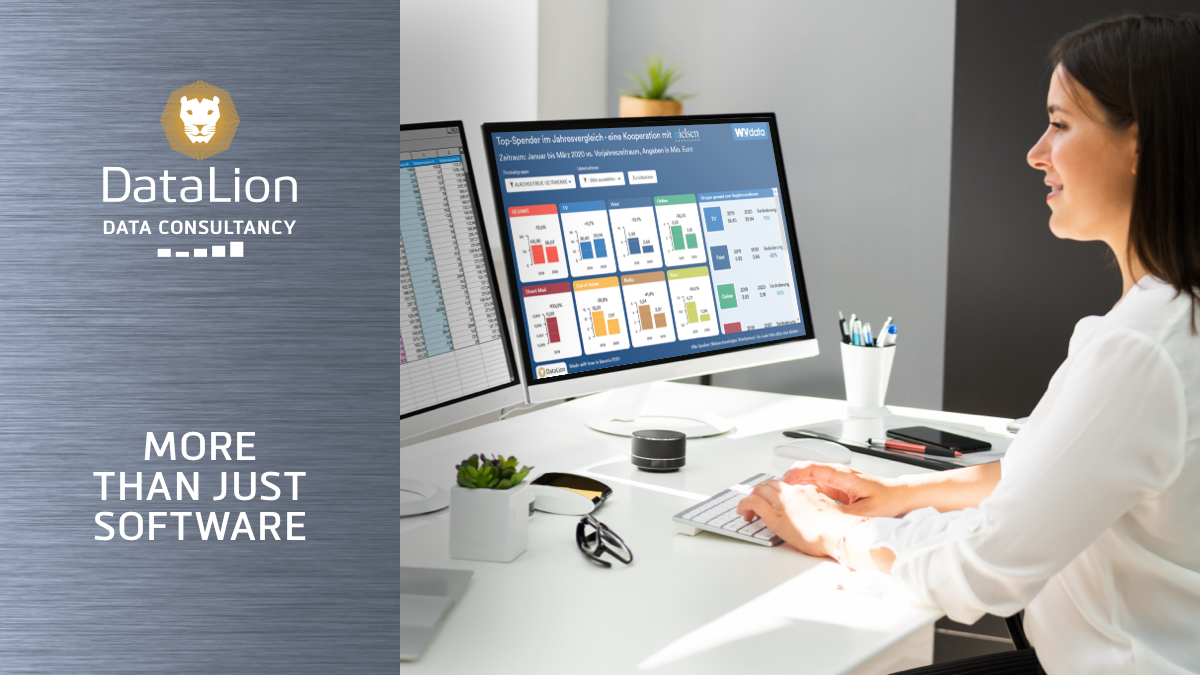
From survey data to the finished dashboard in one week

Would you like to set up your market research project as an efficient dashboard solution, you wish to build your quick dashboard but you have a lot to do and no time for implementation? We can help!
Three steps to your ready-to-use dashboard
- 1. Survey data
- You send us your data set, for example as SPSS or Excel, and your CI documents
- 2. Project setup
- We set up your project from the data to the layout
- 3. Finished dashboard
- You can enjoy your finished dashboard and can share it with your audience.
Interested? Contact us now!
This is how you dashboard could look like

Companies that are already using the DataLion dashboard software
The DataLion Quickstart Package in detail
- You send us your finalized, ready-to-use labeled data record (SAV and/or CSV, max. 300 columns / 30,000 lines), questionnaire, PPTX master, your CI documents (logo, color scheme), and your specifications for the dashboards ( e.g. Scribbles). We check the suitability of the data set and the feasibility of your specifications within the quick start package. If necessary, you can adapt the data record and the specification.
- Our consultants set up the project for you, create a report according to your specifications with up to eight dashboards each with up to ten of our standard chart types, and set up your PowerPoint and Excel exports (DataLion standard exports).
- Six to nine working days after receiving the final data set, you have your finished and quick dashboard and can deliver it to the first customers.
- You will receive an onboarding into the software or an introduction to your dashboards (max. One hour).
- A correction loop: Change requests in the layout (changes to the colors, chart types, arrangement of the charts, dropdown controls, text boxes) are incorporated in a correction loop.
The most important features of DataLion Software
? Users, Roles, Access Profiles
- Different types of profile users in DataLion software such as viewers, editors, administrators
- Setting up of access profiles with certain variables, preset filters and features
? Data Management and Automation
- Import of CSV and SPSS files
- Time-controlled data import
- Automatic generation of tables and charts
- Connection of survey software for automated data import
- Cleaning directly in DataLion
- Data transformation: recoding and calculation of variables
- Weightings
- Different bases per question or per expression
- Static and calculated benchmarks
- Chi-square significance tests in tables
- Cross tabulation
- Connection of databases such as MySQL and Exasol
? Chart Types (Excerpt)
- Bar chart, Pie chart, Donut
- Stacked beams and pillars
- Polarities, Word Cloud, Card
- Price sensitivity diagram, Heat Maps
- Time series with dynamic or automatic selection of scaling
- Tables with nested column heads and various metrics and formats for each column or row
- Text boxes with WYSIWYG editor and direct entry of HTML
? Safety
- Server locations in Nuremberg and Falkenstein; IT security certified according to ISO 27001
- Cloud connection via AWS and Microsoft or hosting on-premise is also possible
? Support
- Onboarding by DataLion Success Team
- Access to help center with documentation, howtos and forum
- Ticket system and live chat
⚙️ Usability and Design
- Export as editable PowerPoint, Excel, PDF, JPG, PNG, SVG and raw data as CSV
- Adaptation of chart legends, colors, axes
- Definition of missing values
- Chart filters, dashboard filters with filter editor, interactive filter dropdowns, filter breaks
- Static charts that do not or only react to selected filters
- Weighted or unweighted case numbers; with or without missing values; Total number of cases; the number of cases per variable or column, hiding and marking of characteristics according to the minimum number of cases
- Displaying and exporting data on individual case level or open mentions
- Saving charts and settings as favorites
- Displaying images and videos in the dashboard
- Drill-down function
- Drag & drop editing of dashboards
- Export of volumes of Excel tables with nested pre-filters or column headers and different metrics, bases and case numbers


