Marketing data & analytics in one platform
Combine social, newsletter, campaign and media data in one real-time dashboard — and share live KPIs with every stakeholder. From the data source to the native PowerPoint report, all in one software. ISO 27001-certified hosting, GDPR-compliant, made in Munich.
DataLion is a web-based dashboard and analytics platform, made in Munich, that lets marketing and brand teams combine data from many channels — social media, newsletter, web, campaigns and media usage — in one real-time dashboard. 50+ interactive chart types, native PowerPoint export, ISO 27001-certified hosting and GDPR-compliant.
- 🇩🇪 Made in Munich
- GDPR-compliant
- DPA included
- Hosted in Germany
Trusted by research, insights & media teams
- 50+ interactive chart types
- 20+ statistical methods (R)
- 2 weeks release cadence
- ISO 27001 certified data centers (Germany)
From scattered channel data to a live dashboard
Marketing reporting usually means: gathering numbers from every channel by hand, sorting them in Excel, building charts, copying them into PowerPoint — every single week. DataLion unites that chain in one platform: import your channel, media and survey data once and build a dashboard on top of it that refreshes itself.
Here is the continuous flow — each step has its own page with the full detail:
- Data import & integration: social, newsletter, web and media data via CSV, Excel, ASCII, SPSS and databases.
- Data preparation: merge metrics, clean and recode — directly on the dataset.
- Analysis & statistics: 20+ procedures on an R engine incl. driver analysis for brand KPIs.
- Dashboard software: interactive KPI dashboards and reports in one click.
- Survey software: brand and campaign surveys whose answers flow straight in.
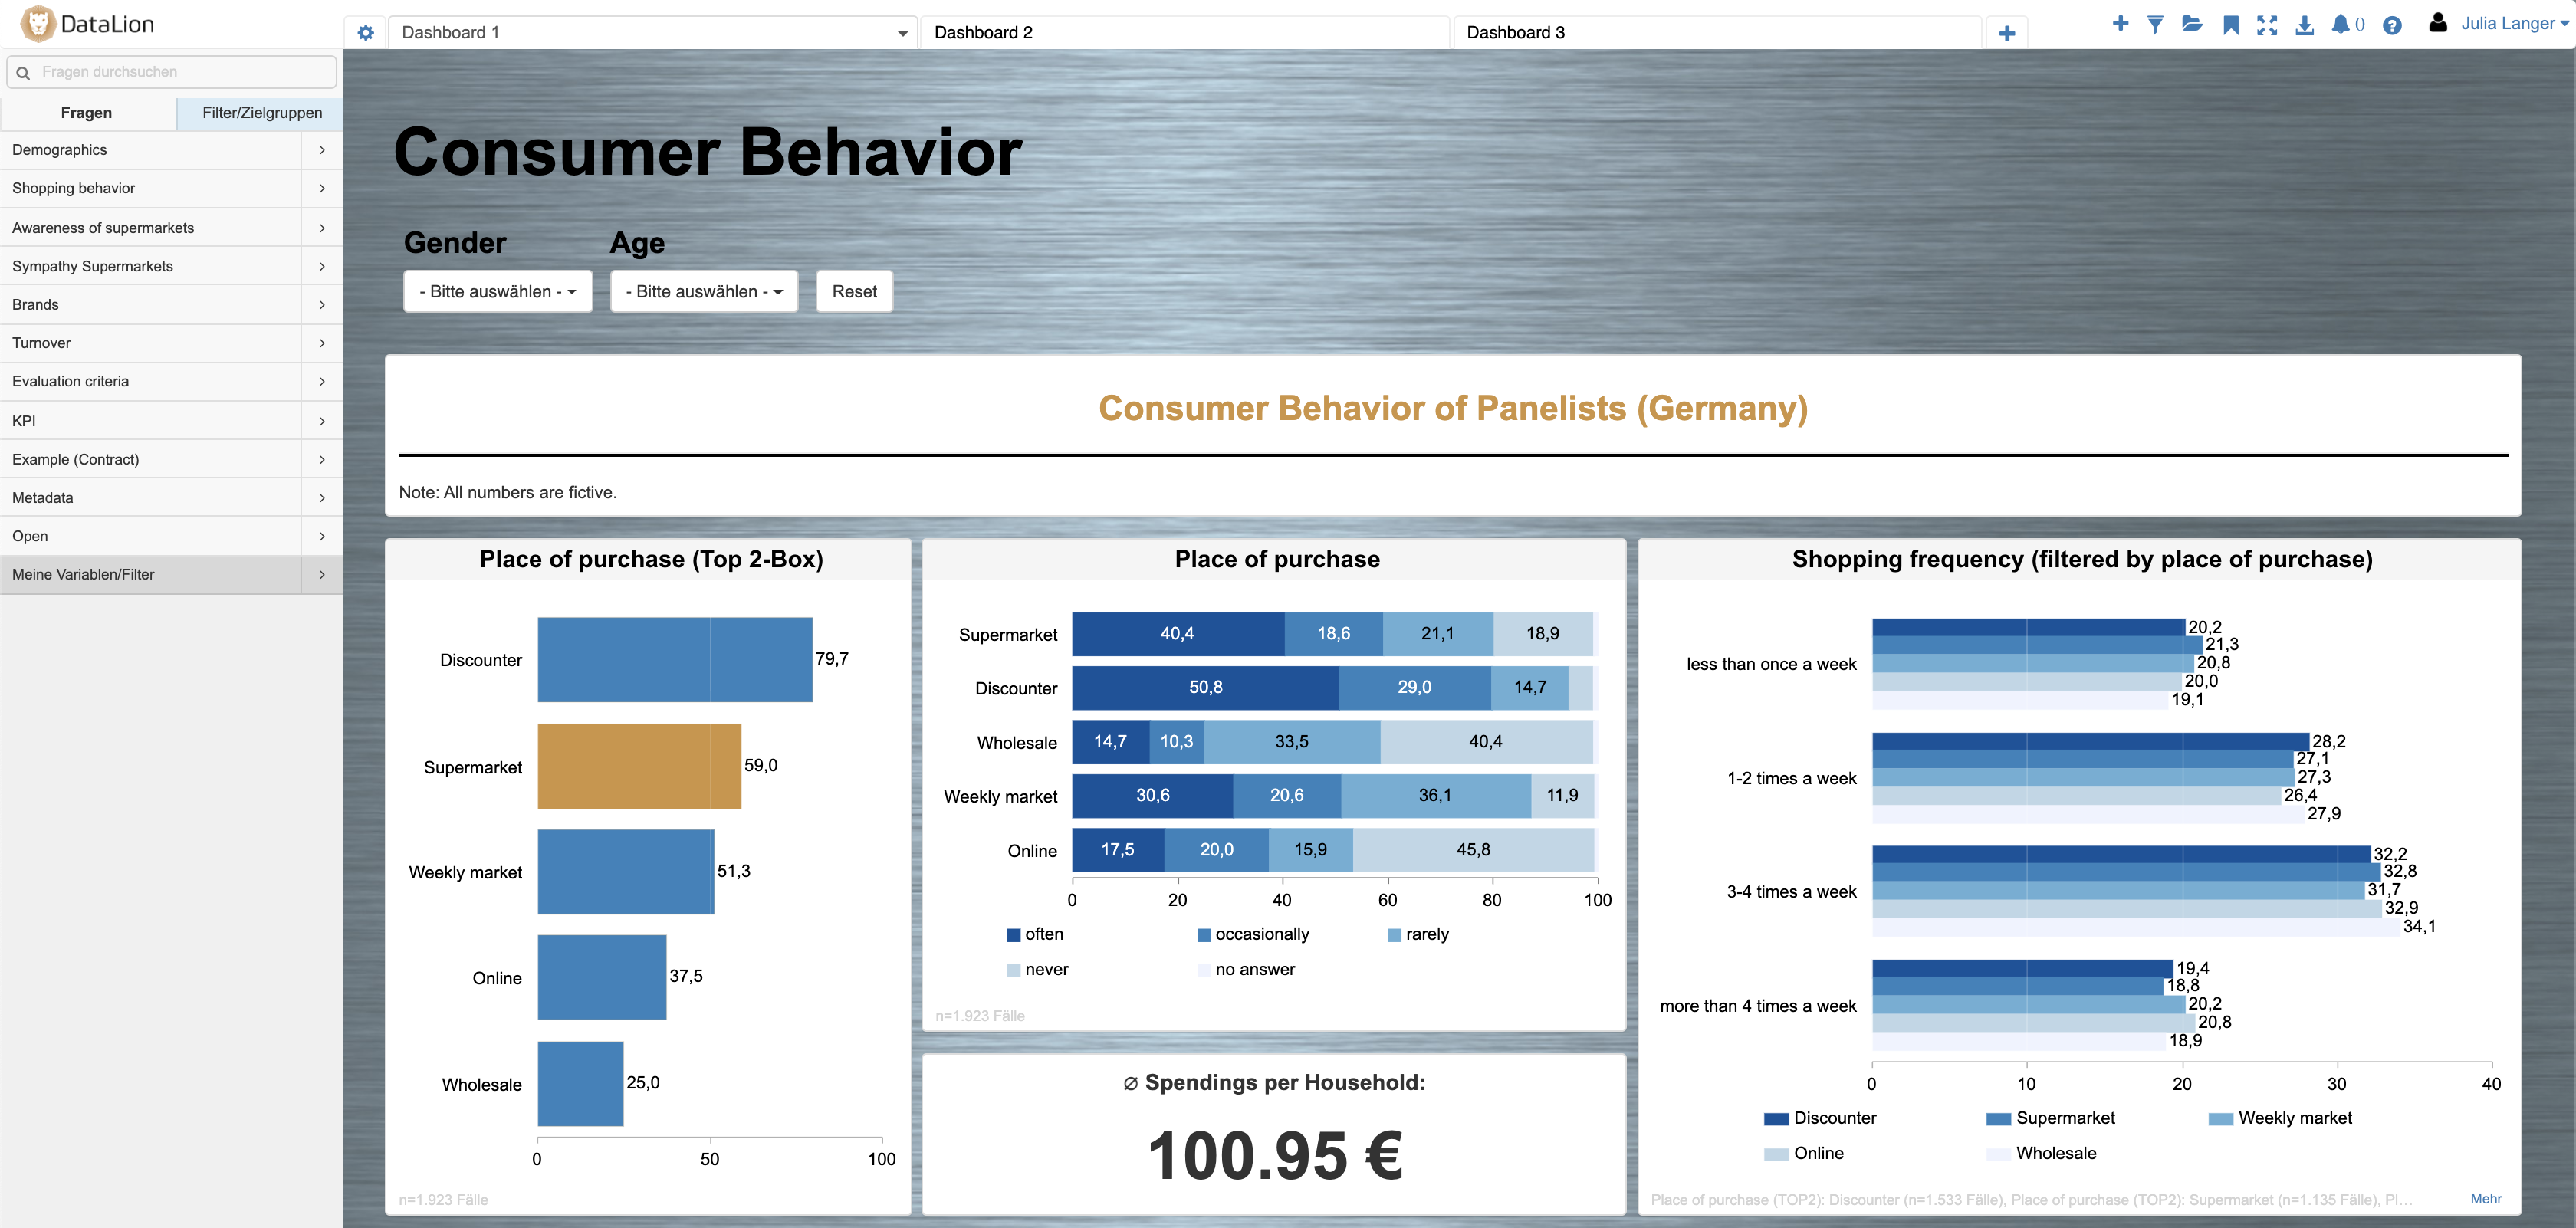
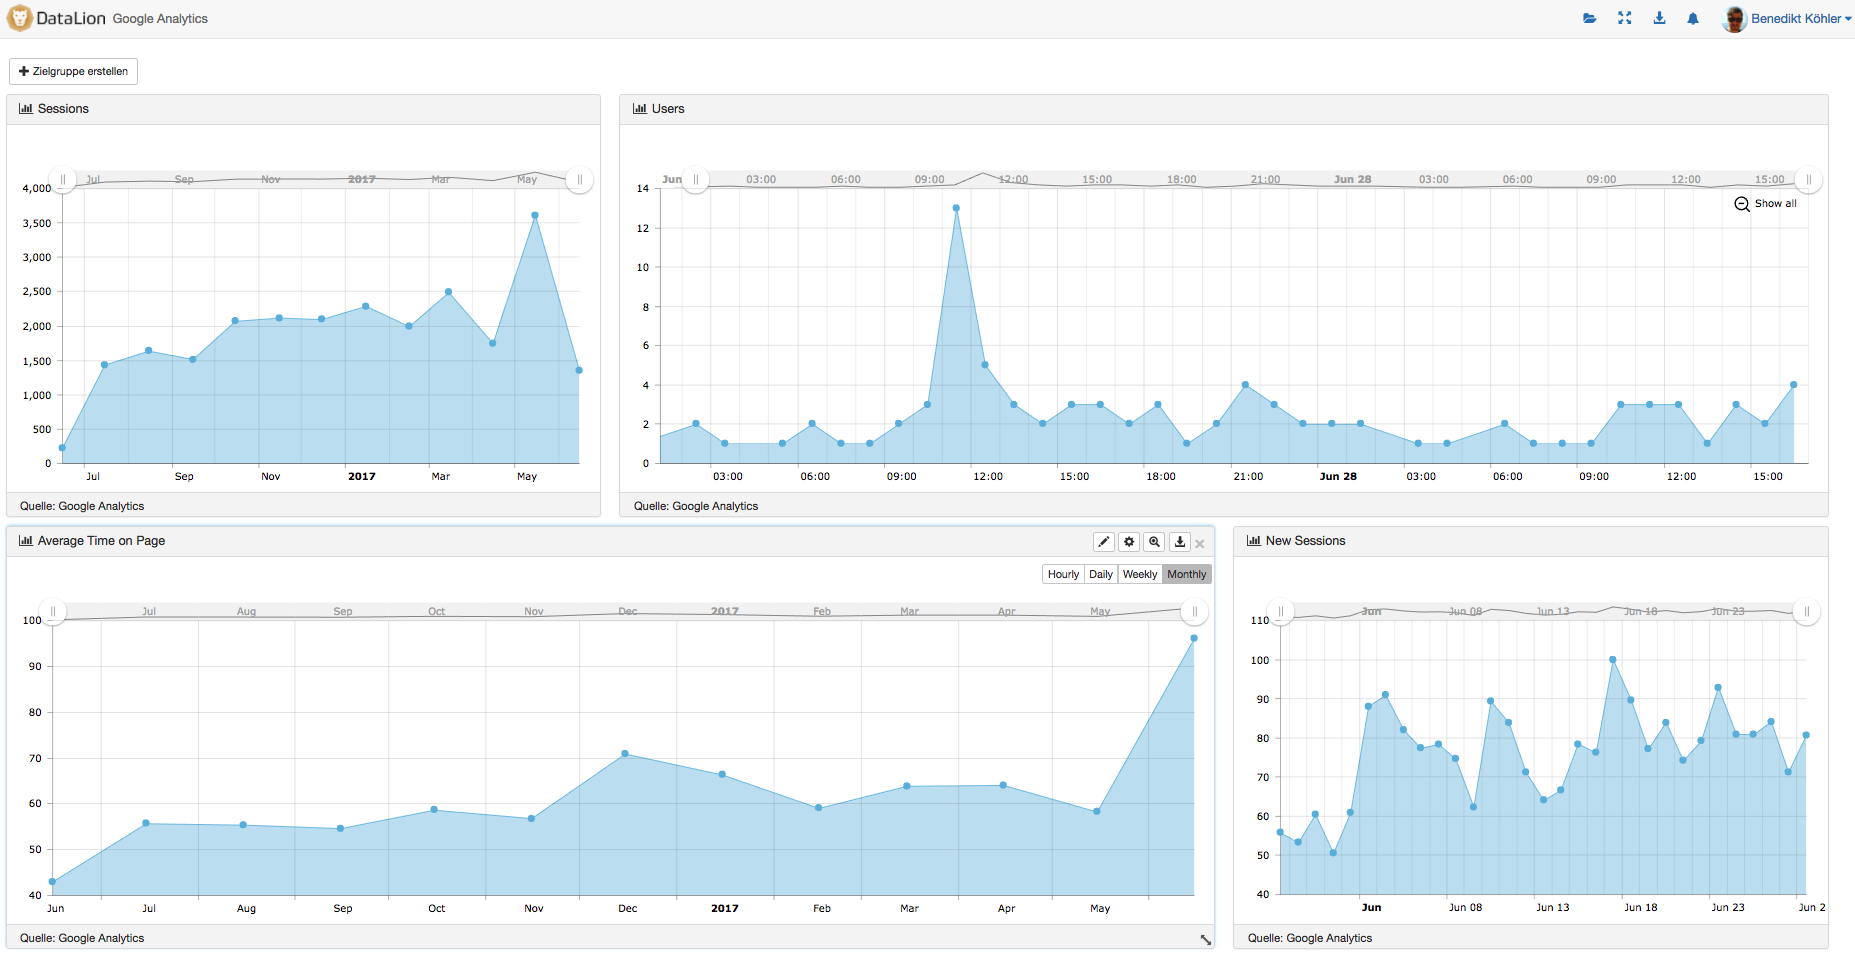
Every channel in one dashboard
Social media, newsletter, web, campaigns and media usage usually live in separate tools. In DataLion you bring them into one shared dashboard — imported as CSV, Excel, ASCII, SPSS or straight from your database — and compare channels, time frames and audiences side by side.
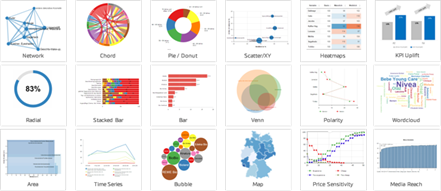
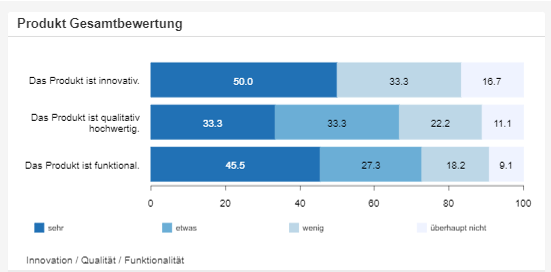
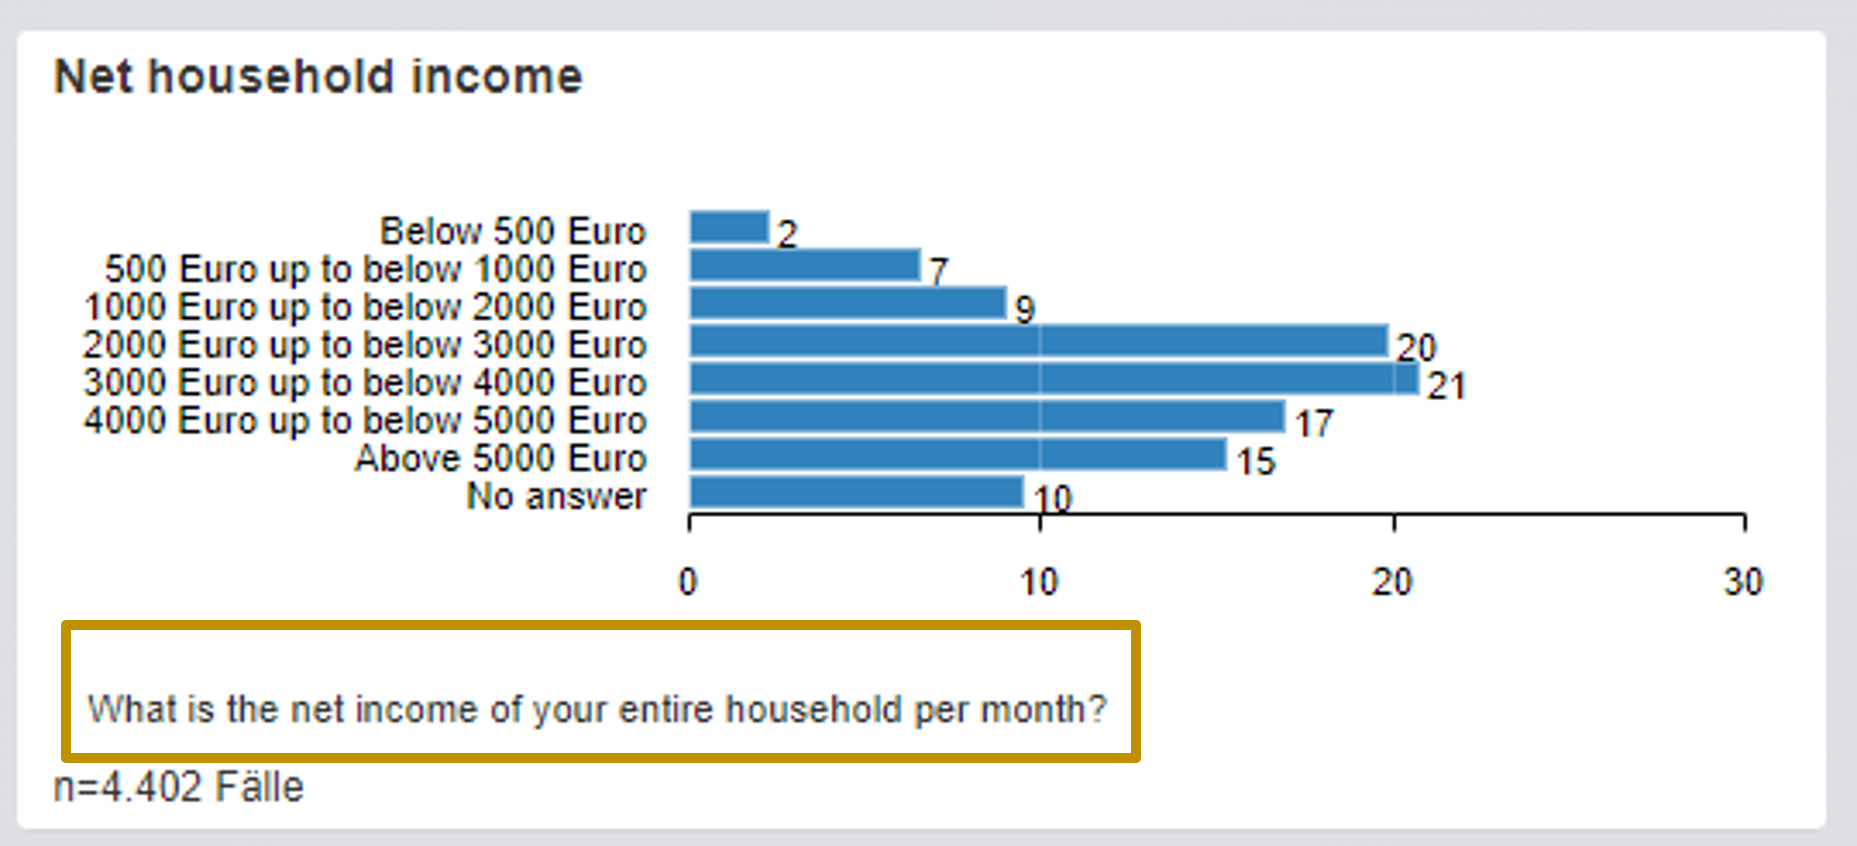
More than 50 interactive chart types cover every marketing question — from bars, lines and donut through time series to heatmaps, maps and word clouds for social content and open-ended responses.
- Social, newsletter, web, campaigns & media combined
- Import via CSV, Excel, ASCII, SPSS & databases
- 50+ chart types incl. heatmaps, maps & word clouds
- Compare channels, waves and audiences directly
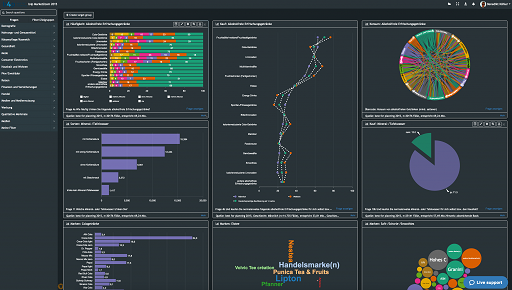
Live KPIs for campaigns & brand tracking
Assemble your KPI dashboards by drag & drop — with no programming. Your teams filter live, drill down into individual campaigns and compare waves across flexible time series, ideal for ongoing brand and campaign tracking.
Once set up, dashboards and reports refresh automatically as new data arrives. Continuous tracking studies can be imported and updated automatically — including variable recoding, wave after wave.
- KPI dashboards by drag & drop, not programming
- Interactive filters & drill-downs in real time
- Flexible time series for brand & campaign tracking
- Reports refresh automatically — wave after wave
Combine survey data with media & performance data
You capture brand awareness, ad recall and satisfaction in a survey — while reach, clicks and media spend come from your performance sources. In DataLion you put both into one dataset and analyze them together, with no detour through SPSS or Excel.
For deeper insight, 20+ statistical procedures run on an R engine — from driver analysis and regression to ANOVA and significance tests at confidence levels from 80% to 99%. So you can show which activity actually moves your brand KPIs.
- Survey and performance data in one dataset
- Weighting, flexible bases & open-ended responses
- Driver analysis, regression, ANOVA & significance tests
- Import from survey platforms like LamaPoll & Qualtrics
Share live & export natively to PowerPoint
Share live dashboards by link with internal and external stakeholders — rights- and role-based, fully in your corporate design. For management decks, export in one click to natively editable PowerPoint with your own master; charts arrive as real PowerPoint diagrams.
- Share live dashboards with stakeholders by link
- Real PowerPoint diagrams with your own master
- Flexible Excel report books, PDF, CSV & JPEG
- Embedded live dashboards for website & portal
AI agents, your own CI & secure data
Through the Model Context Protocol (MCP) you connect DataLion to AI agents like Claude — and have them build dashboards, import data and create reports in plain language. Learn more on the AI market research page.
DataLion is multi-client ready, fully customizable to your corporate design, and controls rights and roles per team and client. Your sensitive data stays in ISO 27001-certified data centers in Germany — GDPR-compliant, with a DPA and optional on-premise hosting.
- MCP integration for Claude & other AI agents
- Multi-client ready, CI-compliant with themes, colors & CSS
- Rights & roles per user
- ISO 27001-certified hosting, GDPR, DPA included, on-premise available
See DataLion with your own data
Start a free trial or book a personal demo — from raw data to a finished dashboard.

We now work much more efficiently, giving us more time to take care of the derivations and insights from the data for the customers.
The platform in detail
Common questions about marketing data & analytics
Can I combine data from different marketing channels?
Does DataLion offer real-time dashboards for campaign and brand tracking?
Can I share live dashboards with stakeholders?
Can I merge survey data with performance data?
Which chart types suit marketing dashboards?
Is DataLion GDPR-compliant and customizable to my design?
Ready to bring your marketing data together?
Try DataLion free with your own channel and survey data — from import to a finished live dashboard. Or book a personal demo and see the platform live.