Agency Dashboards & White-Label Client Reporting
Combine campaign data from web, ad and social into interactive, white-label dashboards in each client’s branding — and replace hand-built PowerPoint with live reports you manage from one account. ISO 27001-certified hosting, GDPR-compliant, made in Munich.
DataLion is a web-based, multi-client dashboard platform, made in Munich, built for agencies. Combine campaign data from web tracking, ad servers and social monitoring into interactive, white-label dashboards in each client’s branding, share them live or as native PowerPoint, and manage every client from one account — ISO 27001-certified hosting and GDPR-compliant.
- 🇩🇪 Made in Munich
- GDPR-compliant
- DPA included
- Hosted in Germany
Trusted by research, insights & media teams
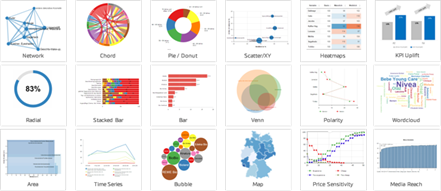
- 50+ interactive chart types
- 20+ statistical methods (R)
- 2 weeks release cadence
- ISO 27001 certified data centers (Germany)
The agency reporting treadmill
- Every client means exporting from every tool and rebuilding the same deck month after month.
- Reporting is a cost centre, not a product — hours that never get billed.
- Each client wants their own branding, but your tooling only does one look.
From raw campaign data to client-ready dashboard
Agency reporting usually means exporting from every tool, pasting into Excel and rebuilding the same client deck month after month. DataLion unites that chain in one platform — connect each client’s data once and their dashboards update themselves.
Manage all your clients from a single, multi-client account: separate data, separate logins and separate branding per client, with rights and roles so each client sees only their own results.
- Multi-client by design — every client isolated in their own space
- Rights & roles per client and per team member
- Dashboards built by drag & drop — no programming, no manual
- Stop the monthly copy-and-paste — connect once, refresh forever
Fully white-label dashboards in your client’s CI
DataLion adapts completely to your corporate design — or your client’s. Set themes, colors, logos and fonts, and go as far as custom CSS for a pixel-perfect match. The dashboard your client opens looks like it was built in-house.
Need a chart that does not exist anywhere else? Beyond the 50+ built-in types you can integrate your own JavaScript-based custom chart types, so the agency’s signature visualizations are yours alone.
- Themes, colors, logos & fonts per client — even custom CSS
- Your own JavaScript-based custom chart types
- Client portals on your domain, dashboards embedded in your site
- A reporting product you can put your name on
Combine web, ad & social data — and benchmark it
Bring every campaign source together: web and ad tracking, ad servers, social-media monitoring and media-planning data, imported via database, Excel or CSV and live data sources. Measure, compare and visualize campaign performance without the hassle of copy-and-paste.
With 50+ interactive chart types, live filters and flexible time series you benchmark campaigns against each other and over time, and drill from the headline number into a single channel, audience or creative.
- Web, ad-server, social & media-planning data in one report
- Benchmark campaigns against each other and over time
- Filter live by channel, audience, creative or period
- Real-time insight for in-flight campaign optimization
Live dashboards you embed and share
Replace the monthly PDF with a live dashboard your client can open any time. Embed it in your client portal or website, or share it by link — it works on smartphone, tablet and desktop, and a fullscreen mode is built in for presentations.
Once set up, dashboards refresh automatically as new campaign data arrives, so your clients always see current numbers and your team stops rebuilding reports by hand.
- Embed live dashboards in a client portal or your website
- Share by link — mobile, tablet, desktop and fullscreen ready
- Auto-refresh as new campaign data arrives
- Free your team from manual monthly reporting
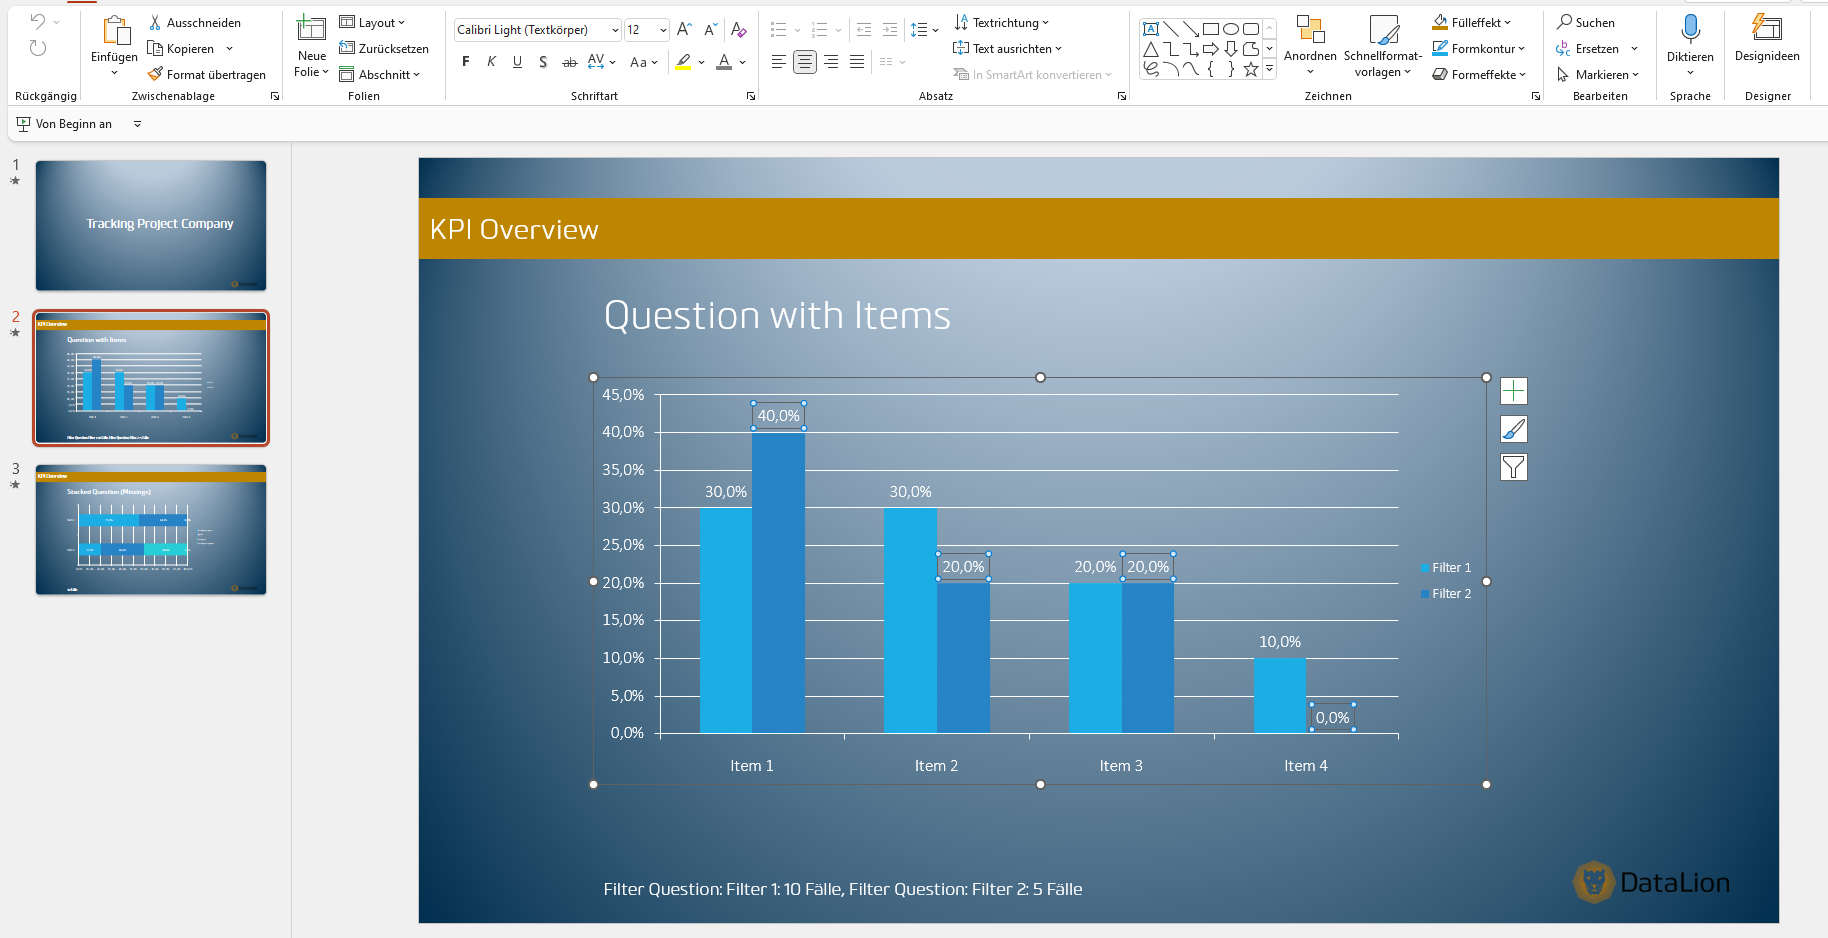
Client decks in native PowerPoint — in their master
When a client still wants slides, export the report in one click as natively editable PowerPoint. Charts come in as real PowerPoint diagrams, and with each client’s PowerPoint master the deck already matches their corporate design — a full presentation in minutes instead of hours.
Need the raw numbers? Export flexible Excel report books, PDF or images too. The deck refreshes itself for the next reporting cycle.
- Real PowerPoint diagrams in each client’s master
- Flexible Excel report books, PDF, CSV & image export
- A complete client deck in minutes, not hours
- Reports refresh automatically for the next cycle
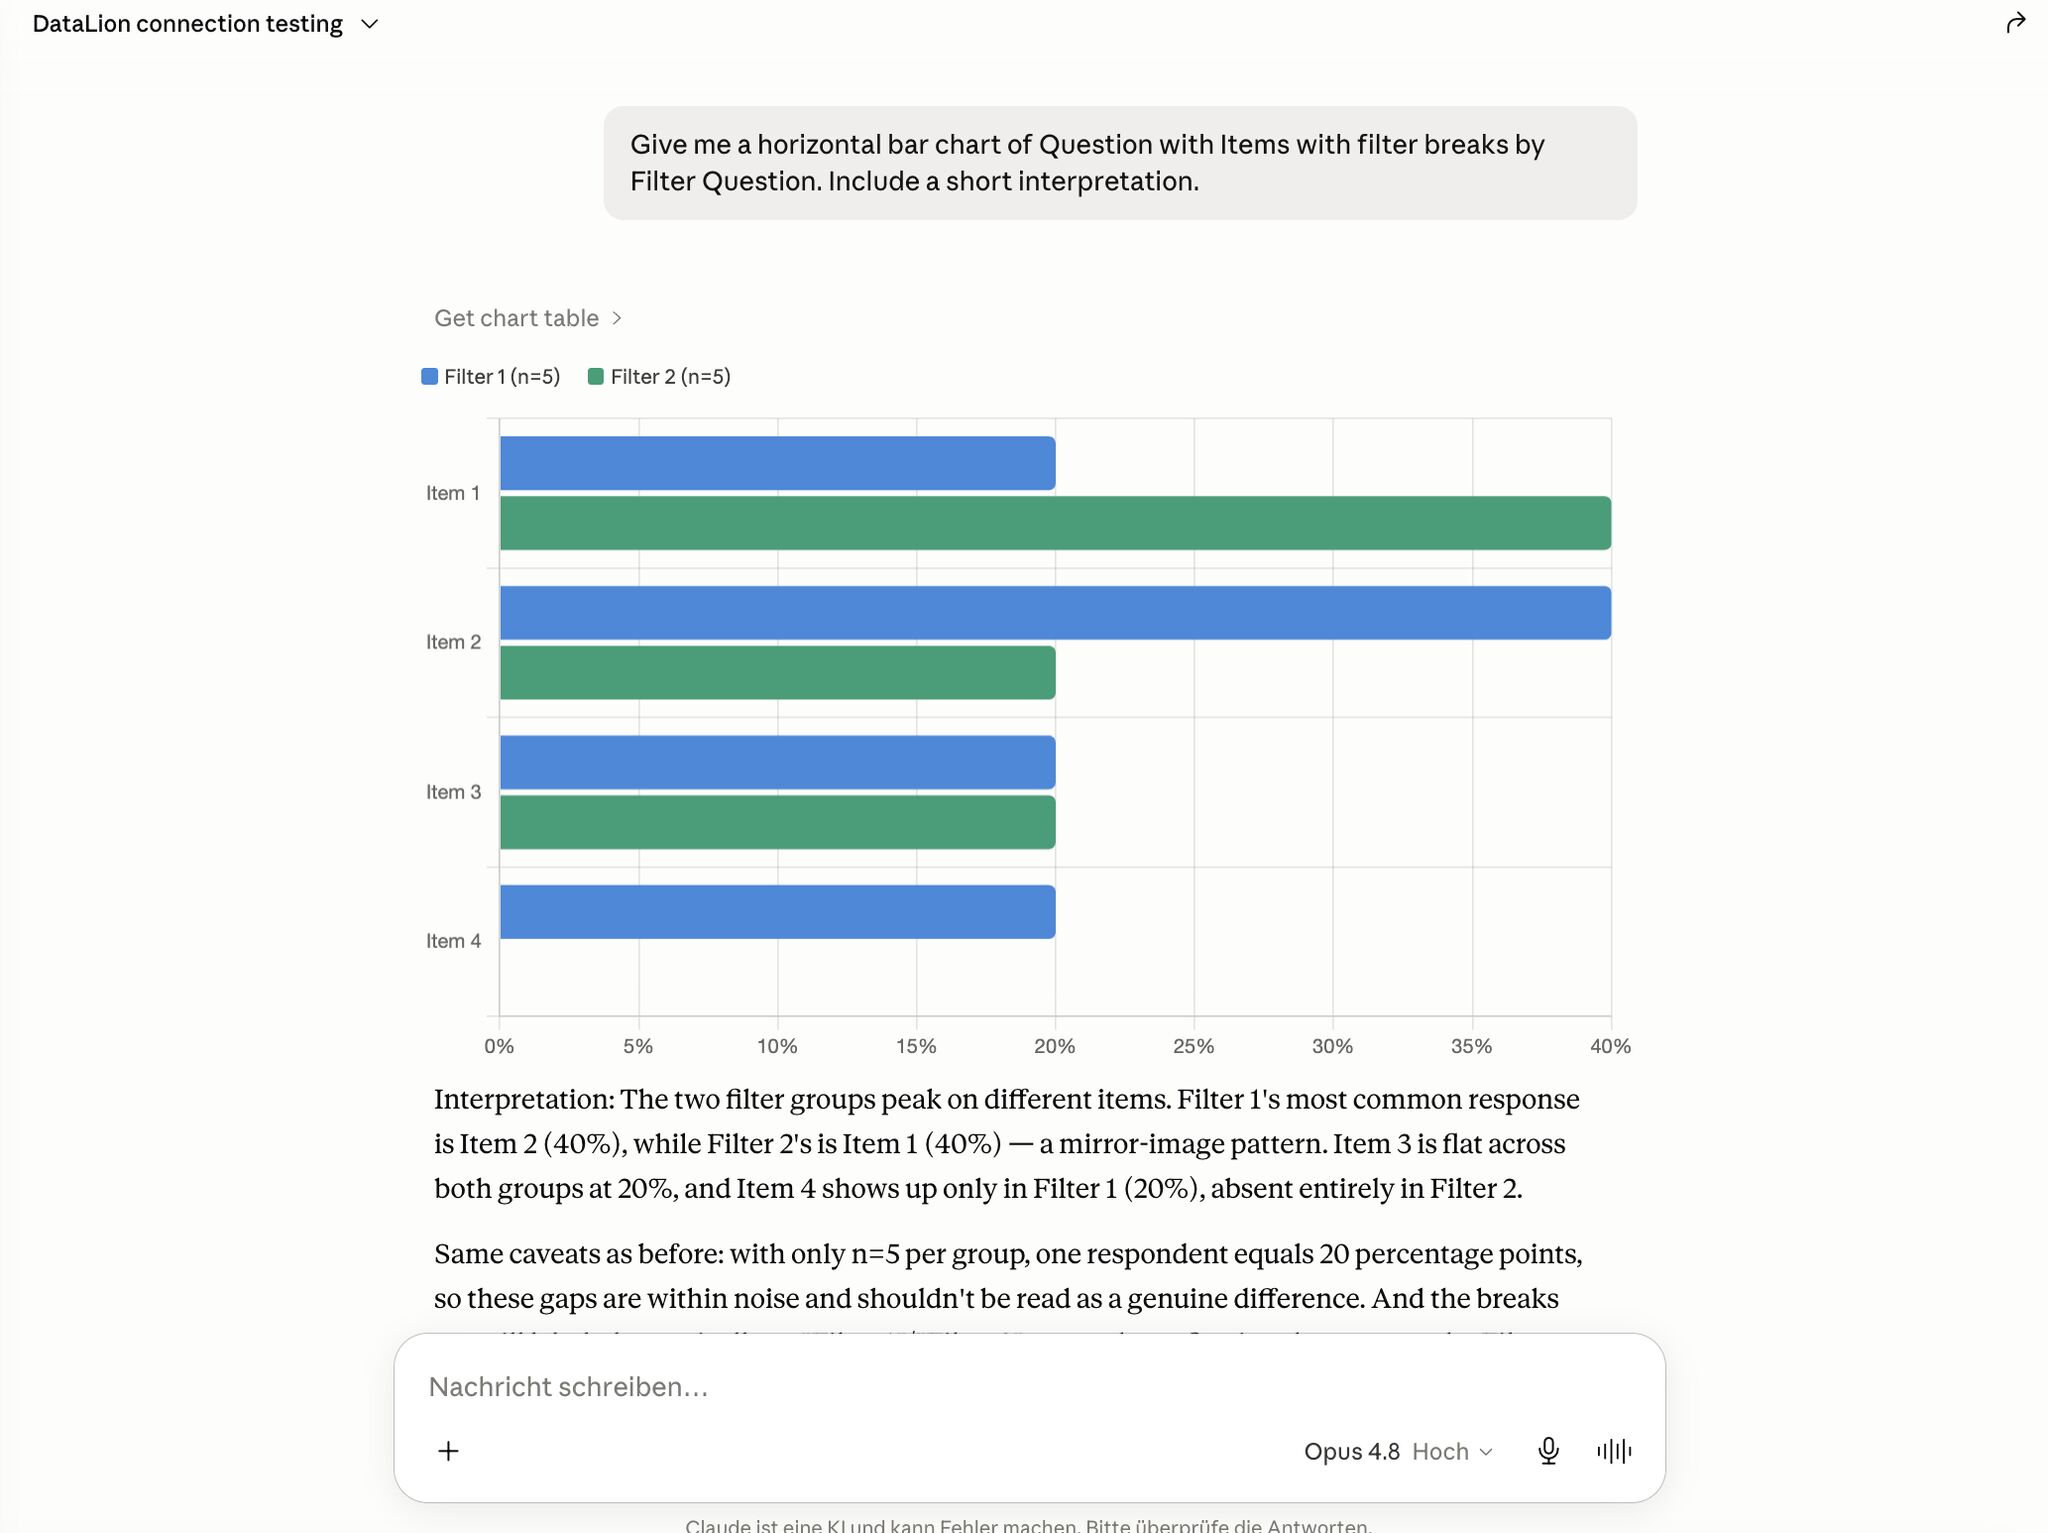
Scale reporting with AI agents like Claude
Through the Model Context Protocol (MCP) you connect DataLion to AI agents like Claude — and have them build dashboards, import data and assemble reports for you in plain language. For a lean agency team, that is real reporting capacity back in the day.
Your clients’ data stays protected: the integration starts read-only with scoped API tokens, and DataLion runs in ISO 27001-certified data centers in Germany, 100% GDPR-compliant with a Data Processing Agreement. Learn more on the AI & automation page.
- MCP integration for Claude & other AI agents — read-only by default
- Scoped API tokens keep each client’s data under control
- ISO 27001-certified data centers in Germany, 100% GDPR-compliant
- A new DataLion version every two weeks
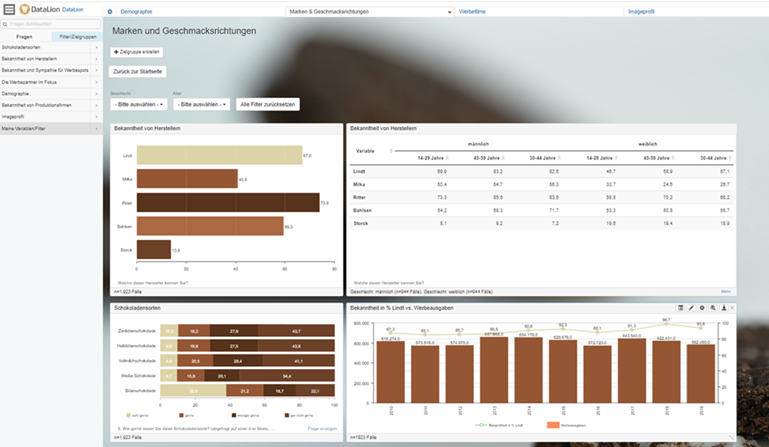
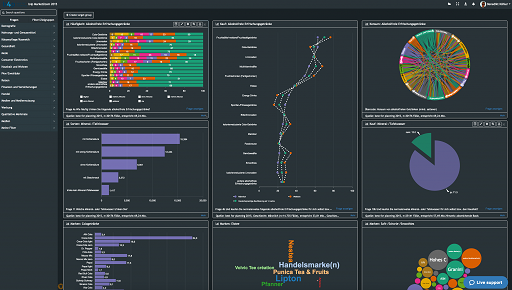
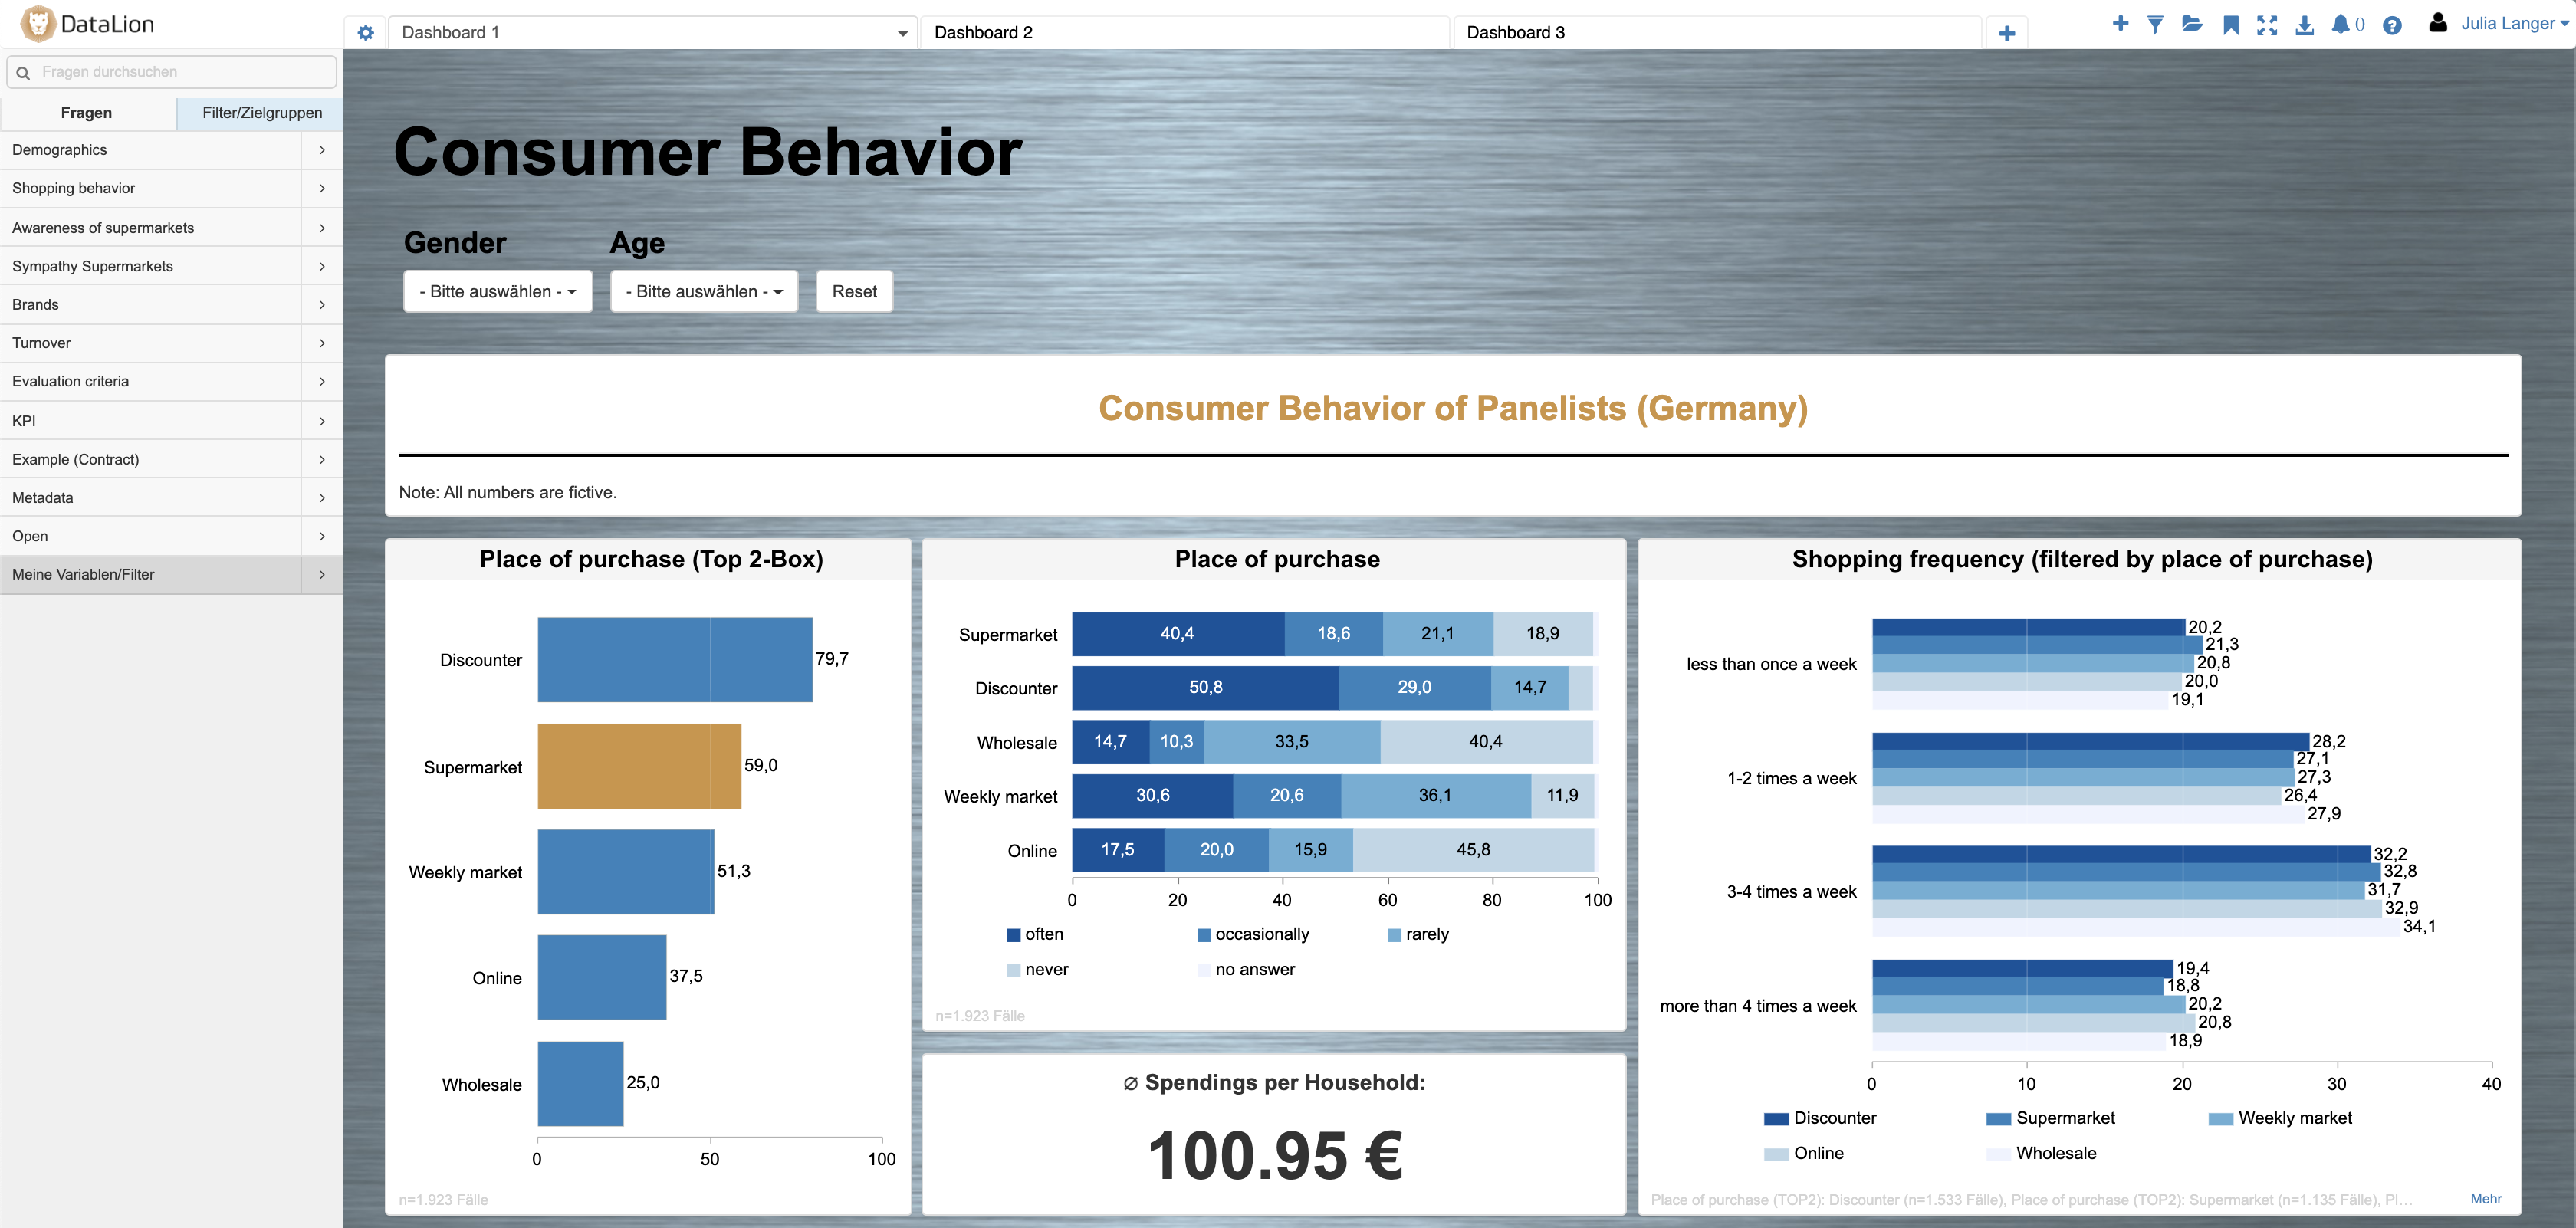
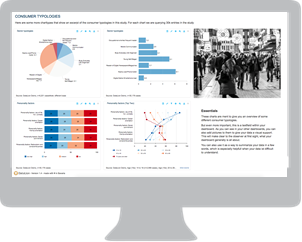
What you can build with DataLion
See DataLion with your own data
Start a free trial or book a personal demo — from raw data to a finished dashboard.

We now work much more efficiently, giving us more time to take care of the derivations and insights from the data for the customers.
The platform in detail
Common questions from agencies
Can DataLion dashboards be fully white-labeled?
Can I manage several clients from one account?
Which campaign data sources can I combine?
Can I still deliver PowerPoint reports?
Is our clients’ data secure?
Ready to put your client reporting on autopilot?
Try DataLion free and build a white-label client dashboard with your own campaign data. Or book a personal demo and see the multi-client platform live.