HR Dashboards & People Analytics
From the employee survey through preparation and statistics to the interactive HR dashboard — all in one software. Combine soft and hard HR metrics and make data-driven decisions. ISO 27001-certified hosting, GDPR-compliant, made in Munich.
DataLion is a web-based dashboard platform, made in Munich, for HR dashboards and people analytics. It covers the entire workflow — from the employee survey through preparation and statistics to the interactive HR dashboard. You combine soft KPIs (engagement, satisfaction, eNPS) with hard KPIs (headcount, attrition, recruiting) — ISO 27001-certified hosting and GDPR-compliant.
- 🇩🇪 Made in Munich
- GDPR-compliant
- DPA included
- Hosted in Germany
Trusted by research, insights & media teams
- 50+ interactive chart types
- 20+ statistical methods (R)
- 2 weeks release cadence
- ISO 27001 certified data centers (Germany)
From employee survey to HR dashboard — with no tool switching
HR data usually comes from many sources: surveys in one tool, prep in SPSS, charts in Excel, the cockpit in PowerPoint. DataLion unites that chain in one platform — each step builds on the previous one, with no export and no media break.
Here is the continuous flow from the survey to the finished HR dashboard — each step has its own page with the full detail:
- Survey software: pulse & employee surveys with 20+ question types — answers become SPSS variables automatically.
- Data import & integration: HR master and panel data from SPSS incl. labels, CSV, Excel, ASCII and databases.
- Data preparation: weight, clean, recode and analyze open-ended responses — directly on the dataset.
- Analysis & statistics: 20+ procedures on an R engine incl. driver and significance analyses.
- Dashboard software: interactive HR cockpits and reports in one click.
What is an HR dashboard?
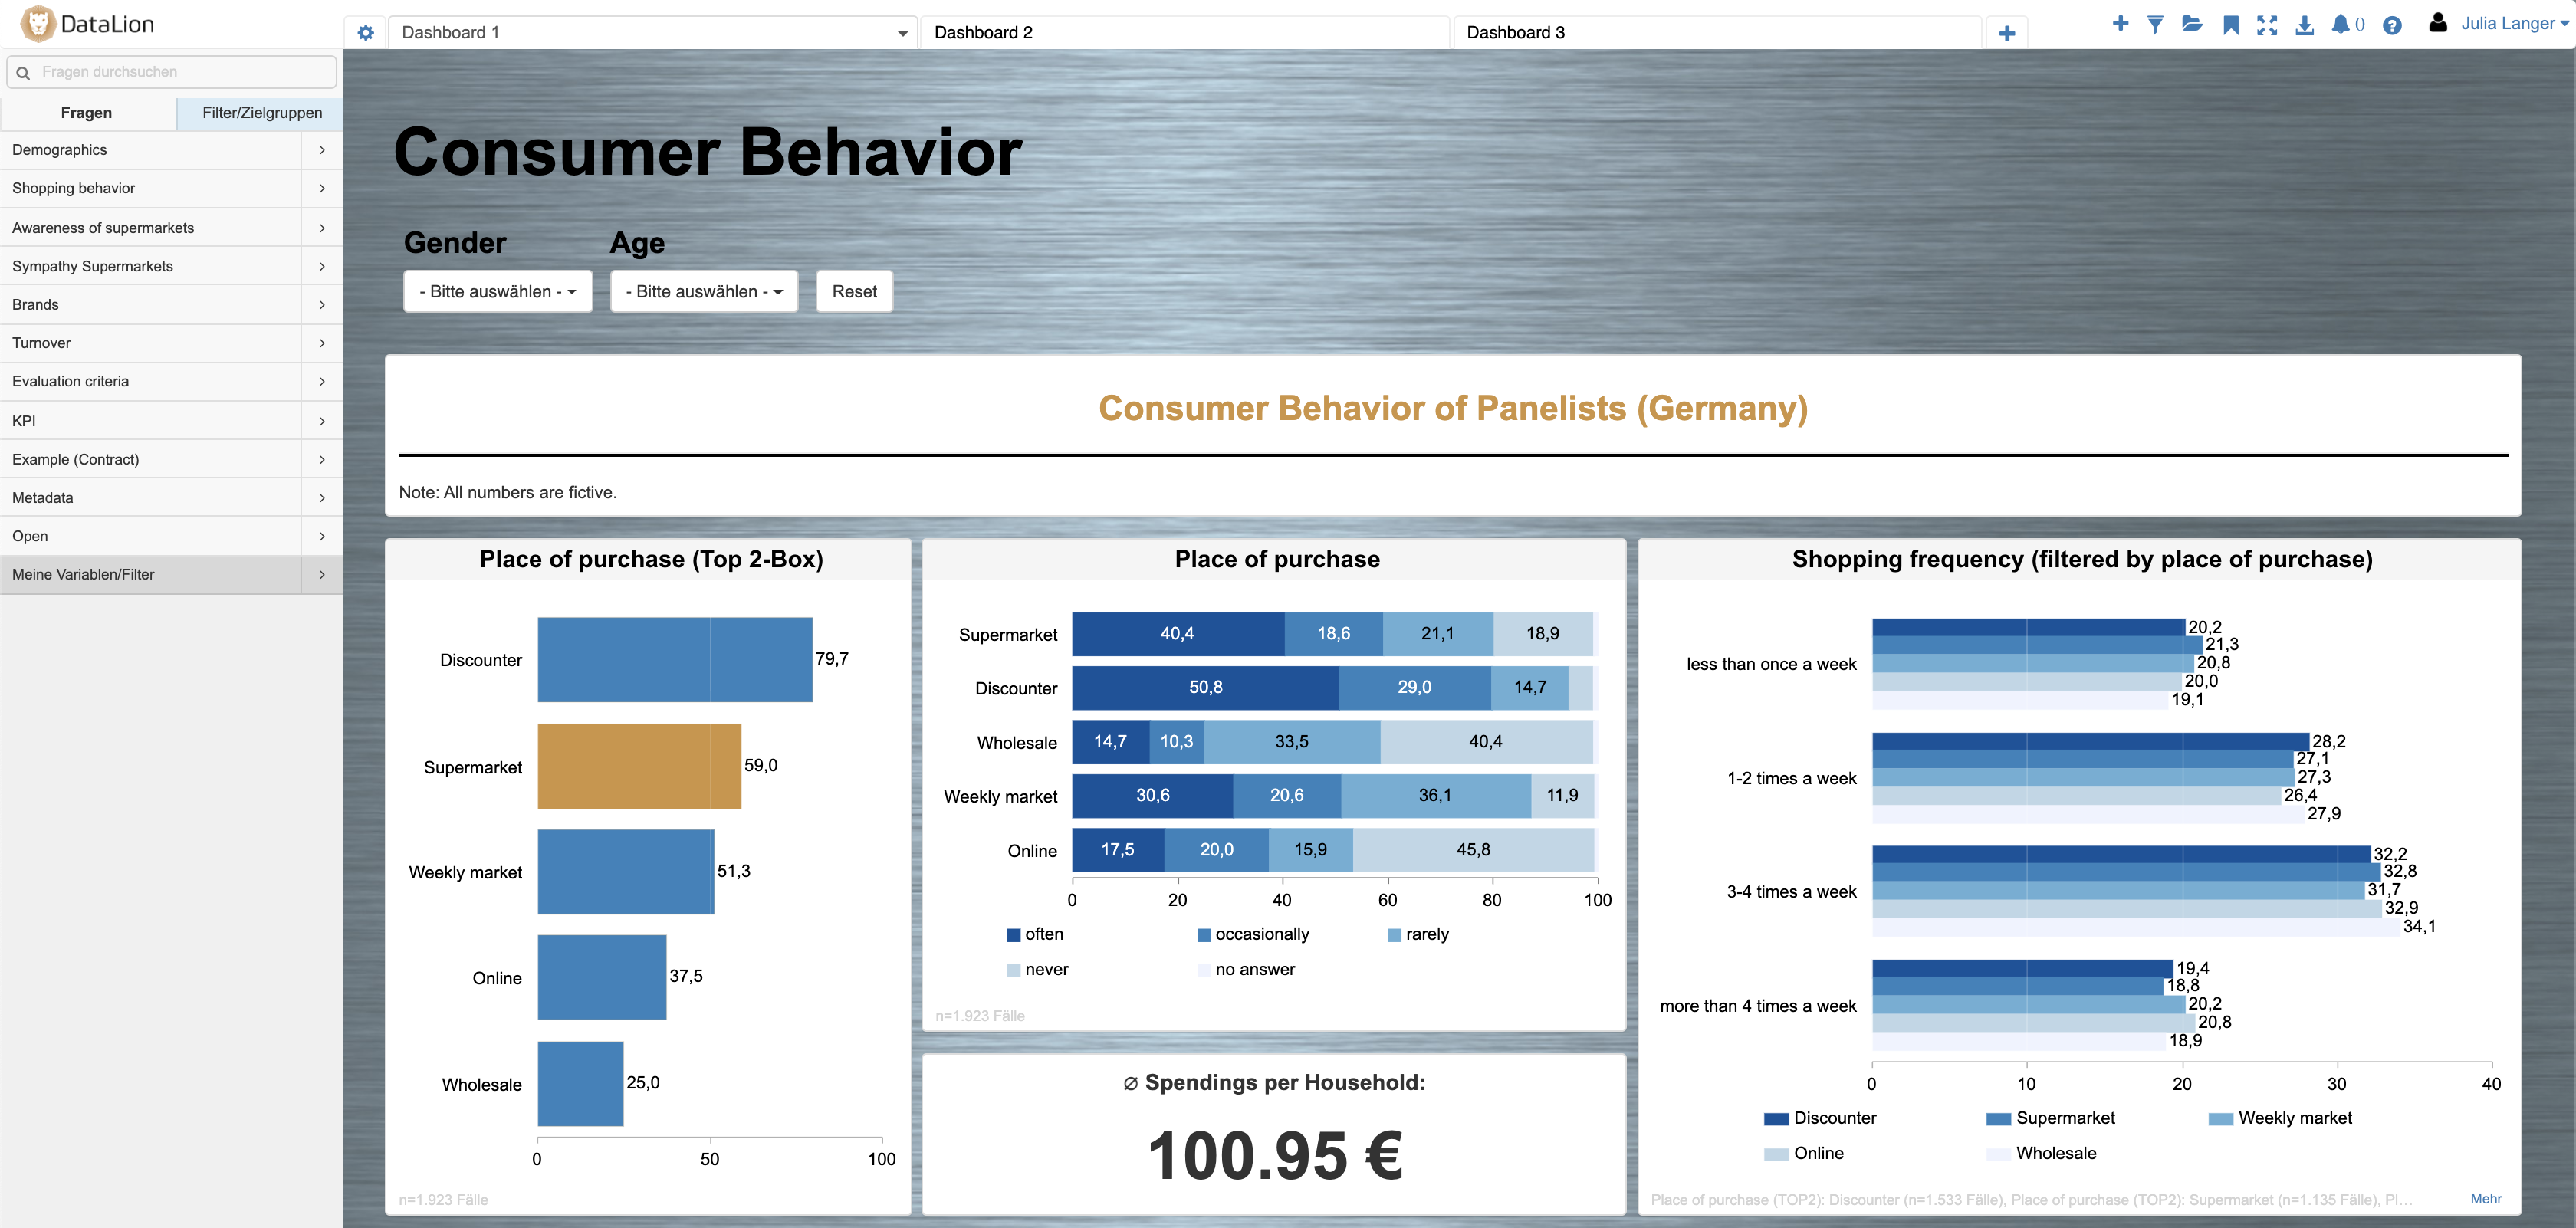
An HR dashboard is an interactive cockpit that brings the most important people metrics into one place and presents them graphically. Instead of hunting figures across scattered systems, you get headcount, attrition, recruiting and engagement at a glance — and drill down into the detail.
That is how you answer the questions that matter in People & Culture: which channels recruit most successfully? How high is employee satisfaction, and which measures lift engagement? Which high potentials should you nurture to reduce attrition?
- All HR metrics in one cockpit instead of scattered systems
- Graphical representation with deep dives for richer insight
- Answers to concrete people-analytics questions
- Built by drag & drop — with no programming
Turn an employee survey straight into an HR dashboard
Measure the soft factors with your own pulse and employee surveys: 20+ question types incl. Likert matrix and NPS, skip and display logic, and invitations via QR code, embed or one-time invite link. Answers become SPSS-style variables automatically — with no export.
From the same data you build your HR dashboard in a few clicks. That is how you measure eNPS, satisfaction and engagement and track them across flexible time series — wave after wave. More on the survey software.
- 20+ question types incl. Likert matrix & NPS for eNPS
- Skip & display logic, QR-code, embed and invite links
- Answers become variables automatically — no export
- From survey straight into the dashboard — wave after wave
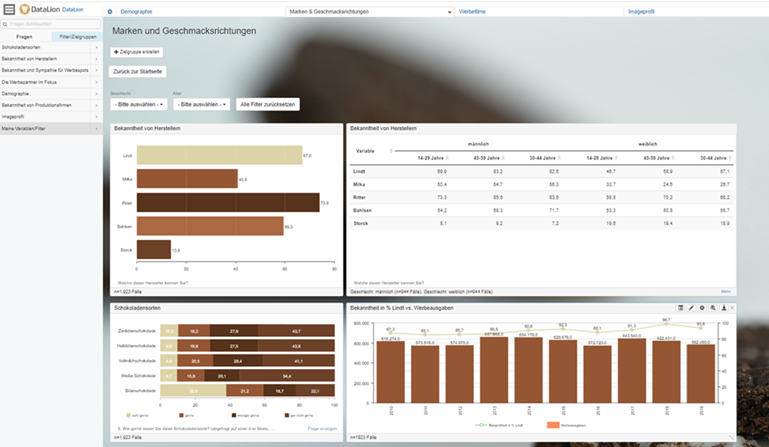
Visualize engagement, attrition & recruiting
DataLion combines subjective (soft) and objective (hard) metrics in one cockpit. Soft KPIs like satisfaction, eNPS, work-life balance, engagement, employer attractiveness and diversity come from your surveys — hard KPIs like headcount, absence, turnover rate, open positions, time-to-hire and personnel costs come from your systems.
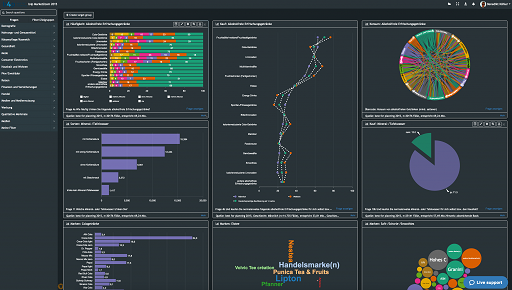
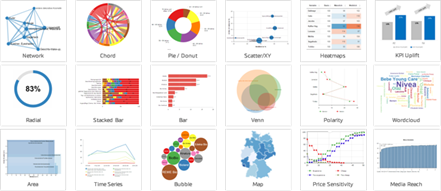
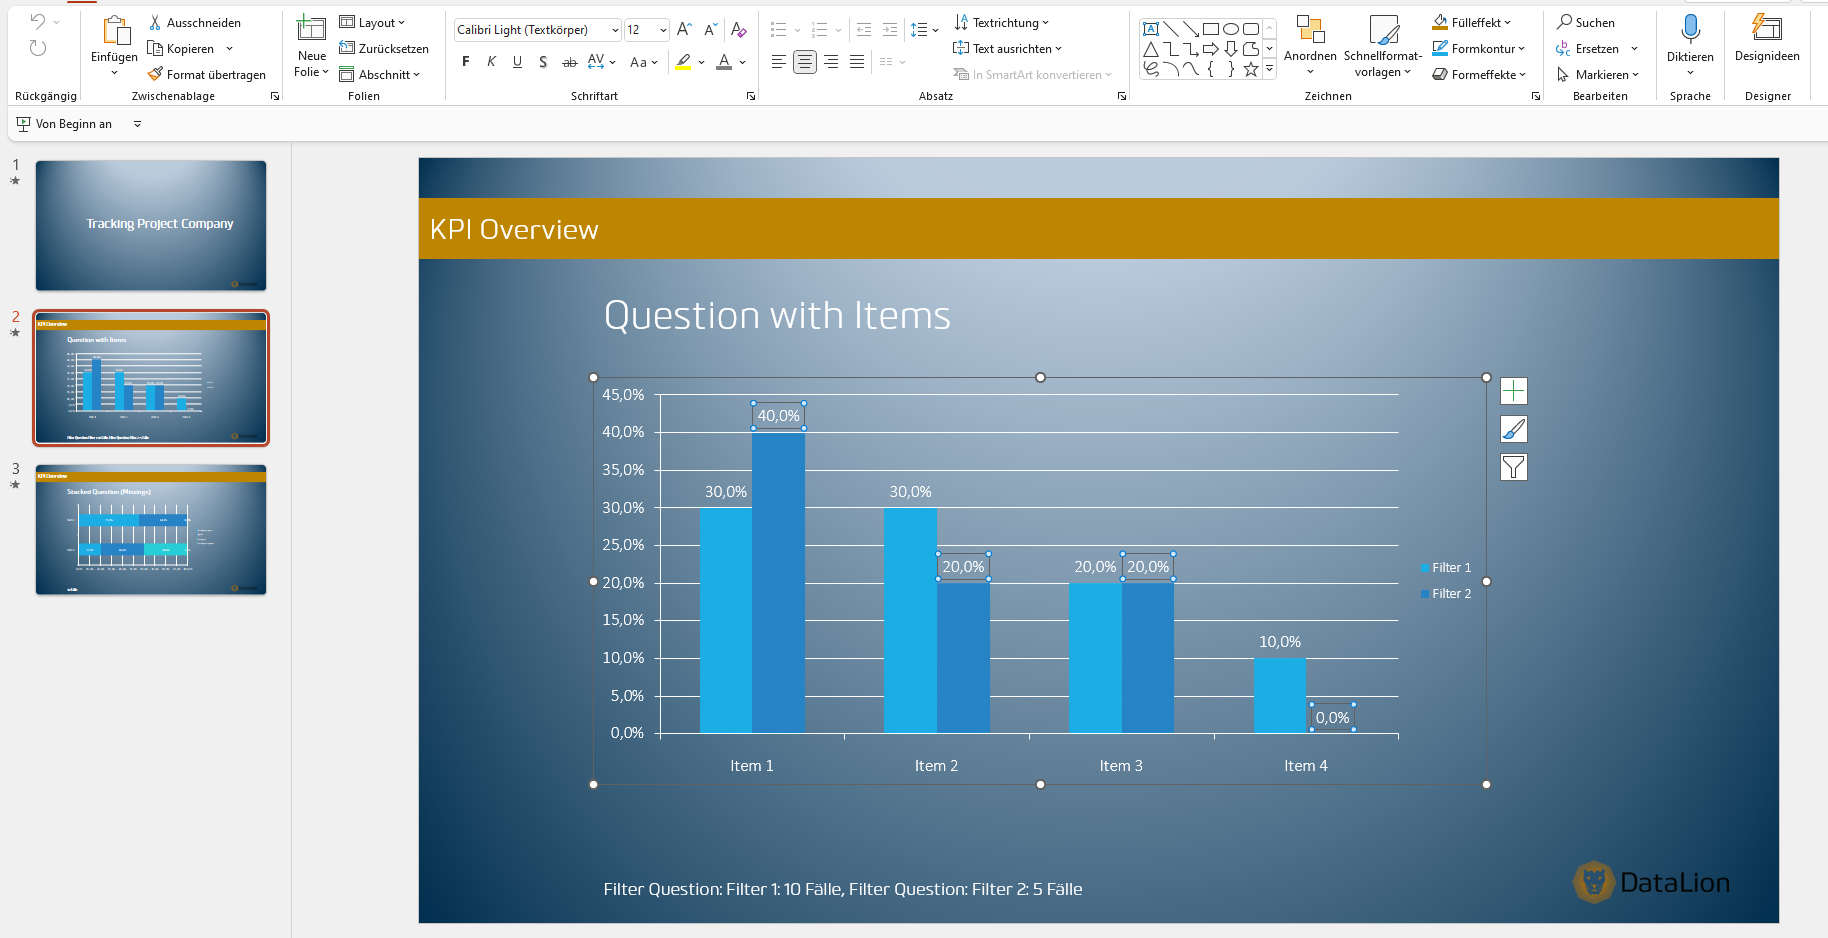
More than 50 interactive chart types cover every question — from bars, donut and heatmap to network, chord and scatter-plot charts. Filter live by team, department, location, function or length of service and compare segments over time.
- Soft KPIs: satisfaction, eNPS, engagement, work-life balance, culture
- Hard KPIs: headcount, attrition, recruiting funnel, time-to-hire, absence
- Filters & drill-downs by team, department, location or segment
- Flexible time series to track every metric
Statistics & native PowerPoint export in your CI
For deeper people-analytics insight, 20+ statistical procedures run on an R engine — from driver analysis (which factors drive engagement?) through regression and ANOVA to significance tests at confidence levels from 80% to 99%. Weighting, flexible bases and open-ended responses are handled directly in the software.
Export your results in one click as natively editable PowerPoint in your own master, as Excel report books or as PDF. Once set up, reports refresh automatically — ideal for a recurring employee survey or an ongoing HR tracking study.
- Driver analysis, regression, ANOVA & significance tests on an R engine
- Weighting, flexible bases & open-ended responses without export
- Natively editable PowerPoint with your own master, plus Excel & PDF
- Reports & dashboards refresh automatically — wave after wave
Data protection for HR data — by design
Employee data is among the most sensitive data in any company. With DataLion it stays in safe hands — fine-grained rights and roles ensure everyone in HR only sees the data they are authorized for.
- ISO 27001-certified data centers in Germany
- 100% GDPR-compliant, Data Processing Agreement (DPA) included
- On-premise hosting and IP-restricted access available
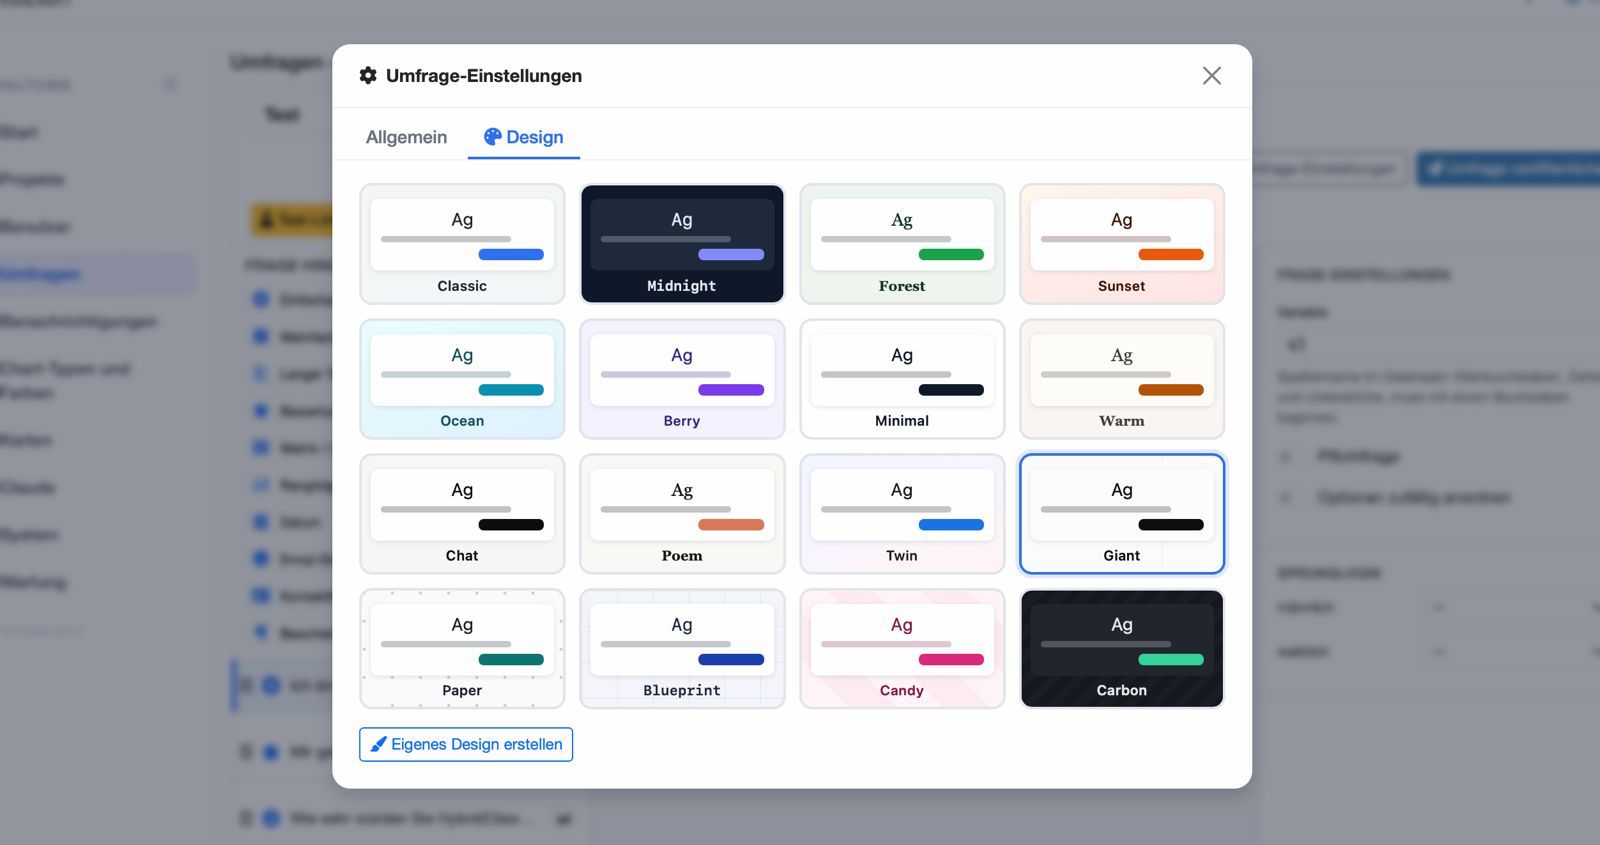
- Multi-client ready, rights & roles per user, full CI theming
See DataLion with your own data
Start a free trial or book a personal demo — from raw data to a finished dashboard.

We now work much more efficiently, giving us more time to take care of the derivations and insights from the data for the customers.
The platform in detail
Common questions about HR dashboards & people analytics
What is an HR dashboard?
What is the difference between soft and hard HR KPIs?
Can I turn an employee survey straight into a dashboard?
How secure is sensitive employee data in DataLion?
By which dimensions can I filter HR data?
Which data sources can I import for my HR dashboard?
Ready for people analytics in one platform?
Try DataLion free with your own HR data — from the employee survey to the finished dashboard. Or book a personal demo and see the platform live.