Startup KPI Dashboards & Investor Reporting
Show your traction at a glance. Turn web, product and financial data into live KPI dashboards, and build the investor and board deck in one click — no BI team required. Free trial. ISO 27001-certified hosting, GDPR-compliant, made in Munich.
DataLion is a web-based dashboard platform, made in Munich, that lets startups build investor- and board-ready KPI dashboards without a BI team. Import traction, growth and financial data from your web, product and finance tools, track it live, and export a board deck in native PowerPoint in one click — with a free trial, ISO 27001-certified hosting and GDPR-compliant.
- 🇩🇪 Made in Munich
- GDPR-compliant
- DPA included
- Hosted in Germany
Trusted by research, insights & media teams
- 50+ interactive chart types
- 20+ statistical methods (R)
- 2 weeks release cadence
- ISO 27001 certified data centers (Germany)
Investor updates shouldn't eat a week
- Every board meeting means rebuilding the same KPI deck by hand from scratch.
- Numbers live in five tools and never quite agree with each other.
- There is no budget — or time — to stand up a real BI stack.
Investors, board & team — on the same numbers
Your most important job is building the product — not rebuilding a KPI deck every month. DataLion gives you one live dashboard for investors, the board and your team, so everyone looks at the same traction in real time.
Set it up by drag & drop in an afternoon — no BI stack, no data engineer, no code — and stop the monthly spreadsheet scramble before each board call.
- One source of truth for investors, board and team
- Built by drag & drop — no BI team, no code
- Live, on any screen, with a fullscreen mode for the board call
- Share by link instead of emailing yet another spreadsheet
The KPIs investors actually ask about
Put the metrics that prove momentum on one screen: MRR/ARR and growth rate, CAC and LTV, the acquisition funnel, activation and retention, burn and runway. Drill down from the headline number into a channel, cohort or segment whenever someone asks “why”.
More than 50 interactive chart types — from time series and funnels to cohort heatmaps — visualize any metric, and flexible time series show the trend month over month.
- MRR/ARR, growth, CAC/LTV, funnel, retention, burn & runway
- Cohort and segment drill-downs for the follow-up question
- 50+ chart types incl. funnels, time series & cohort heatmaps
- Month-over-month trends across flexible time series
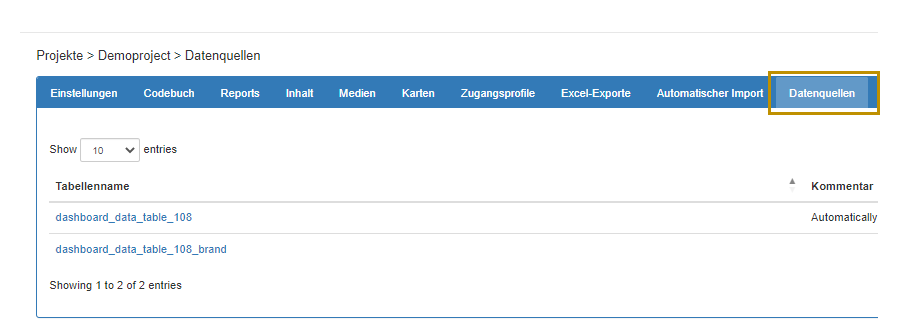
Live data from web, product & finance
Bring your numbers in from wherever they live: databases, Excel and CSV and live data sources. So web and product analytics, billing exports and financial KPIs all land in the same dashboard — no copy-and-paste between tools.
Once connected, your dashboards update automatically as new data arrives, so your traction story is always current — not a snapshot from three weeks ago.
- Import via database, Excel or CSV and live data sources
- Combine web/product analytics, billing & financial KPIs
- Dashboards auto-refresh — always current, never stale
- Map your metrics once and reuse them everywhere
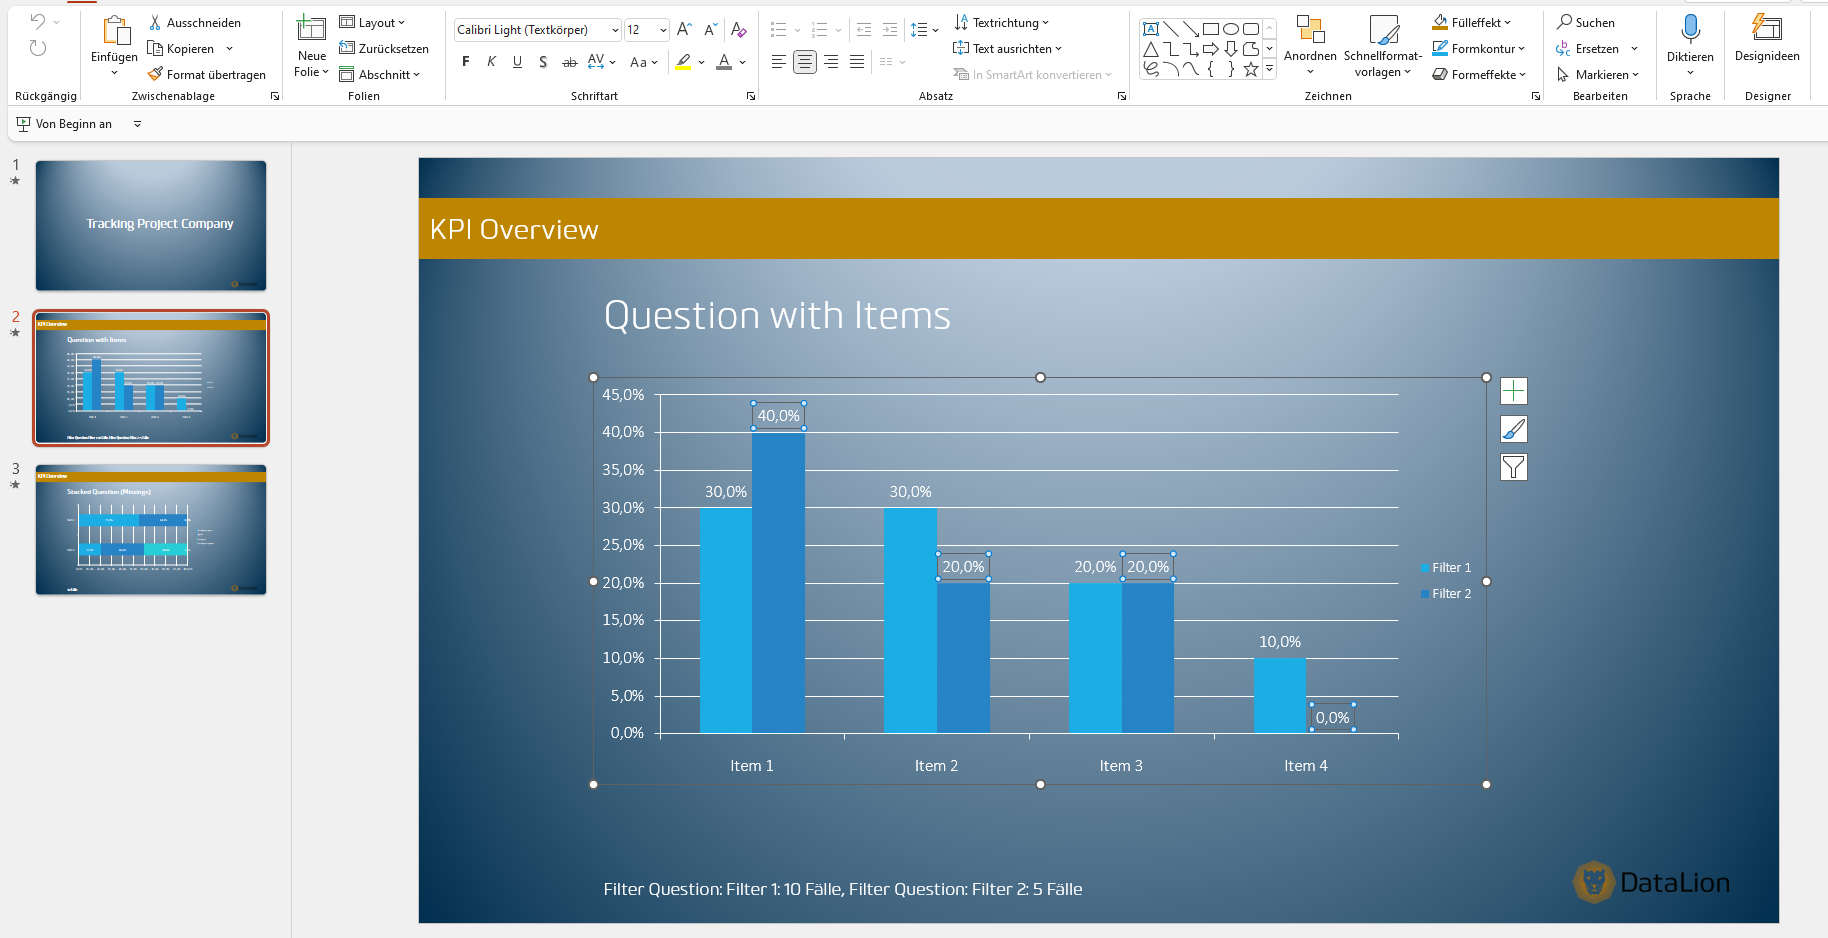
Board & investor decks in native PowerPoint
When it is board time, export your report in one click as natively editable PowerPoint with any number of slides. Charts come in as real PowerPoint diagrams, and with your own master the deck is already on-brand — a full update in minutes, not a lost evening.
Once set up, the deck and dashboards refresh themselves for the next month, so investor updates become a habit instead of a fire drill. Need raw numbers? Export Excel report books, PDF or images too.
- Real PowerPoint diagrams with your own master
- Board-ready update in minutes, not a lost evening
- Reports refresh automatically for the next monthly update
- Excel report books, PDF & image export as well
Built for lean teams — AI-fast and affordable
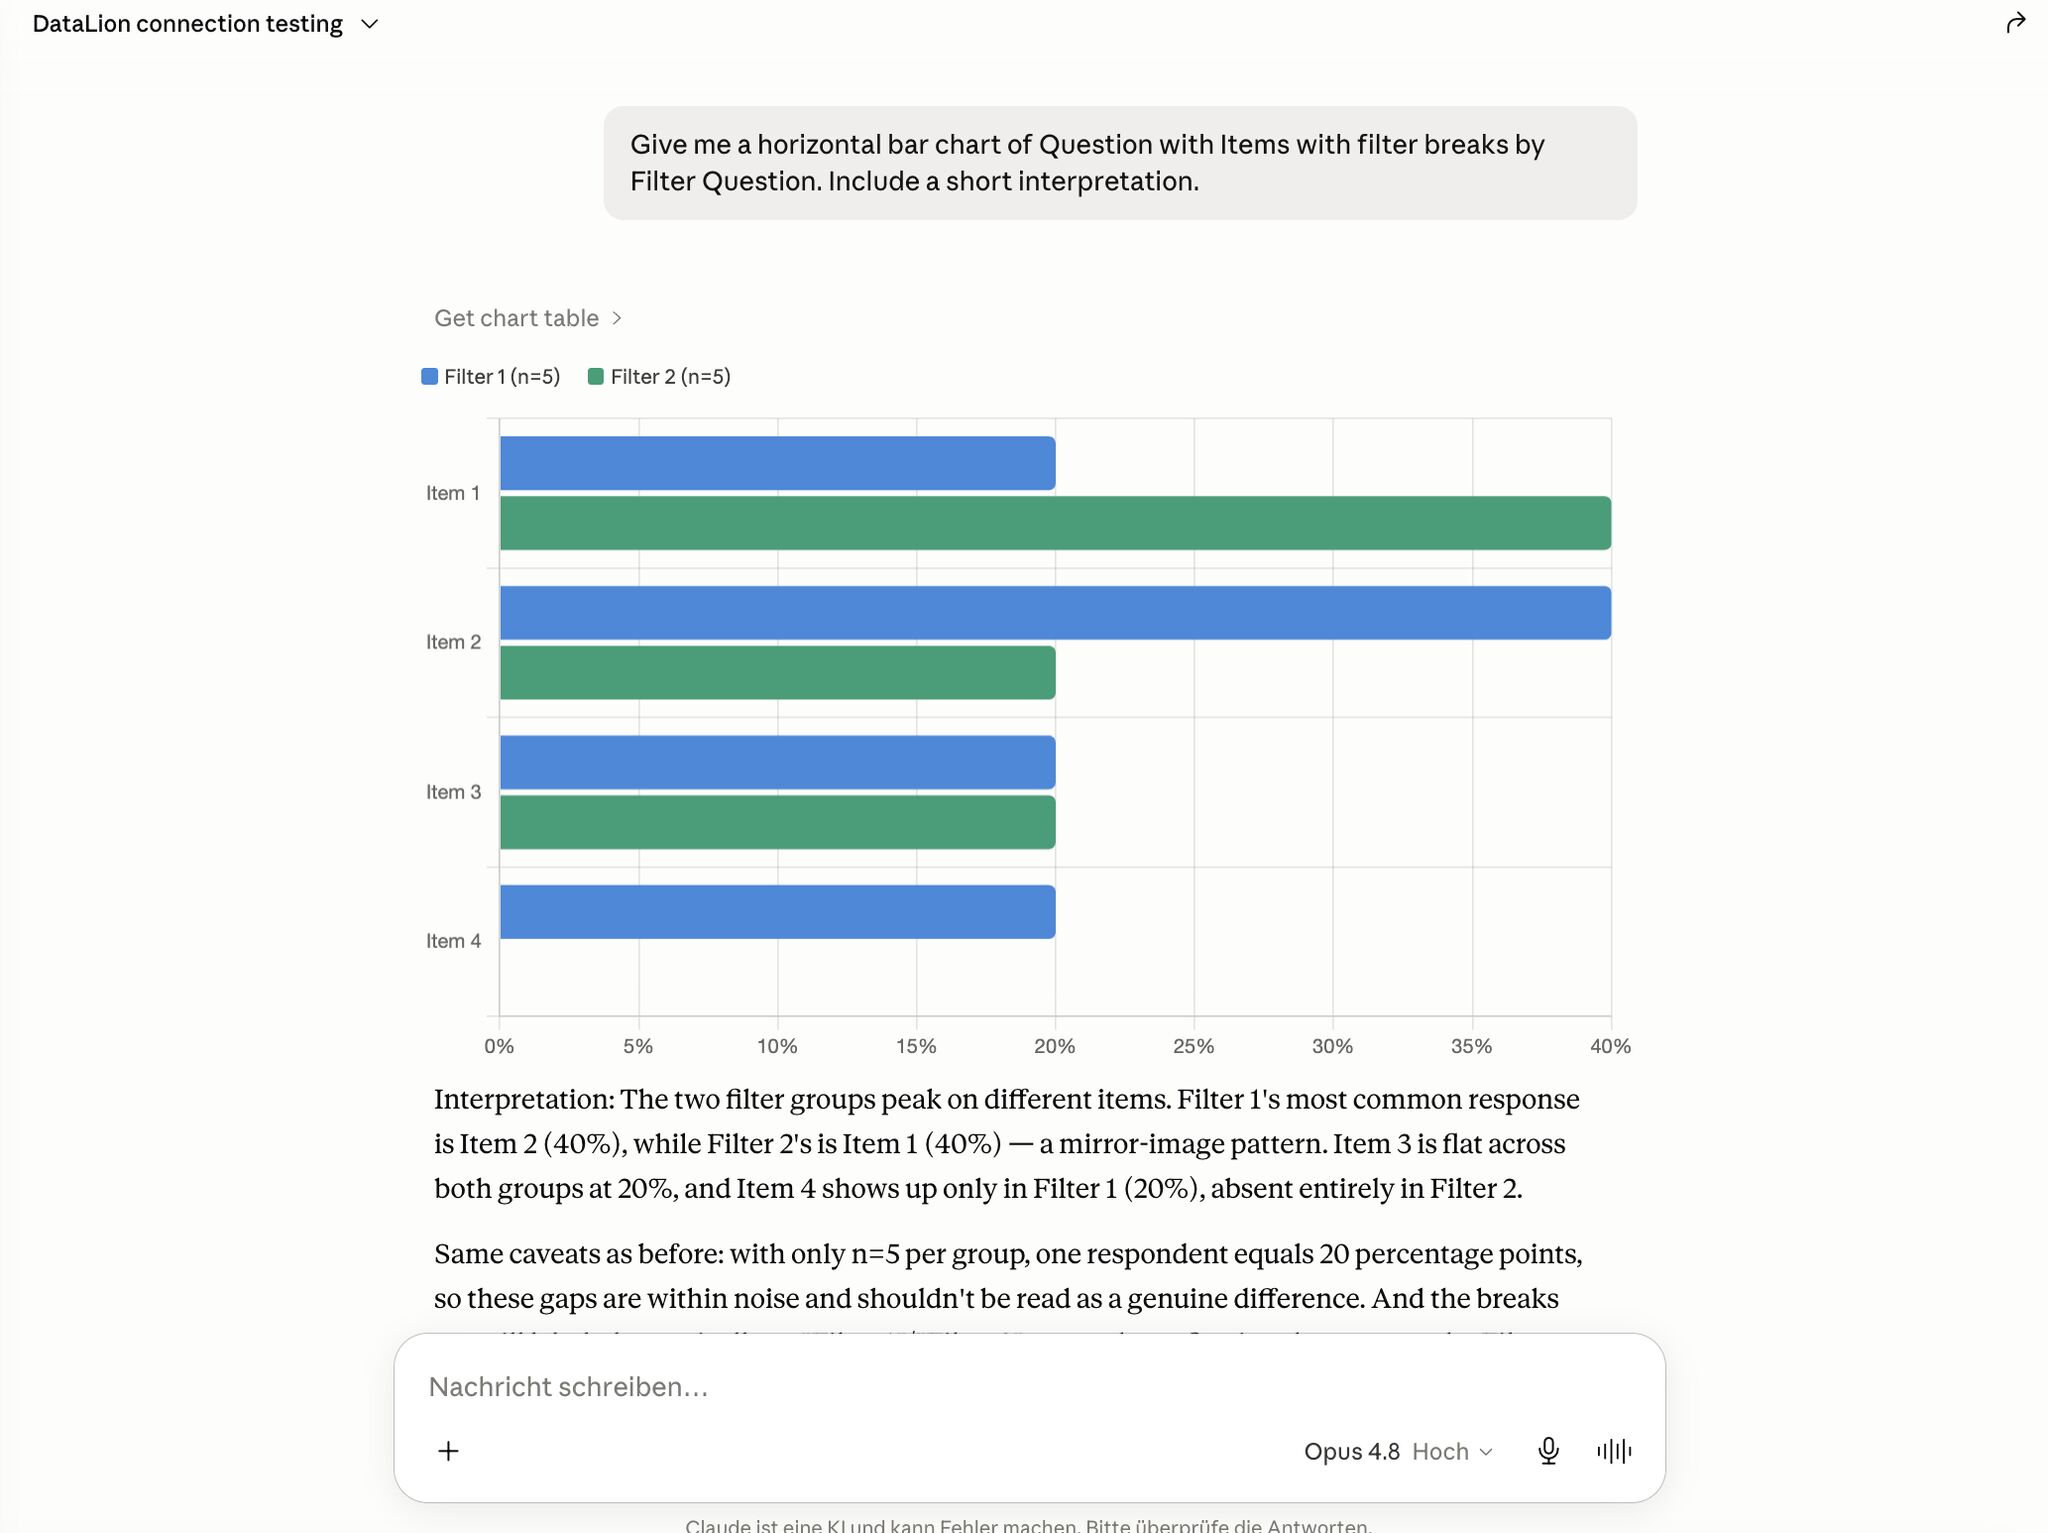
A small team can move fast with AI. Through the Model Context Protocol (MCP) you connect DataLion to agents like Claude and have them build dashboards, import data and assemble reports in plain language — read-only by default, with scoped API tokens.
No enterprise BI budget required: start on the free trial and grow as you do. And the investor-grade basics are covered — DataLion runs in ISO 27001-certified data centers in Germany, 100% GDPR-compliant with a Data Processing Agreement.
- MCP integration for Claude & other AI agents — read-only by default
- Free trial — no BI stack, no long onboarding
- ISO 27001-certified data centers in Germany, 100% GDPR-compliant
- A new DataLion version every two weeks
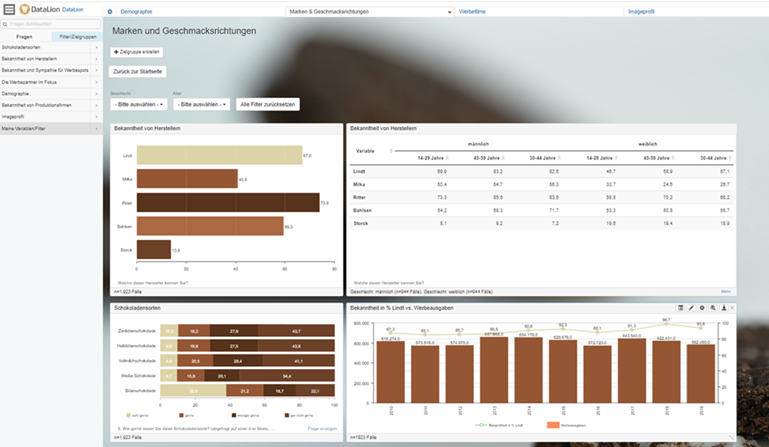
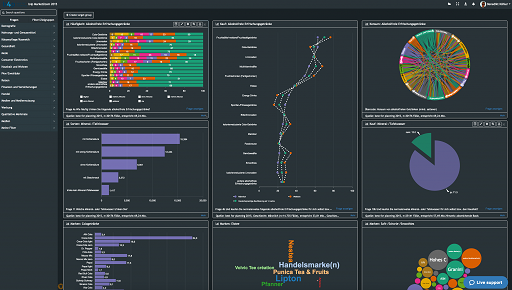
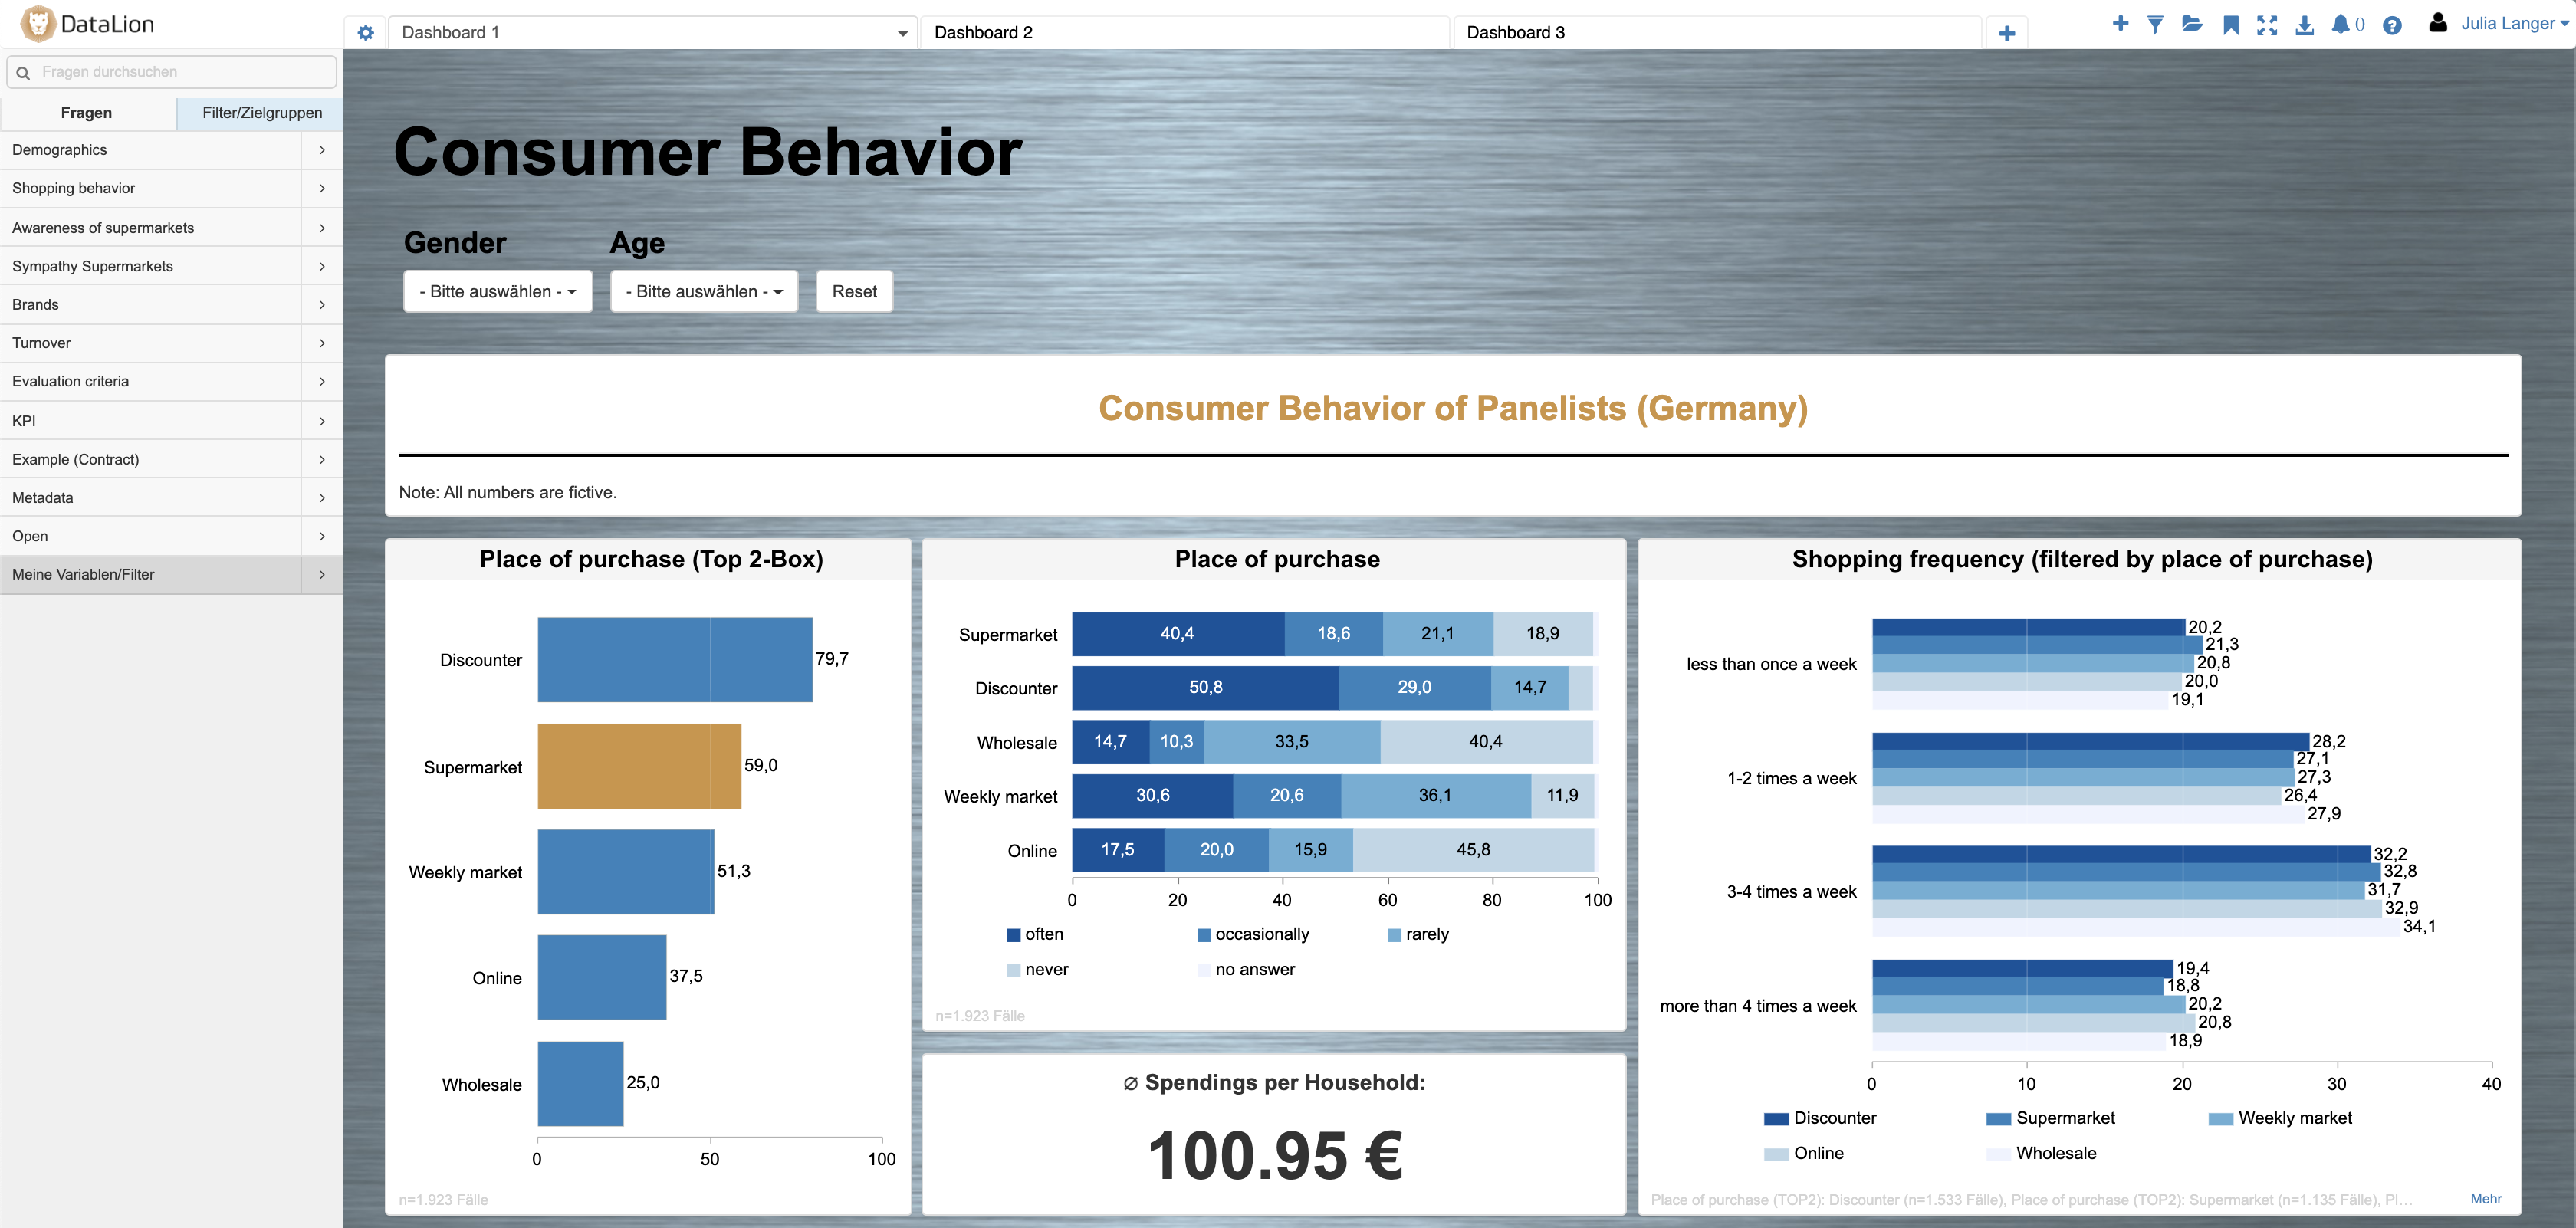
What you can build with DataLion
See DataLion with your own data
Start a free trial or book a personal demo — from raw data to a finished dashboard.

We now work much more efficiently, giving us more time to take care of the derivations and insights from the data for the customers.
The platform in detail
Common questions from startups
Do I need a BI team or data engineer to use DataLion?
Which startup KPIs can I track?
Where does the data come from?
Can I export a board deck to PowerPoint?
Is DataLion affordable for an early-stage startup?
Ready to show your traction on one dashboard?
Try DataLion free with your own KPIs — from web and product data to an investor-ready board deck. Or book a personal demo and see the platform live.