Analysis & statistics
20+ statistical procedures — on an R engine
Run demanding analyses right in the tool: significance tests, regressions, ANOVA and MaxDiff on an R engine. You also get crosstabs with means and top-box, plus smoothed timelines. Step 3 on the way from survey to dashboard.
DataLion's statistics engine runs on R. It offers 20+ predefined procedures: 6 significance tests (chi², z-test, t-test) and 18 models such as linear and logistic regression, ANOVA, relative importance and MaxDiff. Significance appears at confidence levels from 80% to 99% directly in crosstabs and charts.
- 🇩🇪 Made in Munich
- GDPR-compliant
- DPA included
- Hosted in Germany
- 🌐 Interface in EN, DE, FR & NL
20+ predefined procedures
DataLion's statistics engine runs on R. You do not export data or write R code. Pick the procedure and DataLion computes.
It includes 6 significance tests and 18 statistical models used in professional market research.
- Significance tests: chi² (pairwise, complement, independence), z-test, t-test (independent & dependent)
- Regressions: linear, ordinal, Poisson, binomial, multinomial, negative binomial, quasi-Poisson
- Variable selection: stepwise (forward/backward/both), Lasso, Ridge
- ANOVA and two-way ANOVA, relative importance
- MaxDiff (count, aggregate logit, random-parameter logit)
Significance testing that thinks along
Significance appears directly in tables and charts. Choose from four confidence levels (80%, 90%, 95%, 99%) and show the result as stars (*/**/***) or letters (a/A).
For chi² tests you can switch on the Yates correction; pairwise and complement comparisons are built in.
- 4 confidence levels: 80%, 90%, 95%, 99%
- Star or letter notation for significance
- Optional Yates correction for chi² tests
- Pairwise and complement comparisons
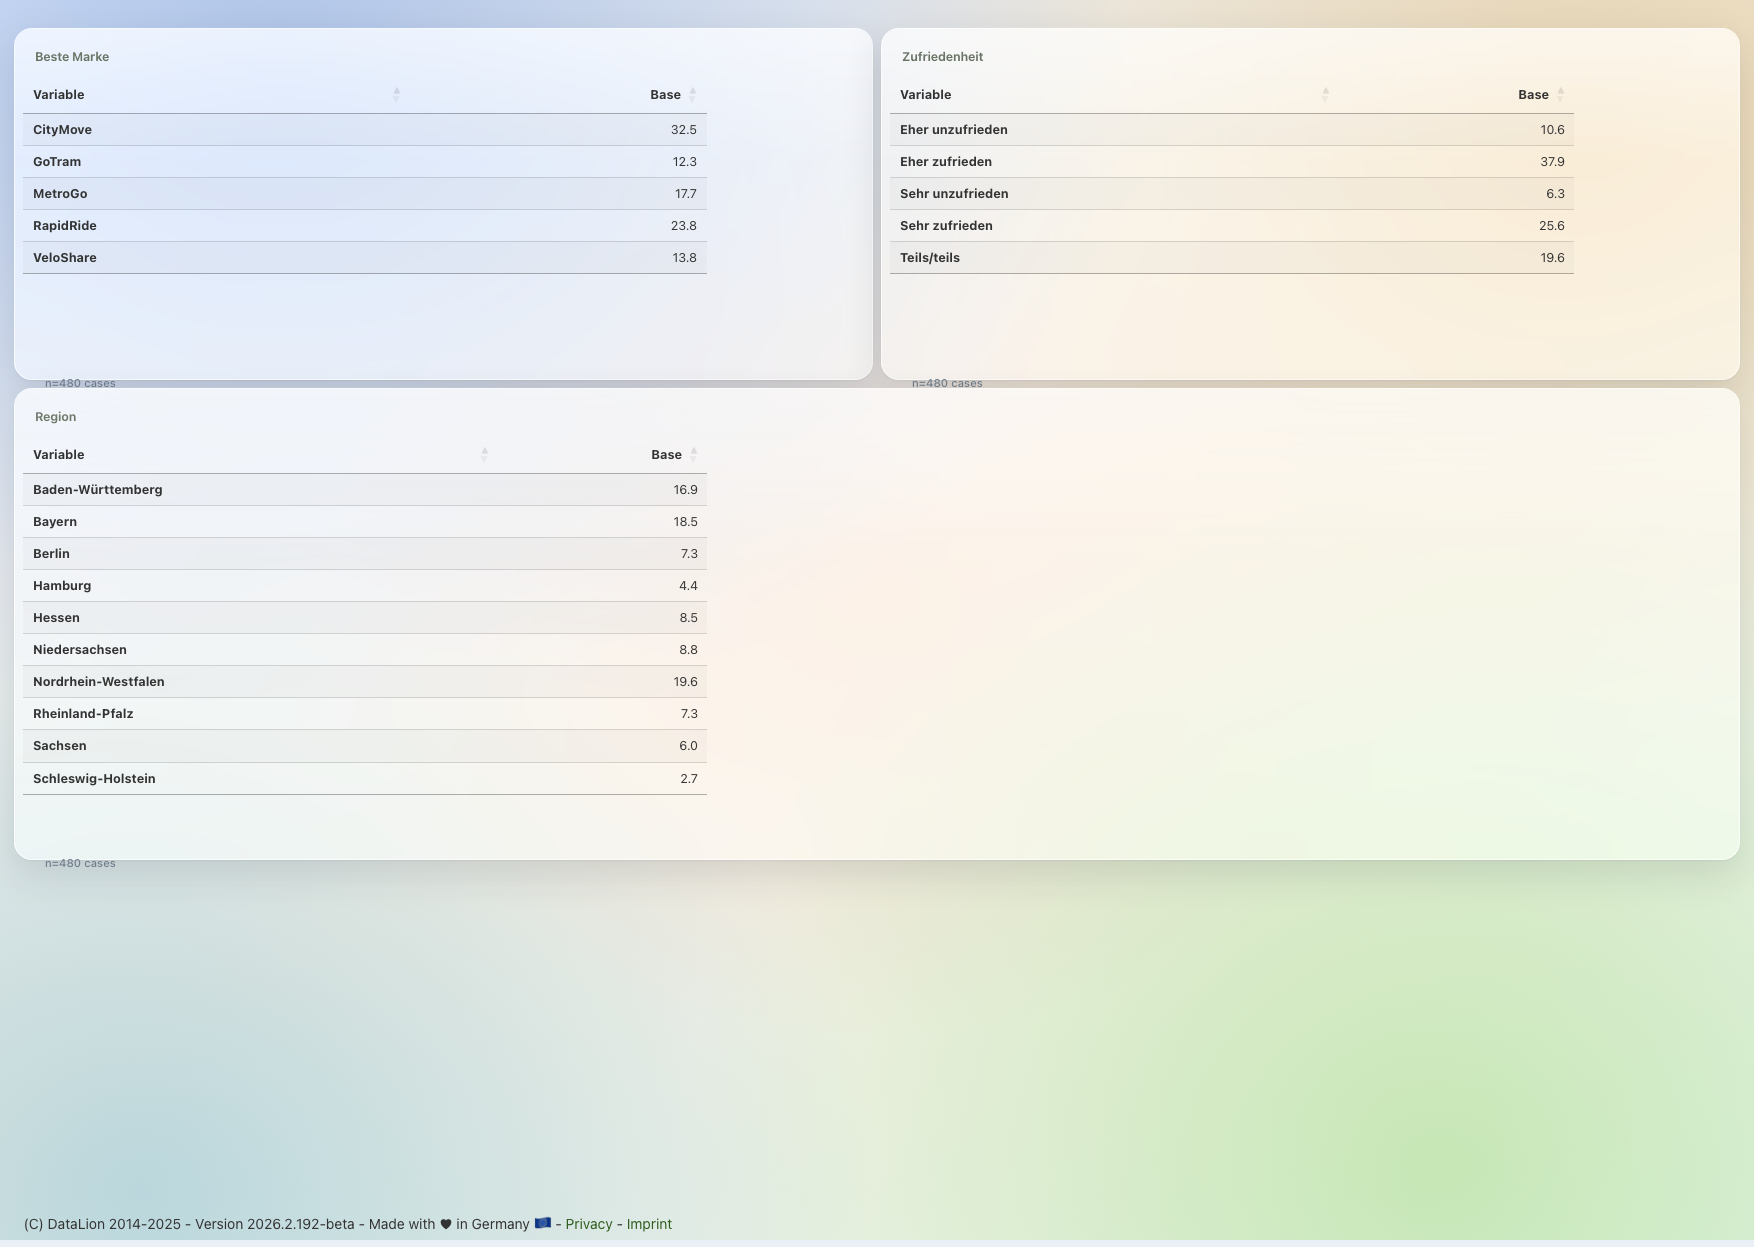
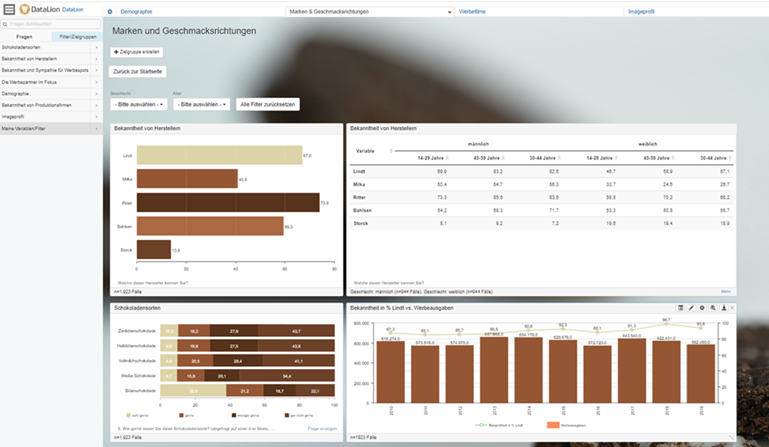
Tables with everything market research needs
Build crosstabs with subcolumns, sums and means, with percentages (row, column, cell, total), bases, index and top-box net rows.
Nested tables enable multi-dimensional analysis — consistent wave after wave.
- Subcolumns and nested tables
- Sums, means and index
- Percent by row, column, cell and total
- Top-box, top-2, top-3 and bottom net rows
Timelines with smoothing
For tracking studies, visualize trends as timelines — smoothed with a moving average (SMA) or an exponentially weighted average (EMA).
Projections and moving sums help separate trends from outliers cleanly.
- Smoothing via SMA (moving average) and EMA
- Freely chosen smoothing window
- Projections and moving sums
Before & after
Common questions about analysis & statistics
Which statistical procedures does DataLion offer?
How does DataLion report significance?
Can I build crosstabs with means and top-box?
Does DataLion support tracking studies with timelines?
Do I need to know R?
Finish your market research analysis
Try DataLion free: significance tests, regressions and crosstabs right in the tool — with no export. Or book a personal demo.