
Gallery
Public data & visualizations
The DataLion gallery publishes 18 studies as public dashboards — 2 built on real open data from Eurostat (Germany's regions, digital Europe) and 16 example studies on synthetic, computer-simulated data, from a media-planning study to streaming habits. Each dashboard opens without an account, can be filtered and cross-tabulated in the browser, and ships its dataset as a CSV download.
Rather collect your own data? 114 free survey templates — each one reports into a live dashboard automatically.
 Featured
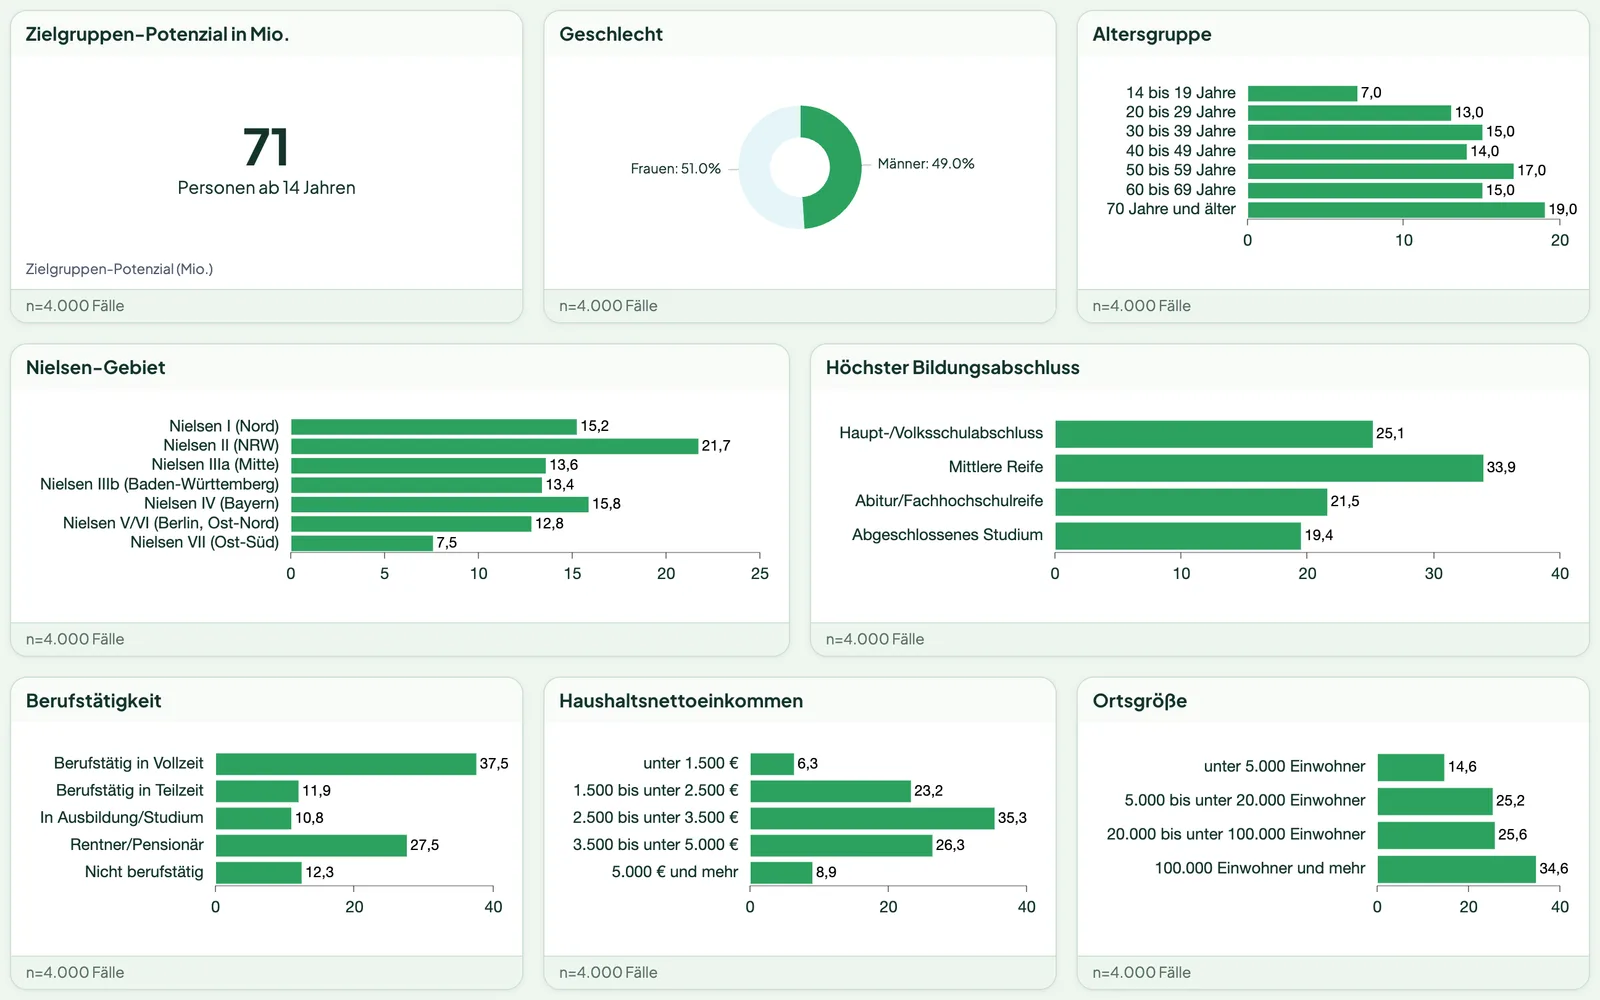
 Markt-Media-Studie
Count target groups like a media-planning tool: demographics, typologies, brands and reach currencies (WLK, readers per issue) projected in millions.
View study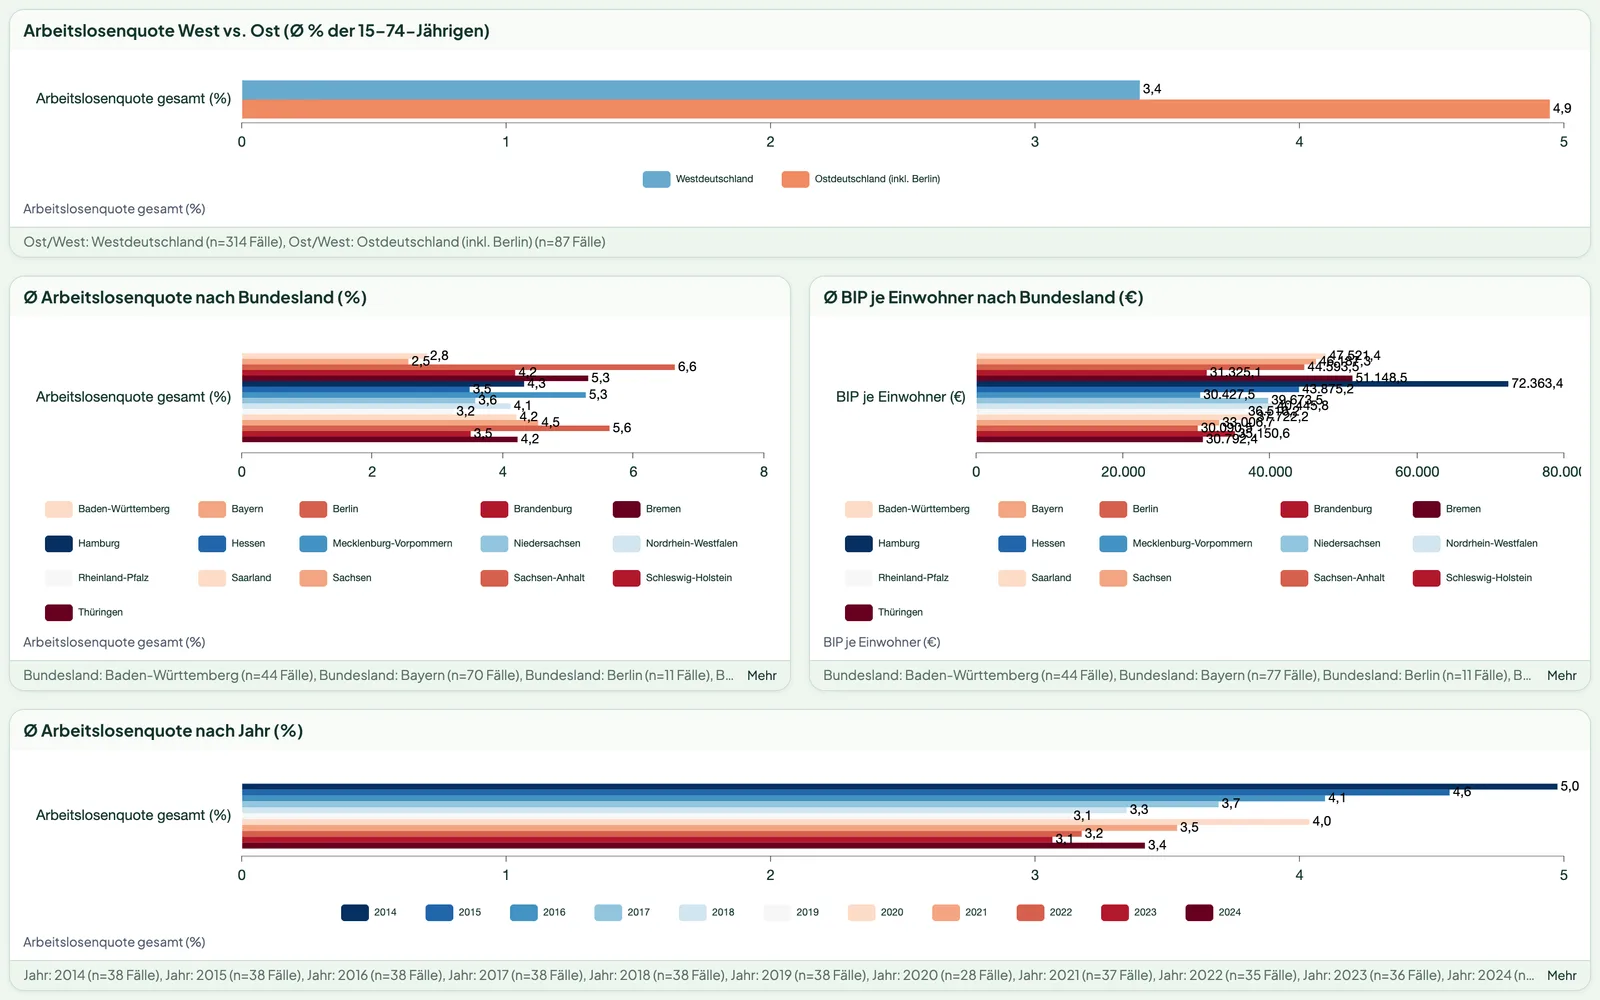 Featured
 Germany by region: labour & prosperity
Unemployment, GDP and population for all 38 German NUTS-2 regions since 2014 — real Eurostat figures, drillable from Bundesland to region.
View study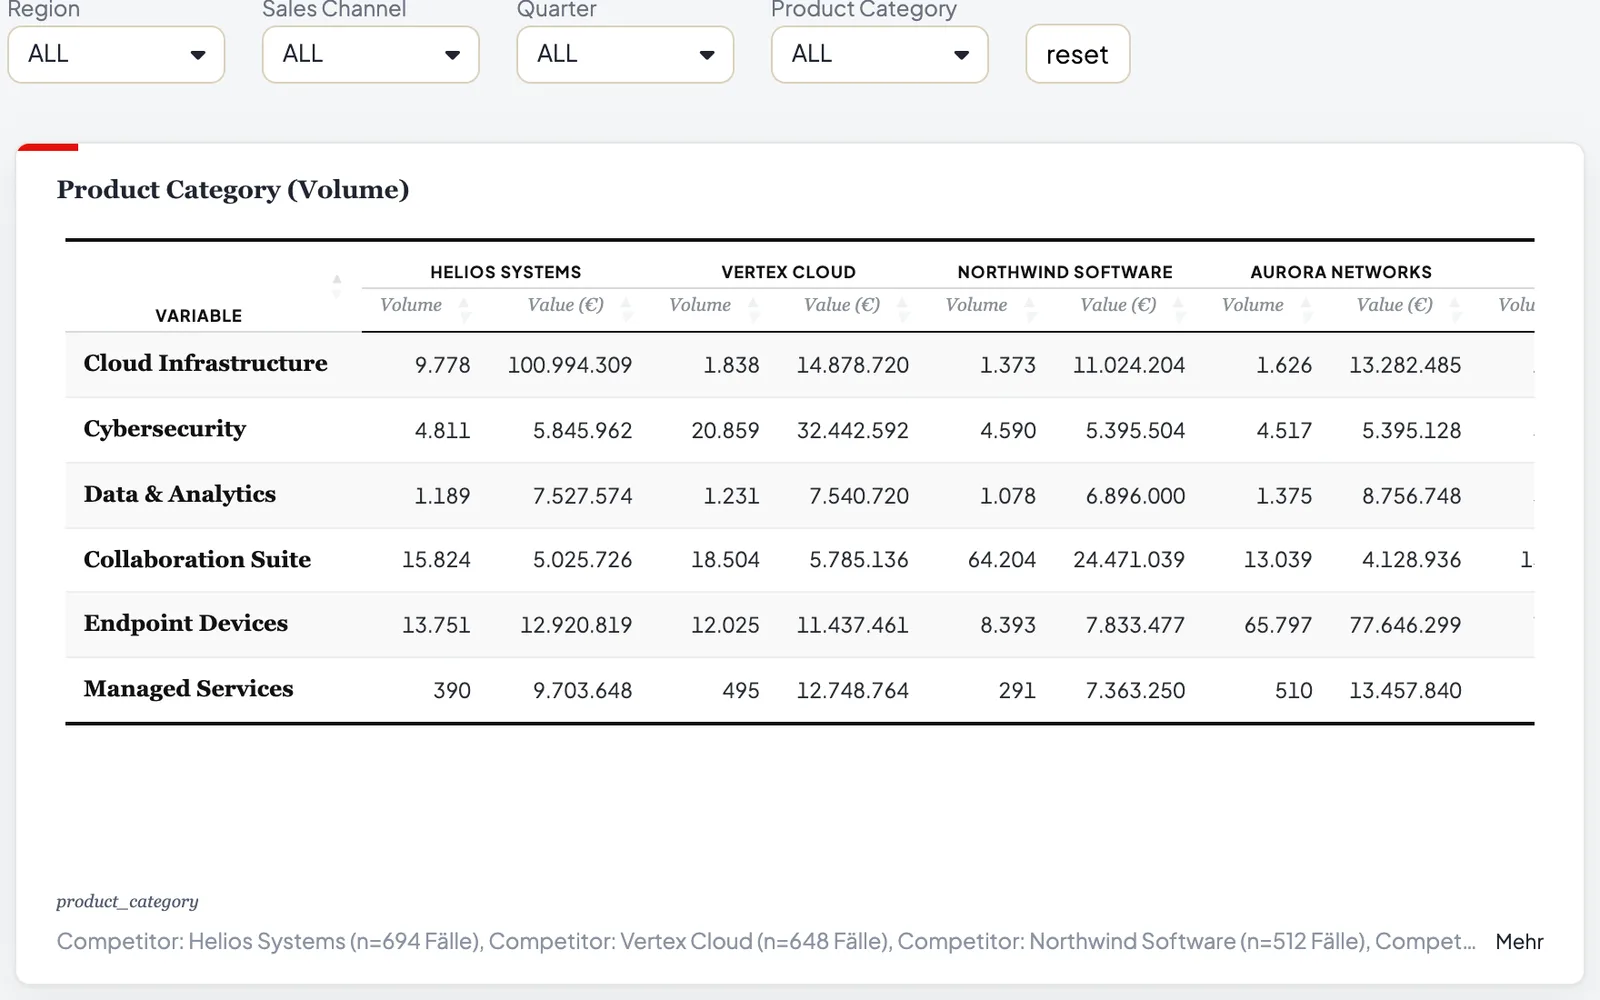 Featured
 Global Market Tracker
A BI market dataset with revenue driver coefficients, conditionally formatted target and margin tables, and live joins across transactions, targets and product metadata.
View study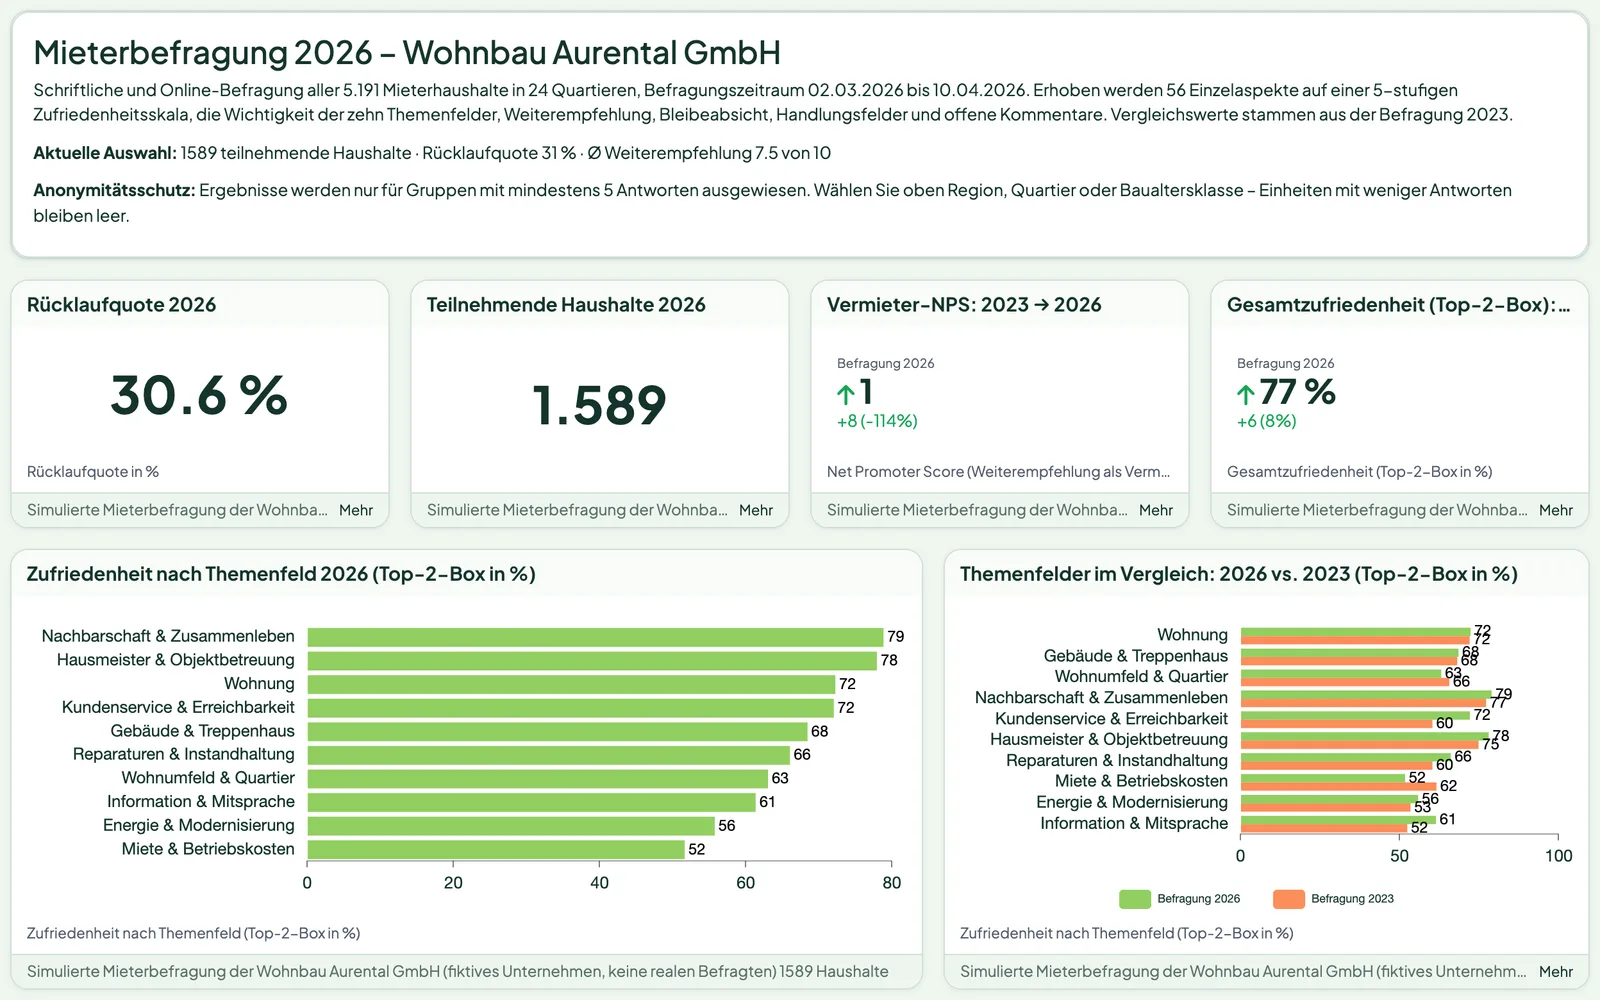 Featured
 Tenant survey: satisfaction, priorities & retention
The survey a mid-sized German housing company steers its portfolio with: satisfaction with 56 aspects across ten topics, alongside how important each topic is — the gap between the two shows where the next investment pays off. Plus a quarter-by-quarter comparison under an anonymity threshold, landlord NPS, intention to stay and open comments from two waves.
View study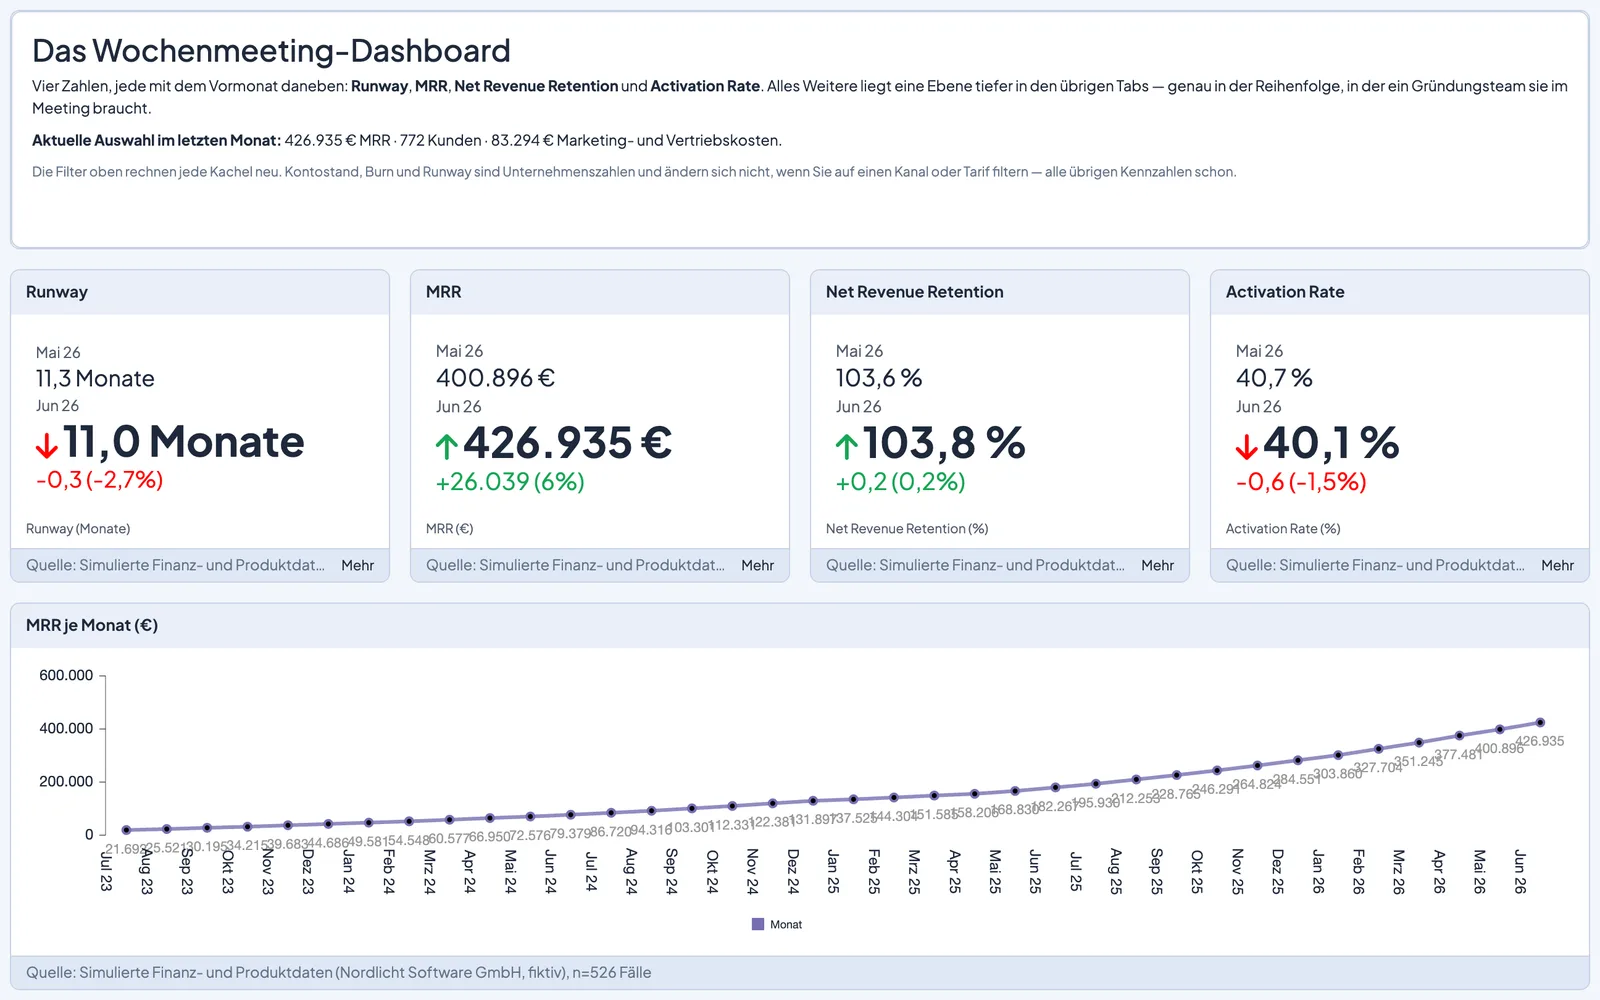 Featured
 Startup KPIs: runway, MRR & retention
The dashboard a founding team actually reviews every week: runway on net burn, an MRR bridge of new business, expansion, contraction and churn, NRR, CAC payback instead of LTV/CAC, and activation instead of signups — 36 simulated months of a B2B SaaS.
View study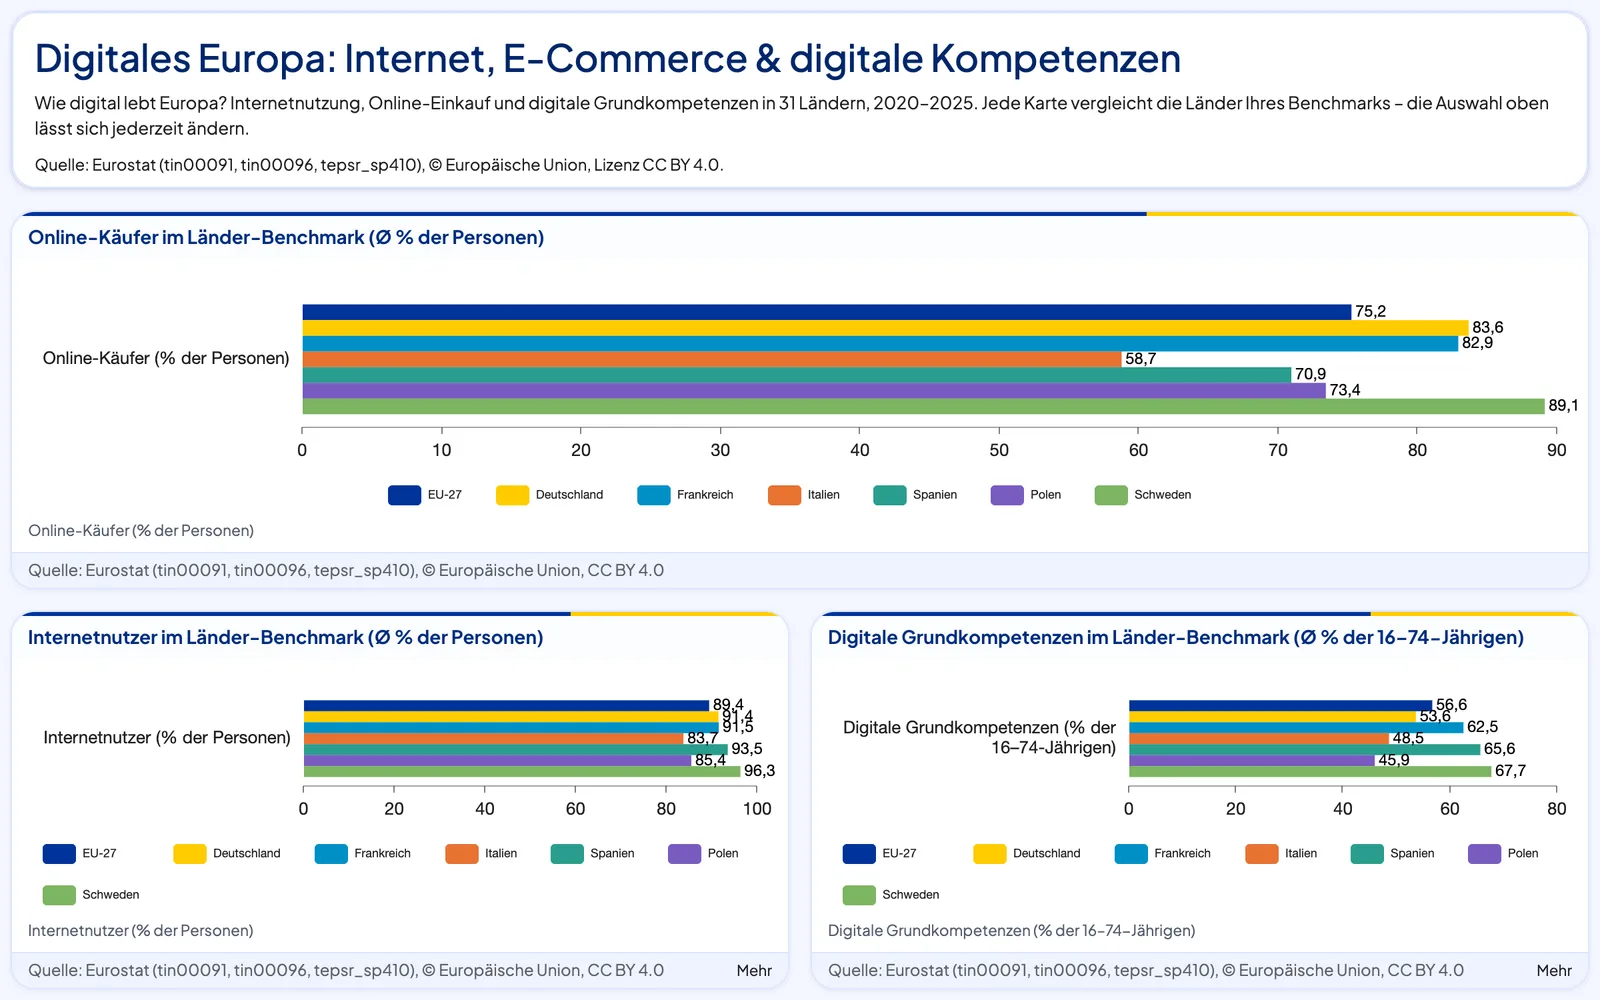 Featured
 Digital Europe: internet, e-commerce & skills
How 30 European countries use the internet, shop online and score on digital skills — real Eurostat figures with an EU-27 benchmark and a country map.
View study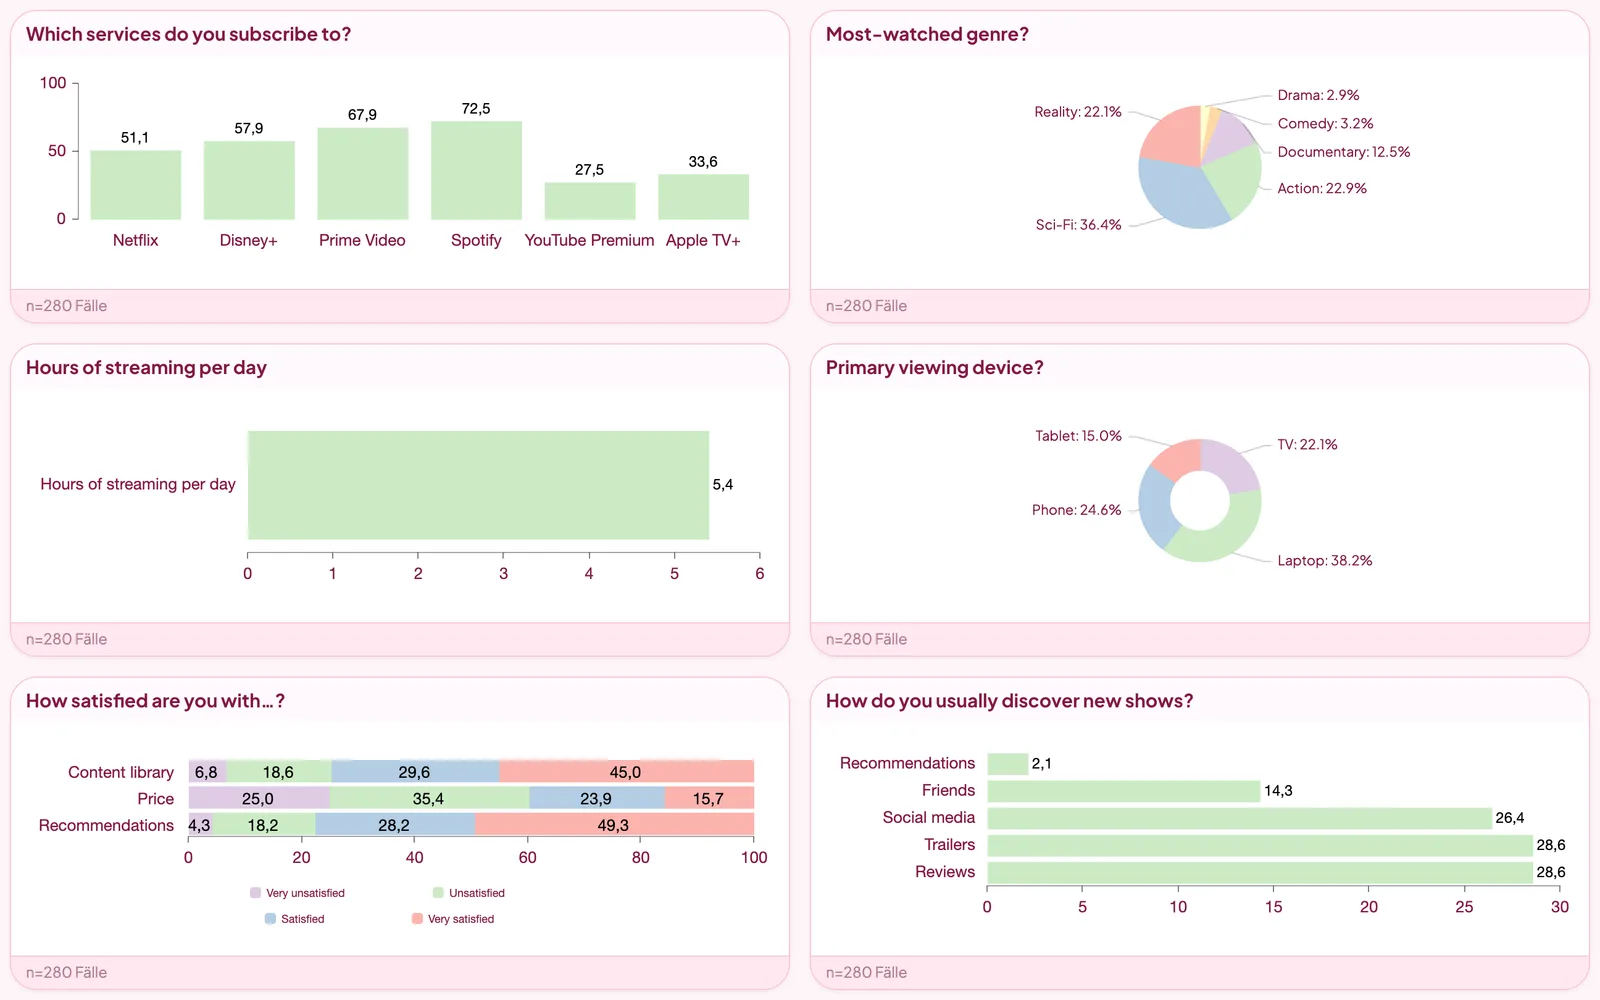
Streaming & Media
Which services people subscribe to, what they watch and where their time goes.
View study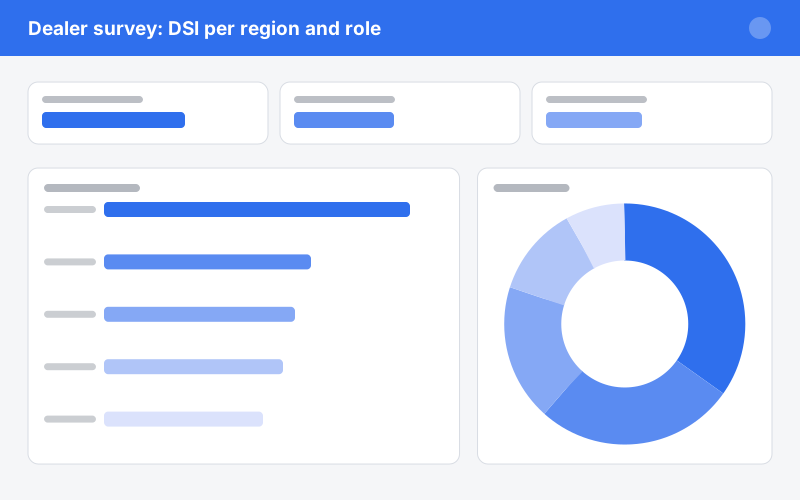
Dealer survey: DSI per region and role
The dealer survey of a fictional manufacturer: satisfaction with seven aspects of the partnership, re-signing, profitability and dealer NPS, broken down by region and role in the business.
View study
Hospital group patient survey: wards compared
The patient survey of a fictional group with three sites and four departments: satisfaction per aspect, PREM statements, patient NPS and open comments, broken down by site and department.
View study
Association business climate: situation, expectations, risks
The business climate survey of a fictional trade association in the classic three-way form of situation, expectations and orders, with investment, employment, capacity and risks, broken down by sector and company size.
View study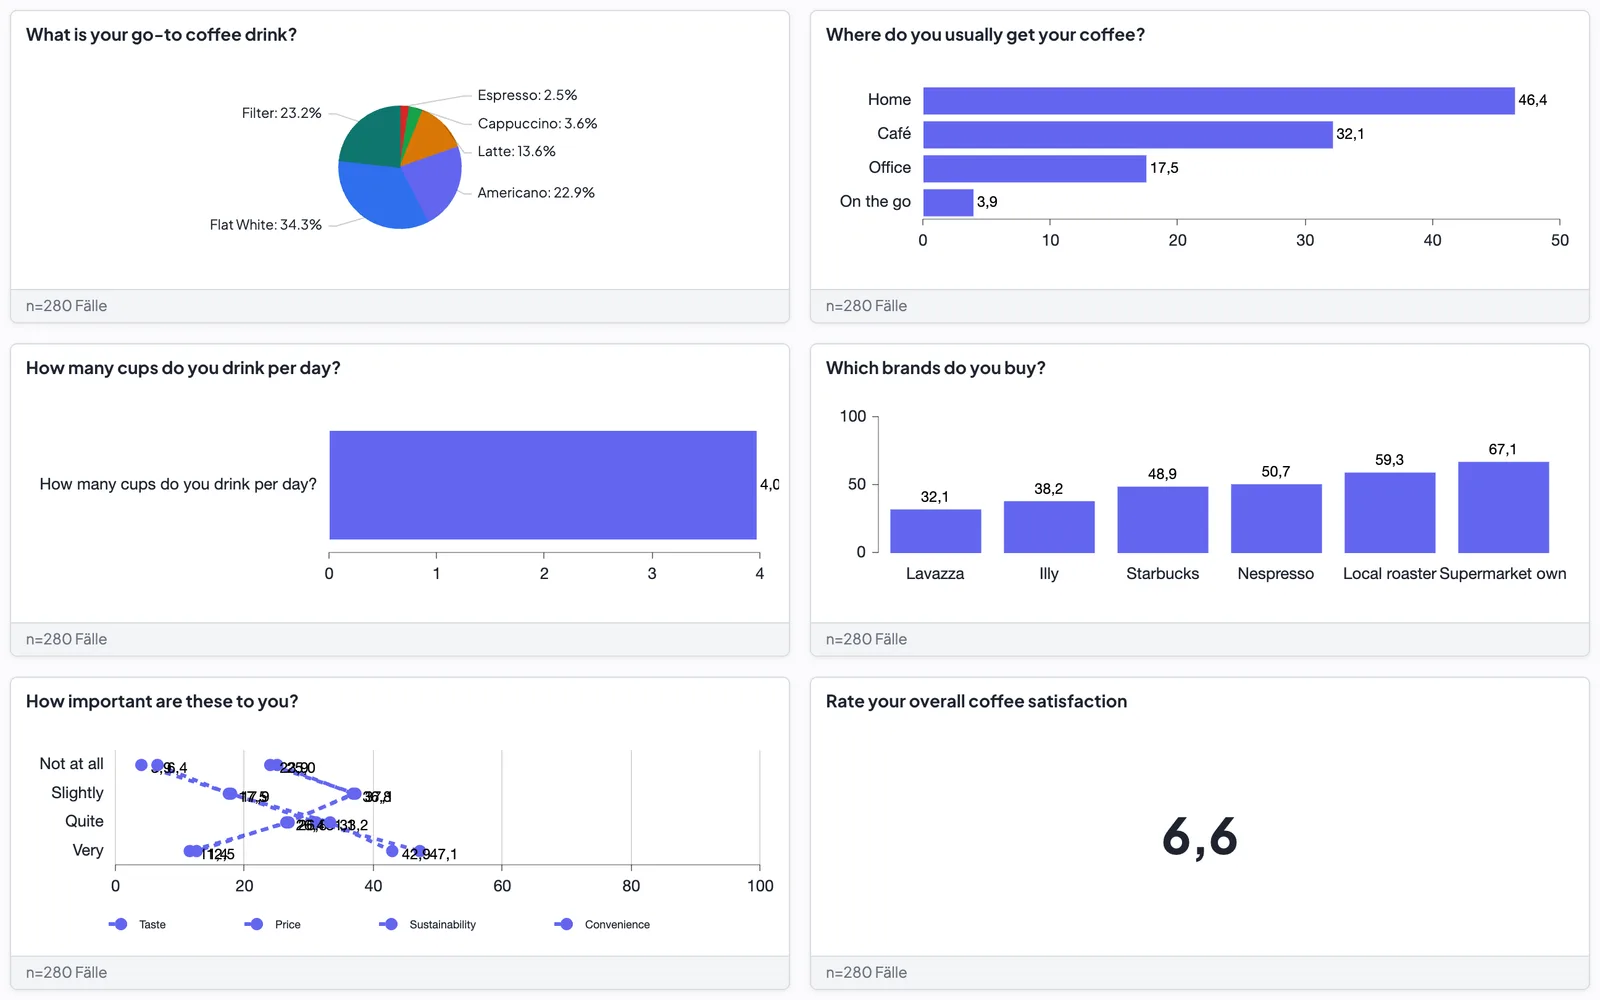
Coffee & Beverages
Daily drinking habits, favourite brands and what makes people switch.
View study
Utility customer monitor: switching and offers
The customer monitor of a fictional utility: divisions, satisfaction, switching intention, interest in heat pumps, solar and charging, NPS and image, broken down by district and age group.
View study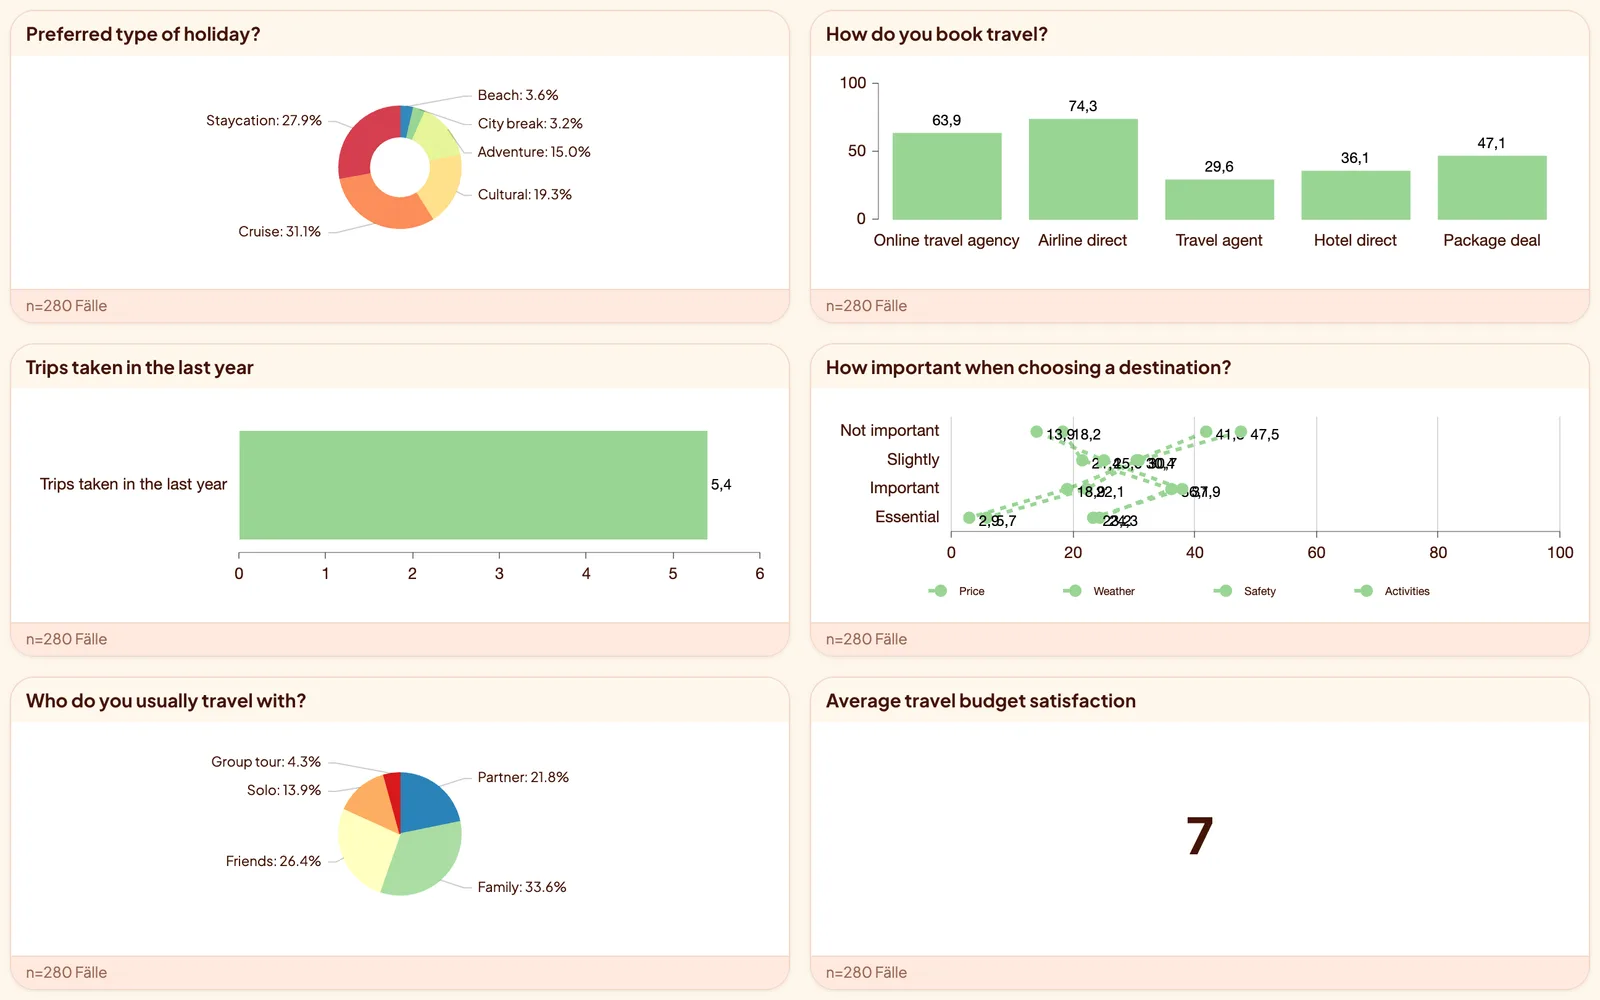
Travel & Tourism
Holiday destinations, booking channels and what travellers value most.
View study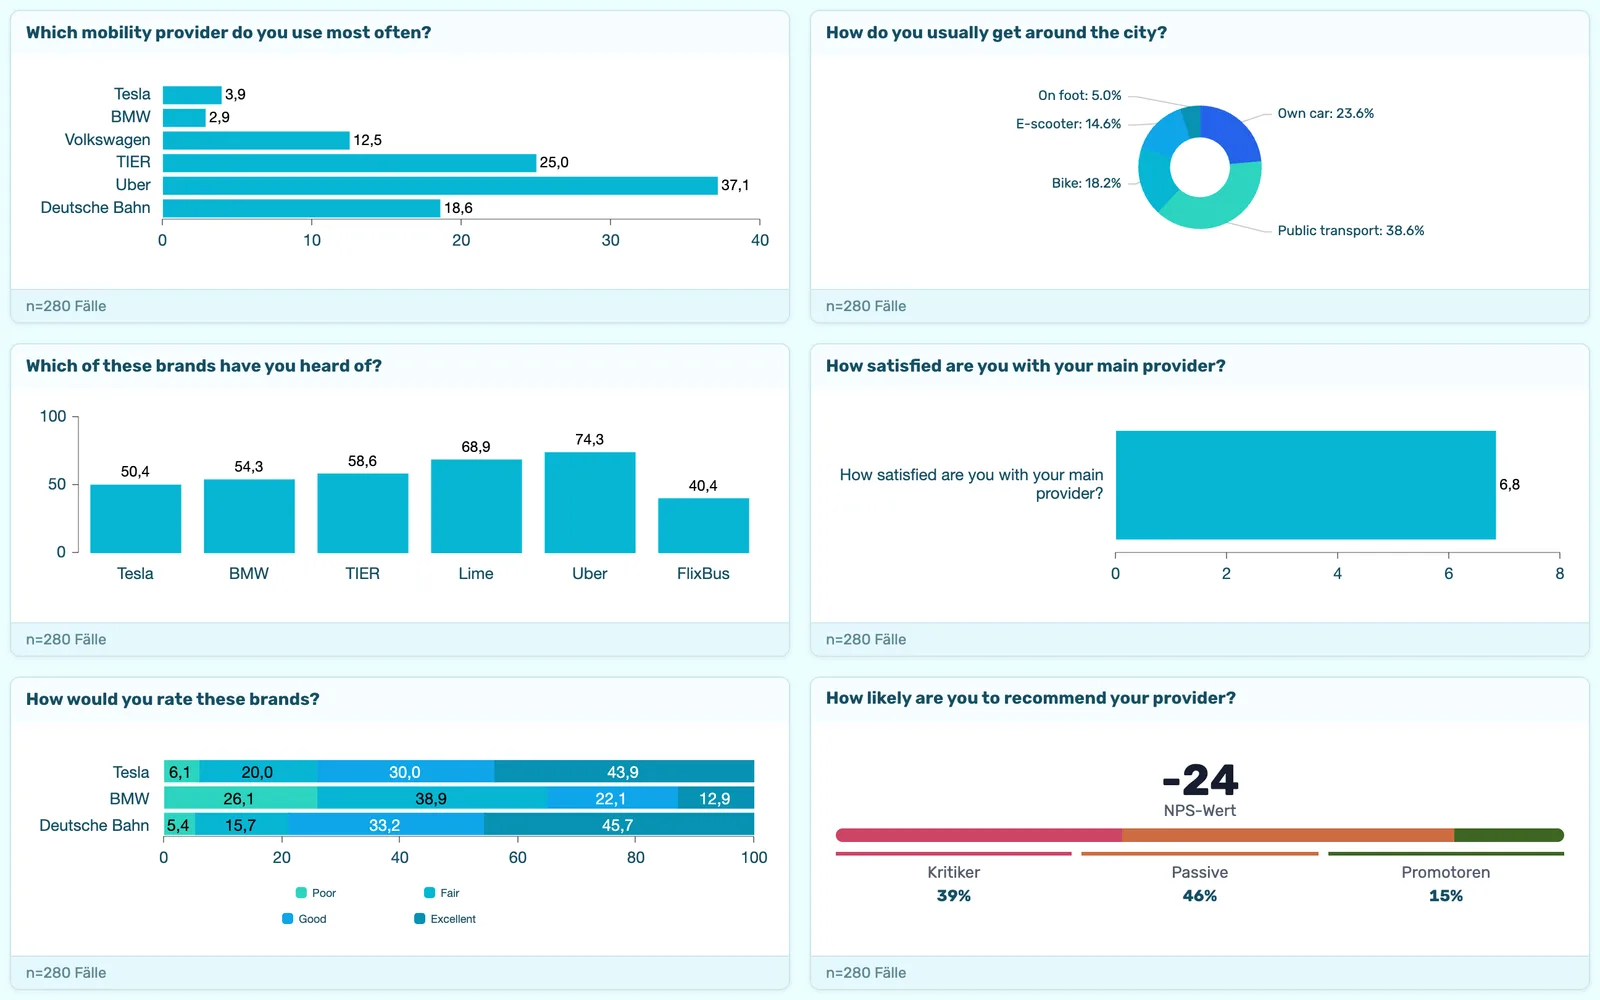
Mobility Brands
Brand awareness, usage and image across car, e-scooter and public-transport providers.
View study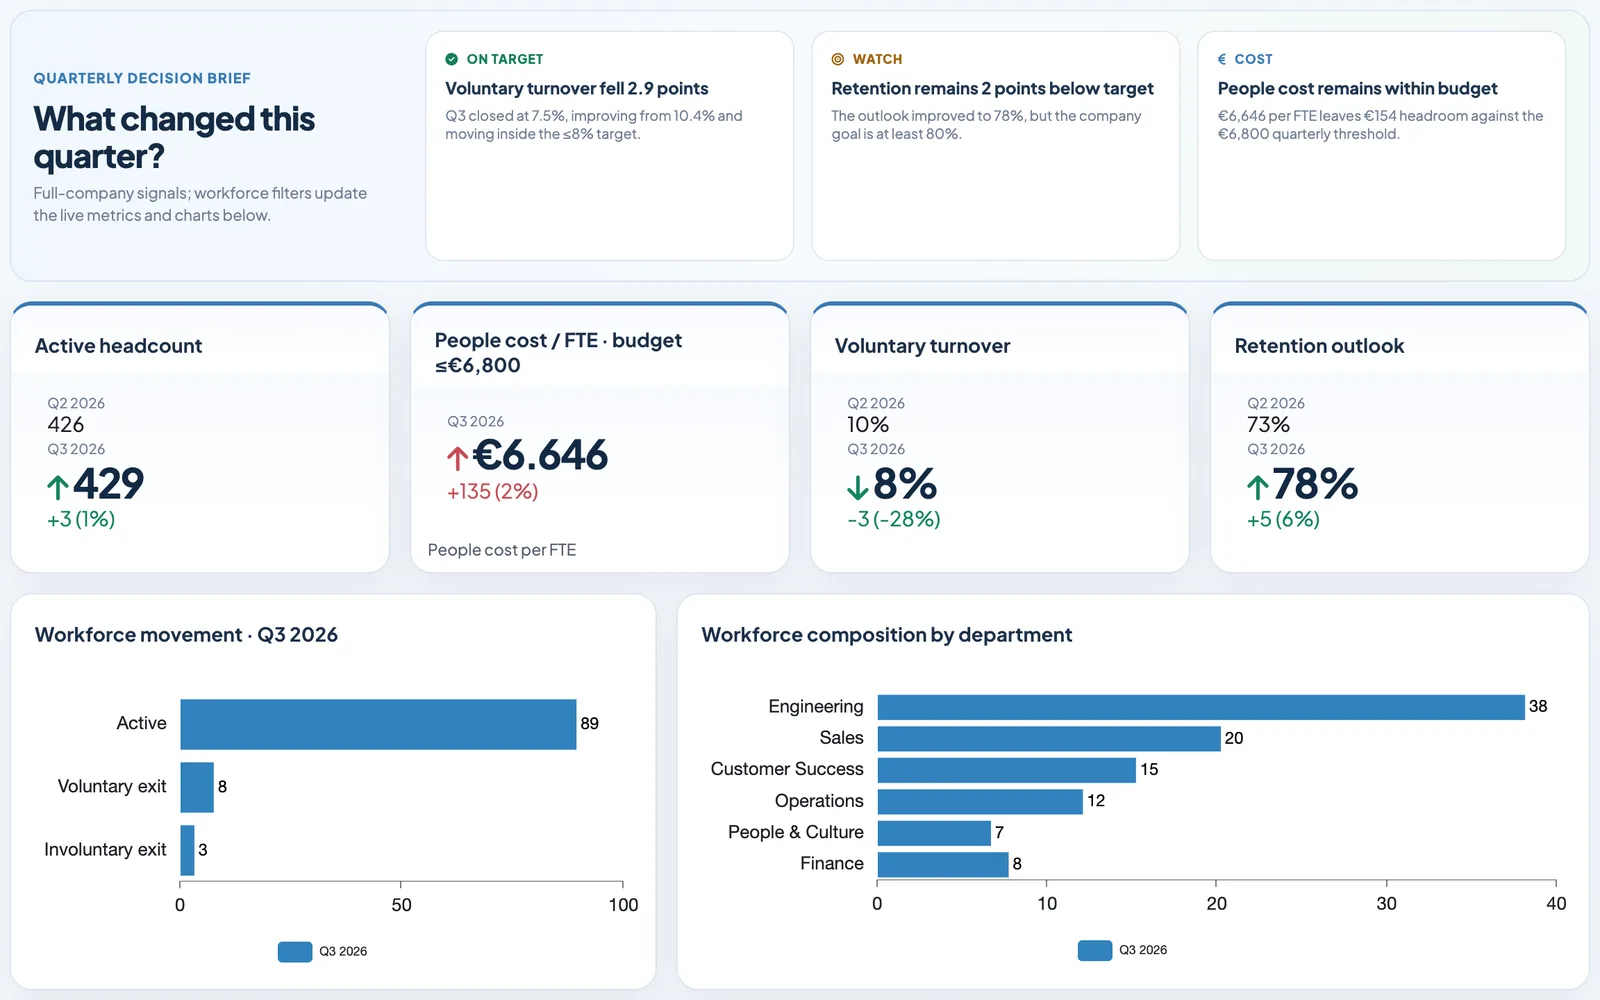
HR & People
Turnover, absence and recruiting metrics alongside retention intent, workload and eNPS for a fictional company.
View study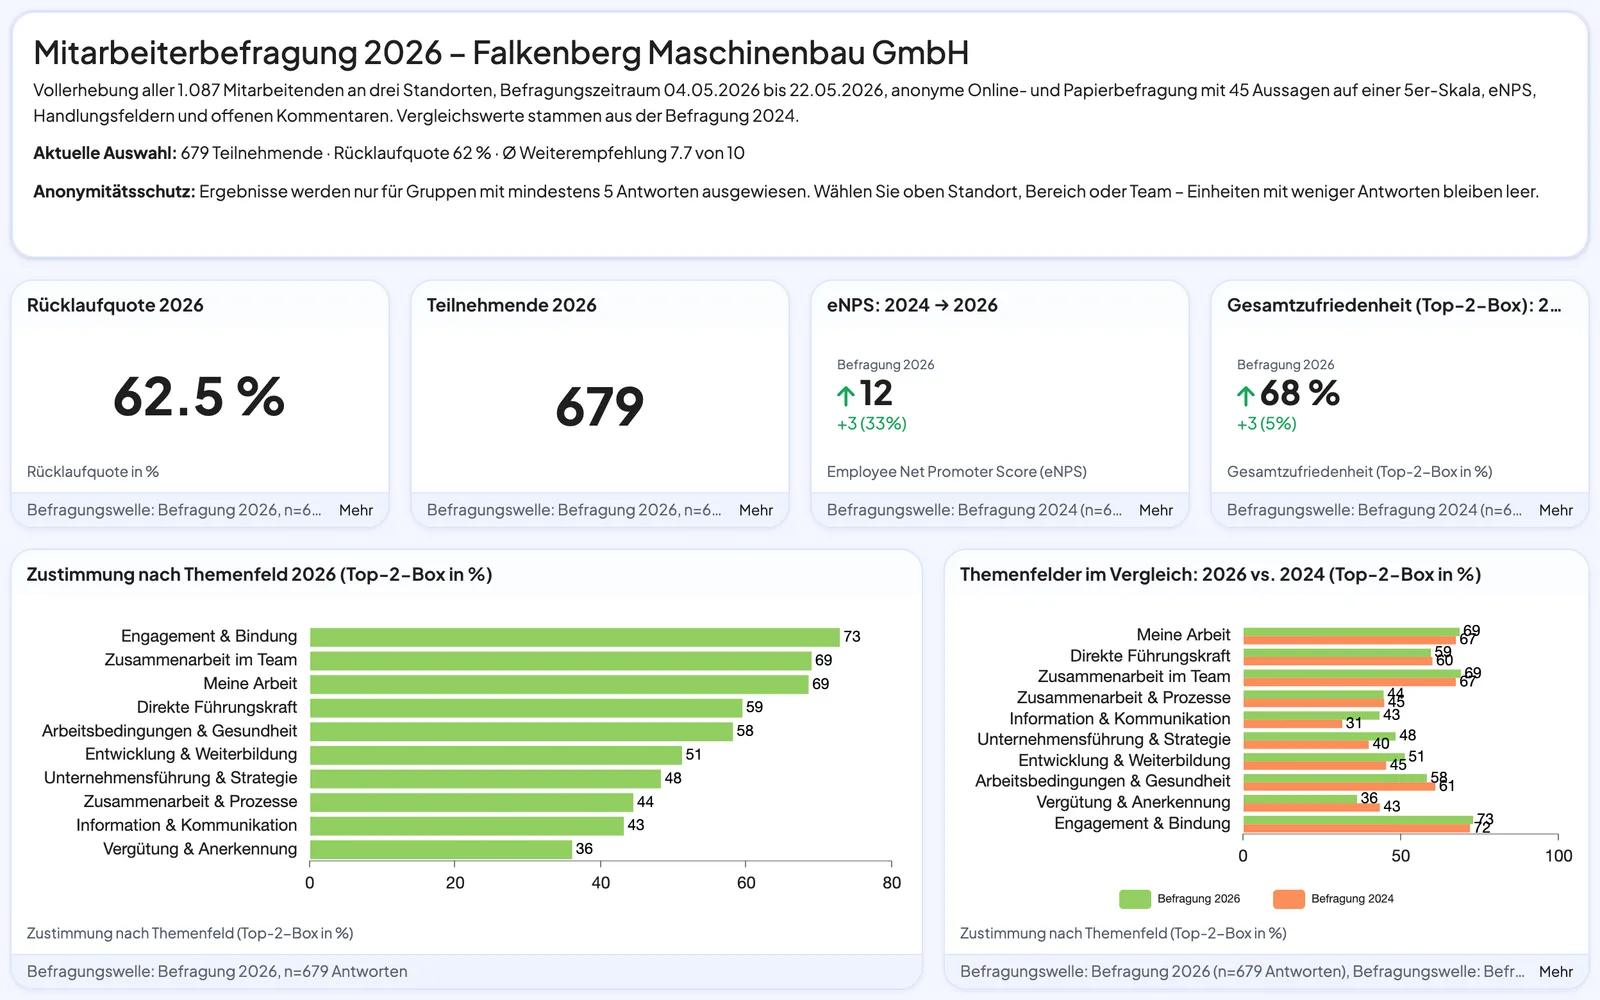
Employee Survey
A classic German employee survey of a machine builder: agreement by topic, eNPS, trend against the previous wave and organisational comparisons – groups below 5 answers stay anonymous.
View study
Product feedback board: CES, PMF and NPS per plan
The feedback board of a fictional SaaS product: effort score, product-market-fit question, SUS statements, features used, NPS and open wishes, broken down by plan and role.
View study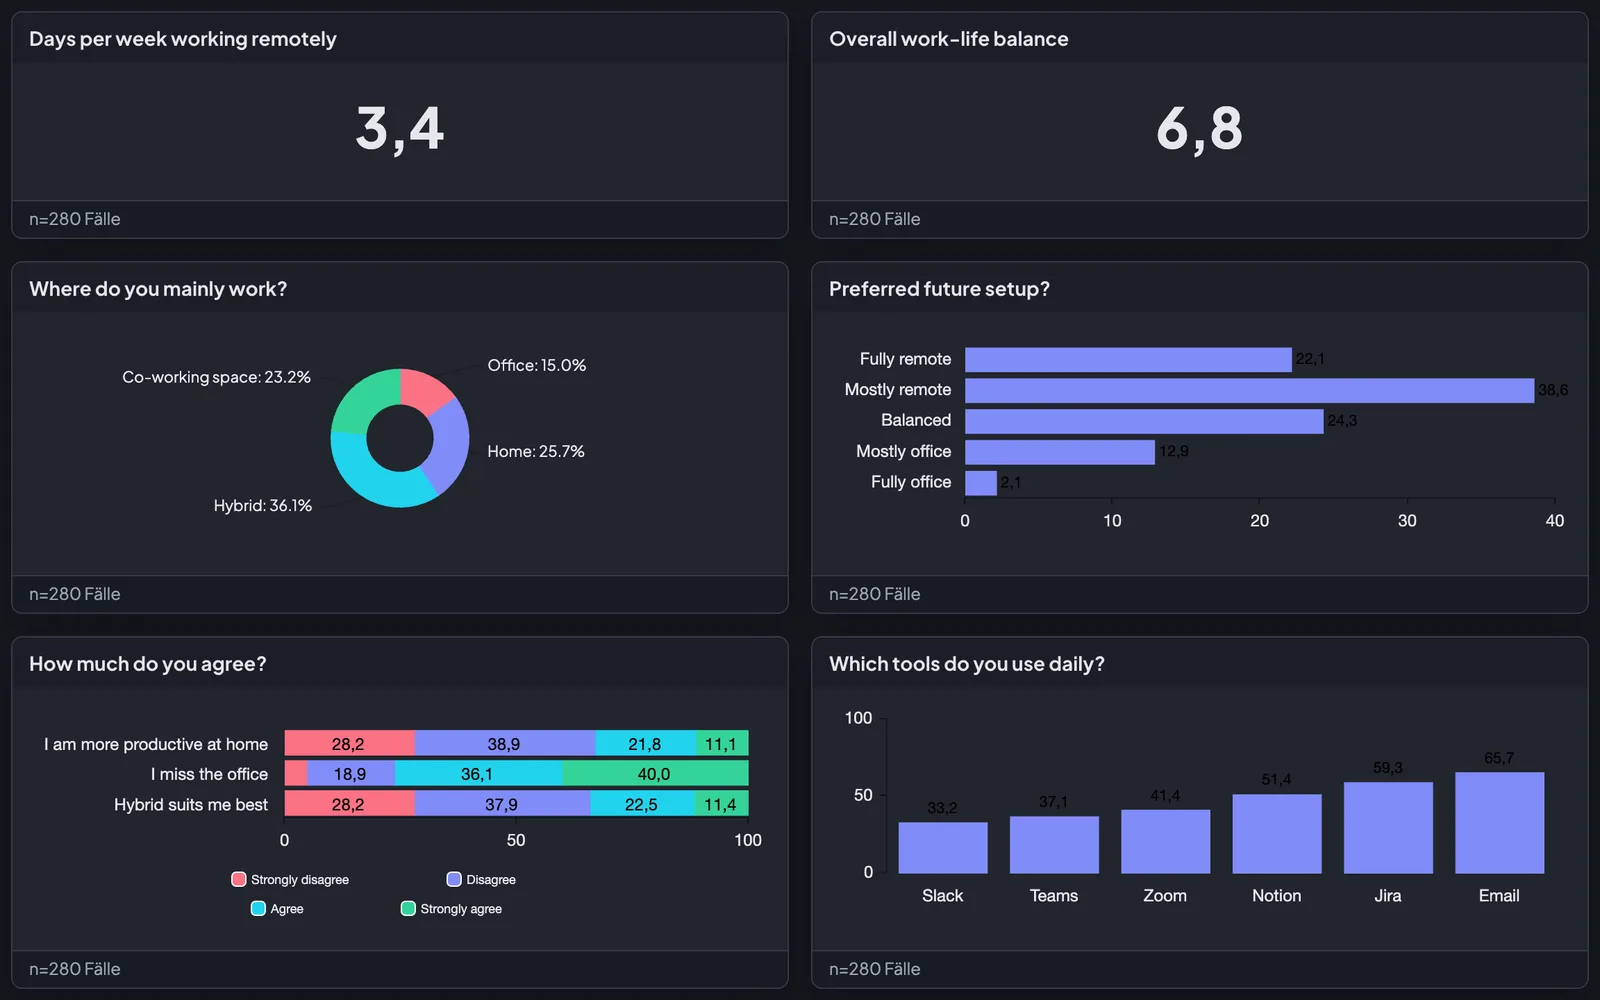
Remote Work Pulse
How teams feel about hybrid work, productivity and the return to the office.
View studyNo study matches this combination. Pick a different data type or topic.