Survey software
Build surveys — and analyze them with no recoding
Build professional questionnaires with 20+ question types, from single choice to Likert matrix. Publishing automatically creates the dataset, codebook and a live dashboard. Collection, prep and analysis run in one platform, with no recodes.
DataLion survey software combines questionnaire and analysis in one platform. On publish, answers become SPSS-style variables with value labels. A single-choice question becomes one column, each multiple-choice option becomes a 0/1 column and each matrix/Likert row becomes its own column. You then weight, clean and analyze the data directly, with no recoding.
- 🇩🇪 Made in Munich
- GDPR-compliant
- DPA included
- Hosted in Germany
- 🌐 Interface in EN, DE, FR & NL
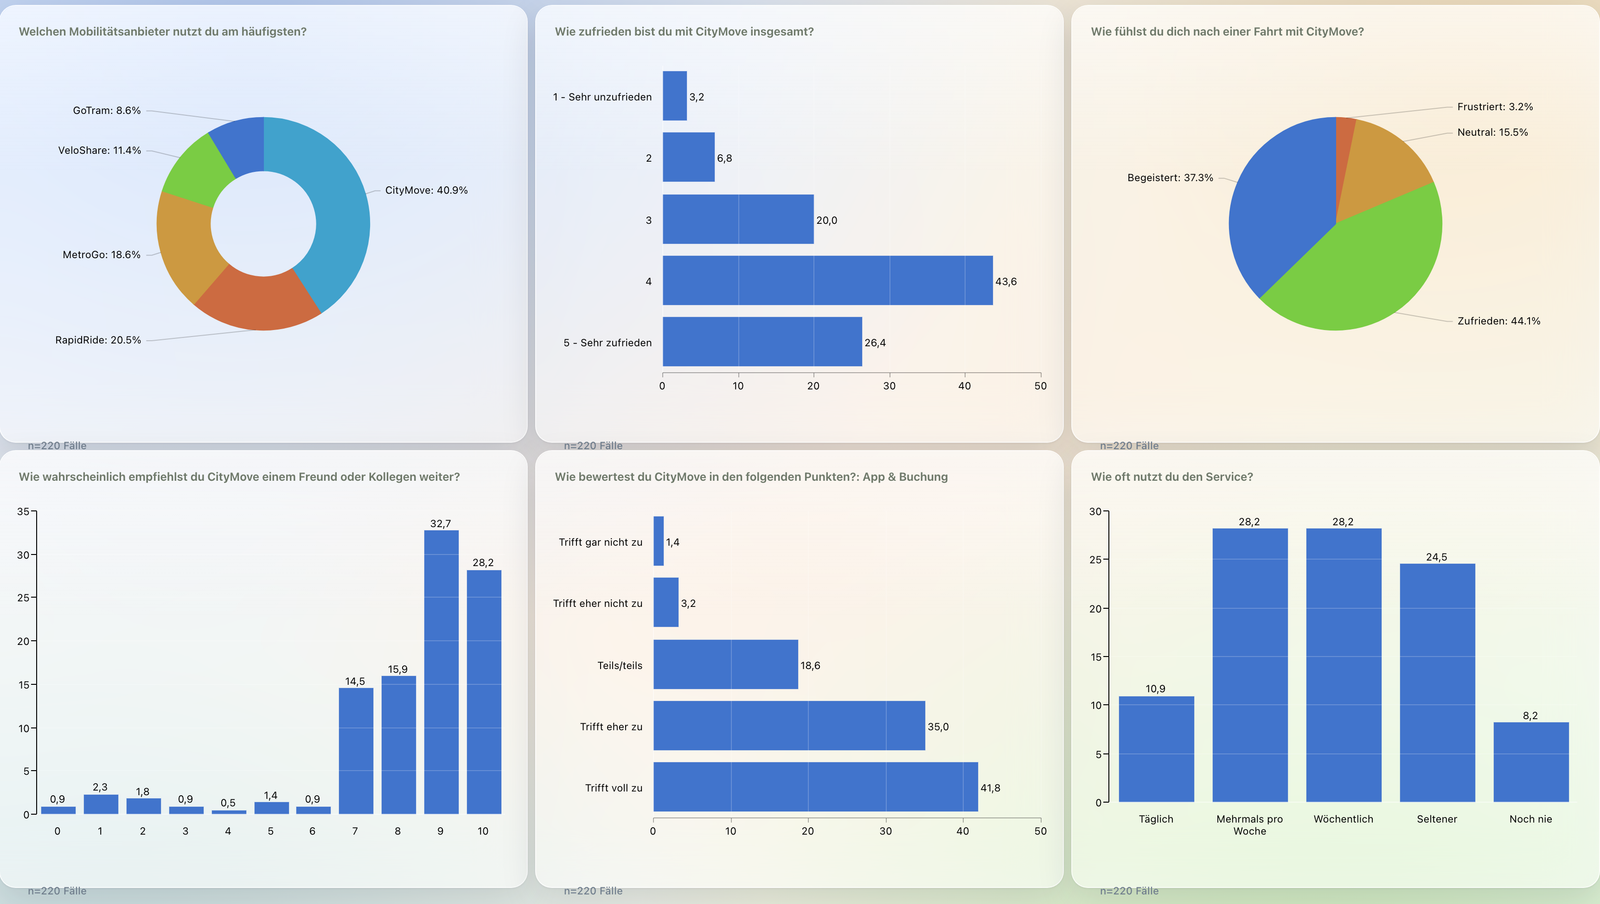
From answer straight to chart
When you publish a survey, DataLion creates a project with a response dataset and a complete codebook. Questions become SPSS-style variables including value labels at publish time.
Multiple choice expands into 0/1 columns per option and a Likert matrix into one column per row with the correct scale values. Crosstabs, weighting and visualization work without prior recoding.
- One categorical column per single-choice question
- One 0/1 column per multiple-choice option — no manual splitting
- One column per matrix/Likert row with scale value labels
- Variable and value labels generated automatically
- Auto-created results dashboard as the project start page
From single choice to Likert matrix
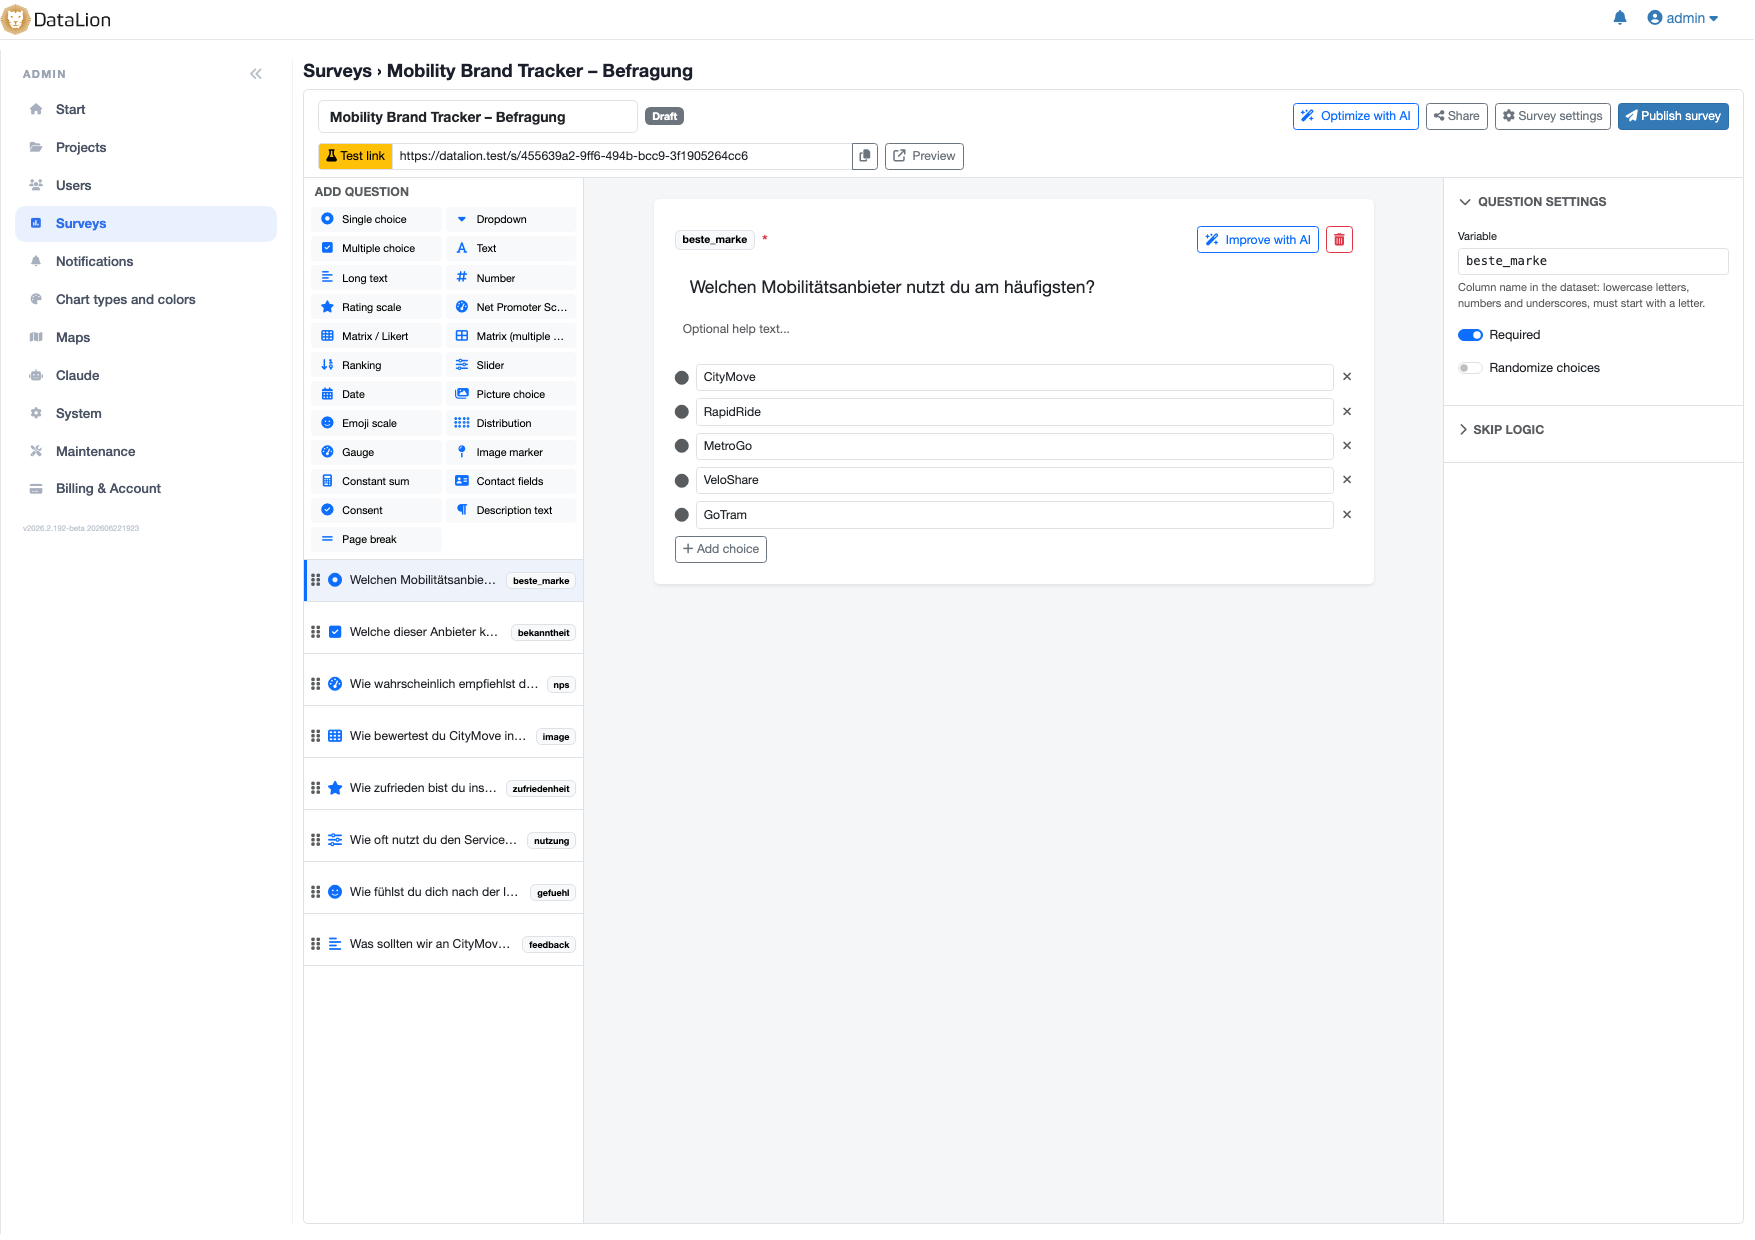
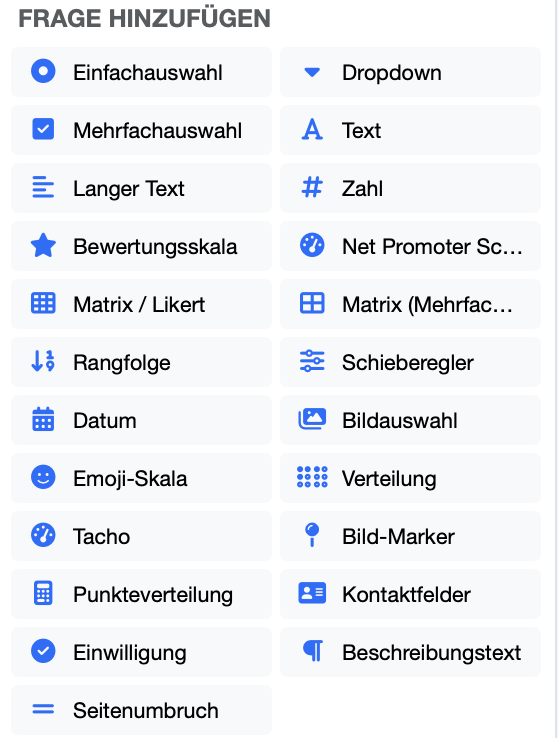
The three-pane editor offers the common question types used in professional market research. Each type has matching validation and analysis logic.
- Single choice, multiple choice, dropdown and picture choice
- Likert matrix (single- and multi-select) for scale batteries
- Rating scale, NPS, slider and constant sum
- Ranking, date, number, emoji scale
- Open text, contact fields and consent
Skip logic, screen-out & display conditions
Control the flow with answer-based skip logic. Depending on the selected answer, it jumps to a follow-up question, the end or a screen-out with custom end text. Display logic shows questions based on earlier answers and supports AND/OR conditions.
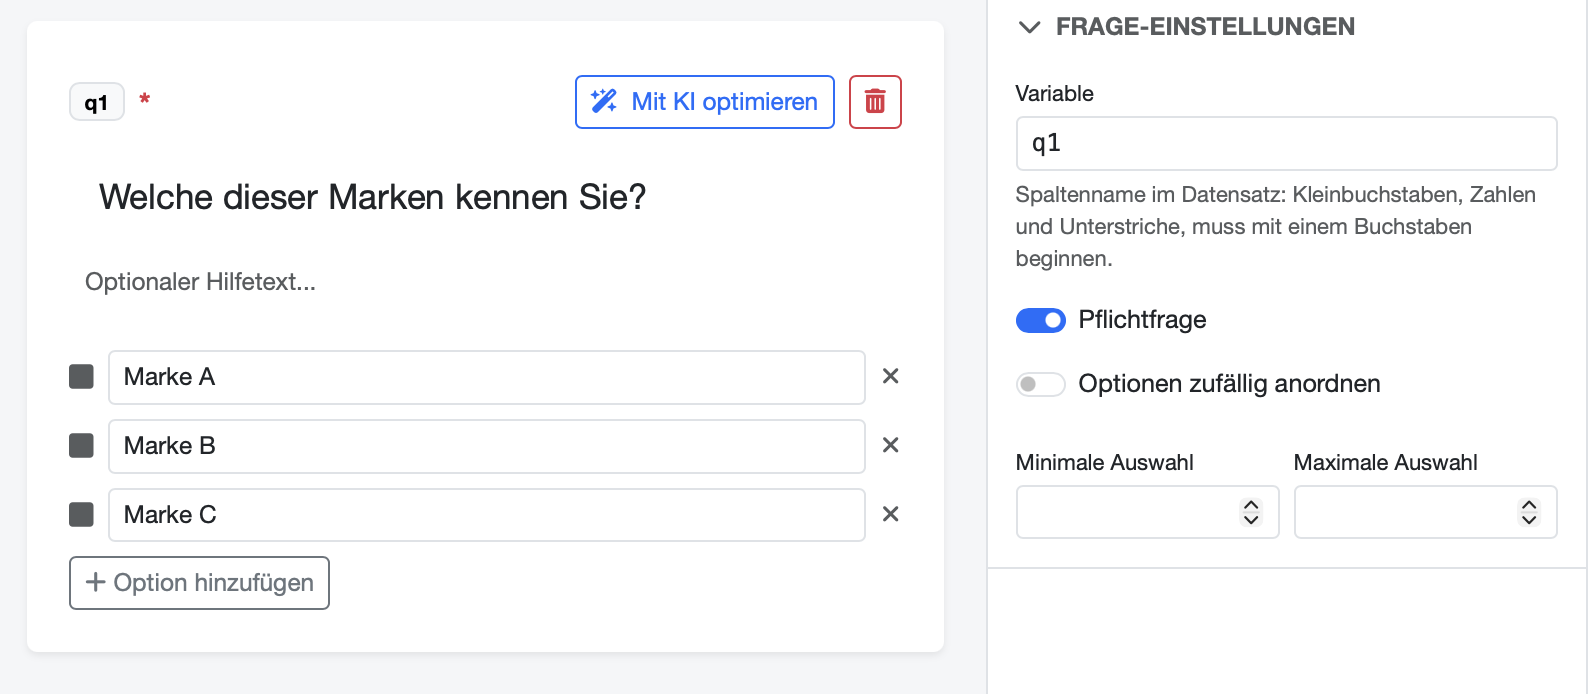
Answer randomization, page breaks, response limits and automatic close dates are enforced server-side.
- Answer-based skip logic incl. screen-out with custom text
- Display logic (show-if) with AND/OR conditions
- Randomization of answer options
- Response limits and automatic close dates
- Editable variable codes — e.g. gender or nps_score
Weight, clean, recode — without exporting
Need to adjust the raw data? In DataLion you weight samples, clean missing values, recode and reshape between long and wide format — directly on the dataset, with no detour through SPSS or Excel.
Everything on weighting, cleaning and recodes on the Data preparation page.
20+ statistical procedures — on an R engine
From significance tests to regressions, ANOVA and MaxDiff: DataLion's statistics engine runs on R and reports significance at confidence levels from 80% to 99% directly in tables and charts.
More on tests, crosstabs and timelines on the Analysis & statistics page.
Create and optimize surveys with AI
“Create survey with AI” generates a questionnaire from a topic description, including the title, welcome and thank-you texts, typed questions, scales and pages.
“Optimize with AI” revises wording, answer options and structure of a draft while preserving your variable codes. Learn more on our AI-powered market research page.
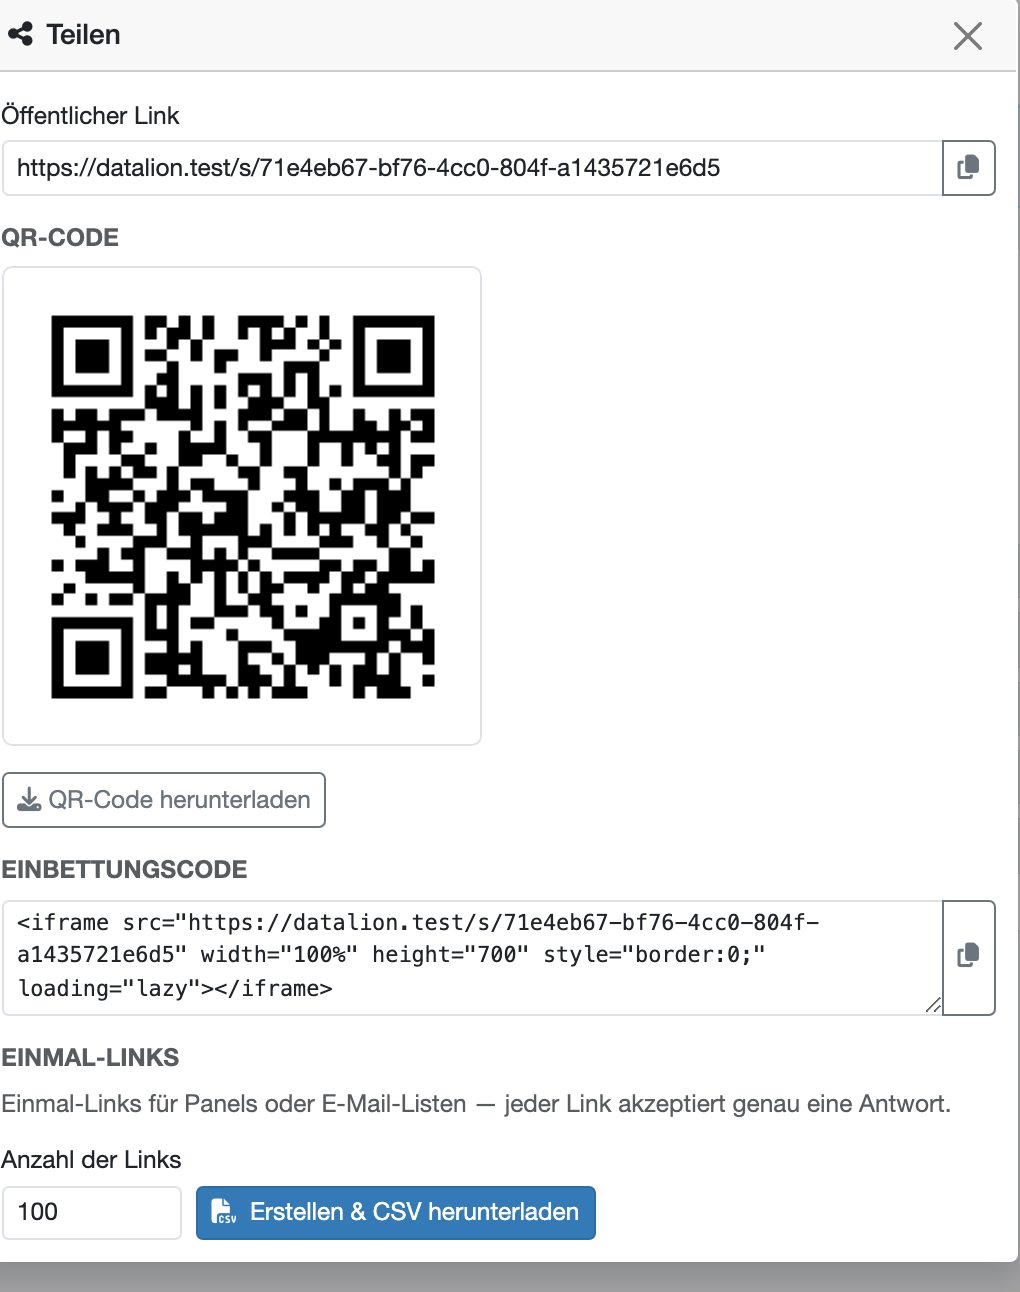
Share, embed and style
Publish via a public link, QR code or iframe embed. For panels and mailing lists, generate one-time invite links as a CSV. Each link accepts exactly one response. URL parameters such as source or panel are captured directly as variables.
The mobile-first survey runner offers animated transitions and auto-advance. Use 17 design templates and a builder for accent, background, card and text colors to match the survey to your brand. DataLion branding can be hidden.
- Public link, QR code and iframe embed
- One-time invite links (CSV) for panels & mailing lists
- URL-parameter capture into dataset variables
- 17 design templates plus a custom design builder
- Whitelabel: remove DataLion branding per survey
Further along the workflow
Common questions about the survey software
Which question types does DataLion survey software support?
Do I have to recode survey data before analysis?
How are multiple-choice and Likert questions analyzed?
Which survey tool has built-in analysis and dashboards?
Which survey software works with SPSS?
Can I export survey results to PowerPoint and Excel?
Is there a GDPR-compliant survey tool hosted in Europe?
Can I import existing data from Qualtrics, LamaPoll or SPSS?
What is the difference to SurveyMonkey?
What is the difference to LamaPoll?
What is the difference to Qualtrics?
Can I create surveys with AI?
Build your first survey — and analyze it instantly
Try DataLion free: build a questionnaire, publish it and watch the results dashboard go live — including weighting and statistics, with no recoding. Or book a personal demo.