Data import
Multiple data sources in one project
Combine multiple data sources in one project — for example survey and sales data, or several tracker waves as separate tables. With filter variables across all sources, a single dashboard filter applies everywhere.
A DataLion project combines multiple data sources at once — for example survey and sales data, or several tracker waves as separate tables. You define filter variables that exist across all sources, so a single dashboard filter applies everywhere. Sources are linked via key variables.
- 🇩🇪 Made in Munich
- GDPR-compliant
- DPA included
- Hosted in Germany
- 🌐 Interface in EN, DE, FR & NL
Trusted by research, insights & media teams
- 50+ interactive chart types
- 20+ statistical methods
- SPSS · Excel · CSV import without data loss
- ISO 27001 certified data centers (Germany)
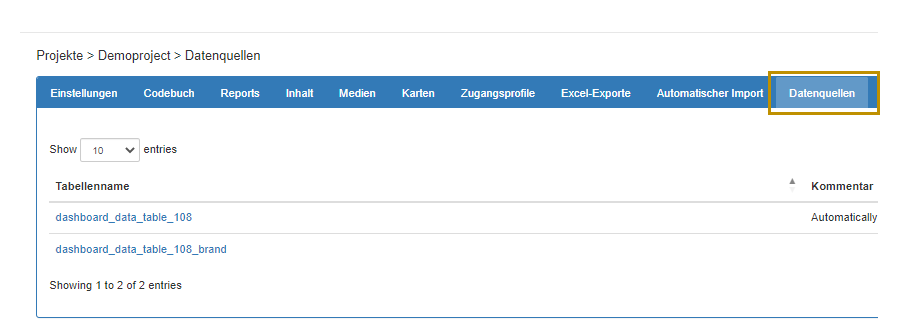
Several sources, one project
A DataLion project doesn't have to be a single table. You combine multiple data sources at once — for example survey data together with sales data, or several tracker waves as separate tables.
Everything that belongs to a study sits together in one project — instead of scattered across separate analyses that no one ever brings back together.
- Multiple data sources and tables per project
- Survey and sales data in one analysis
- Several tracker waves as separate tables
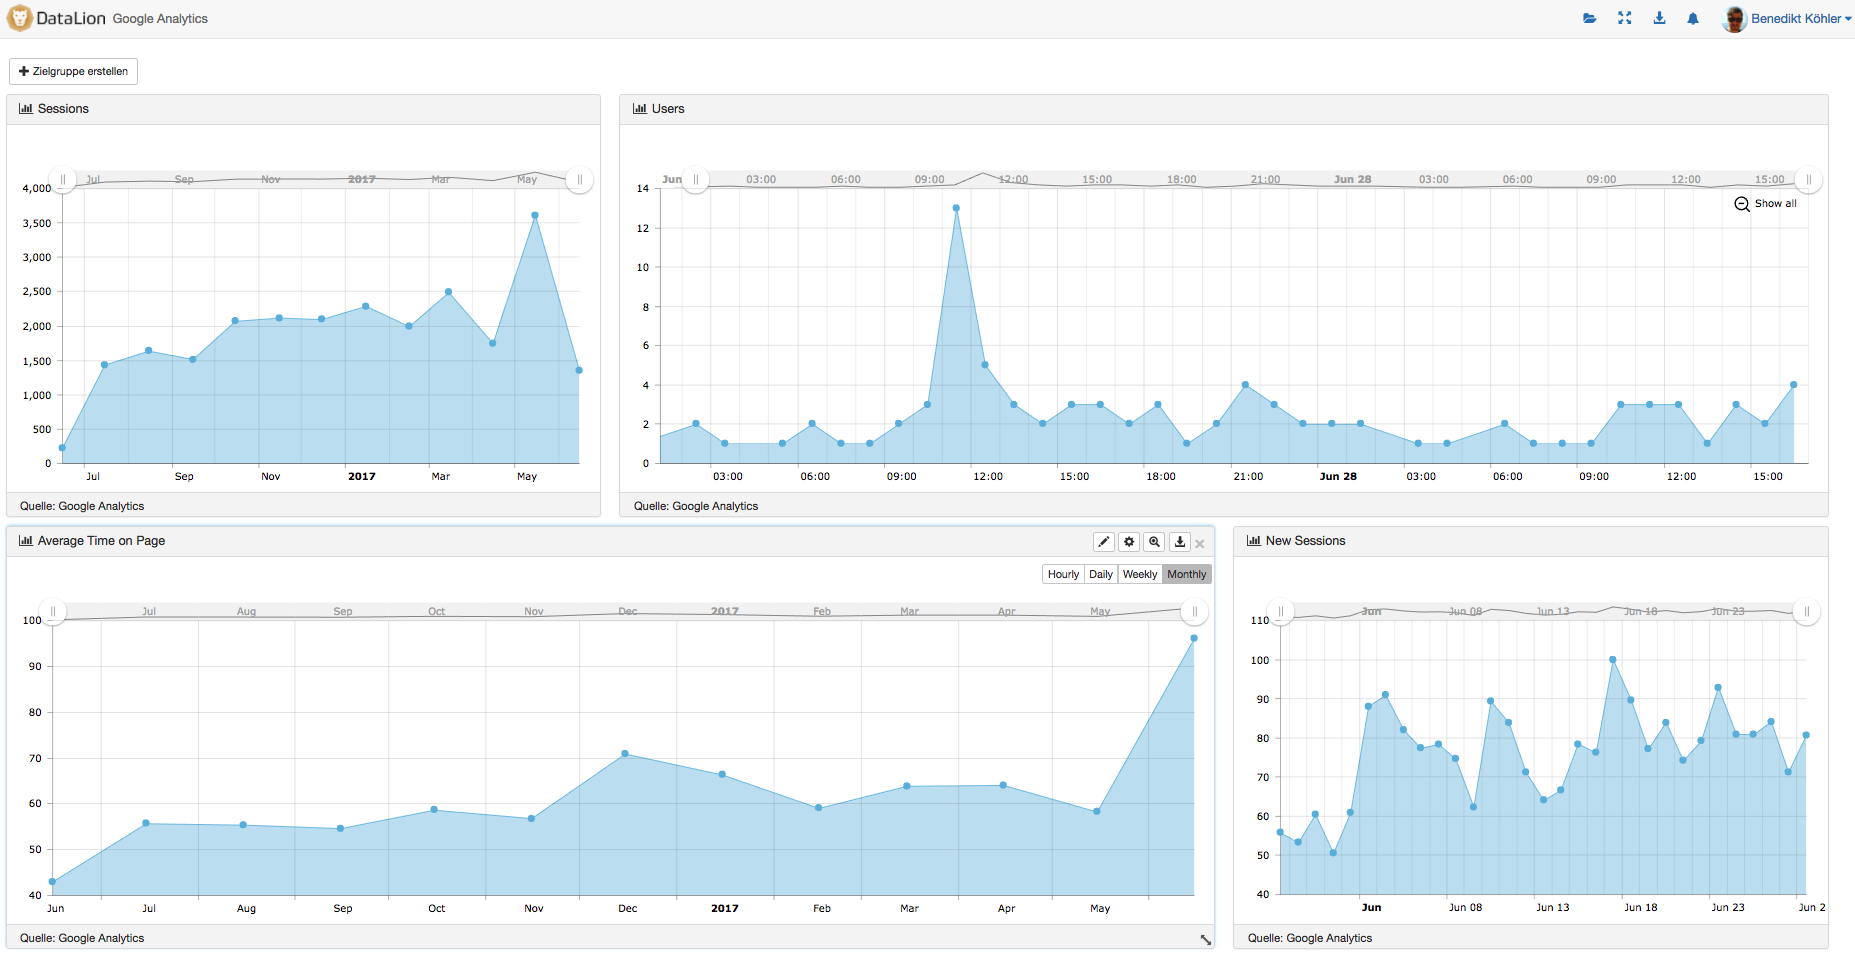
Filters that work across all sources
You define filter variables that exist across all sources. When you then set a filter on the dashboard — by country, wave or target group, say — it applies across every chart and every source.
Instead of filtering each dataset separately, you drive the whole dashboard with one click — no matter which source a chart pulls its numbers from.
- Filter variables defined across all sources
- One dashboard filter applies to every chart
- Filter across sources instead of source by source
Link sources via key variables
To make the sources fit together, they are linked via key variables — such as a shared ID, a region or a time period. That is how DataLion knows which rows belong together.
This is deliberately lightweight: the point is to combine existing sources in one project and filter across them — not to be a full ETL pipeline or a data warehouse.
See DataLion with your own data
Start a free trial or book a personal demo — from raw data to a finished dashboard.
What users say about DataLion
- via G2
Very professional company, attentive to the customer needs, provider of a great software and service.
Generoso M. · CRM Analyst, Automotive - via G2
The contacts at DataLion are very committed. If you have problems, you can count on help. DataLion reacts quickly to requests for new functions.
Robert Q. · Managing Director - via G2
User-friendliness, especially for market research topics. Structured backend with many customization options.
Verified user · Market Research - via G2
The embedding function allows us to generate insights of our data for our audience and customers by far less than half of the usual time needed before.
Verified user · Leisure, Travel & Tourism

We now work much more efficiently, giving us more time to take care of the derivations and insights from the data for the customers.
More data features
Guides in the help center
Common questions about multiple data sources
Can a DataLion project contain multiple data sources?
Does a dashboard filter work across multiple sources?
How are the sources connected to each other?
Is this an ETL pipeline or a data warehouse?
How secure is the data storage?
Combine your data sources in one project
Try DataLion free — or get a demo of how survey, sales and tracker data come together in one dashboard with a single filter.