Survey-to-dashboard
Publish — and the dashboard is there
In most tools the real work starts after fielding: export, recode, rebuild. In DataLion the dataset, codebook and live dashboard are created automatically on publish — answers become SPSS-style variables with value labels. With no recoding.
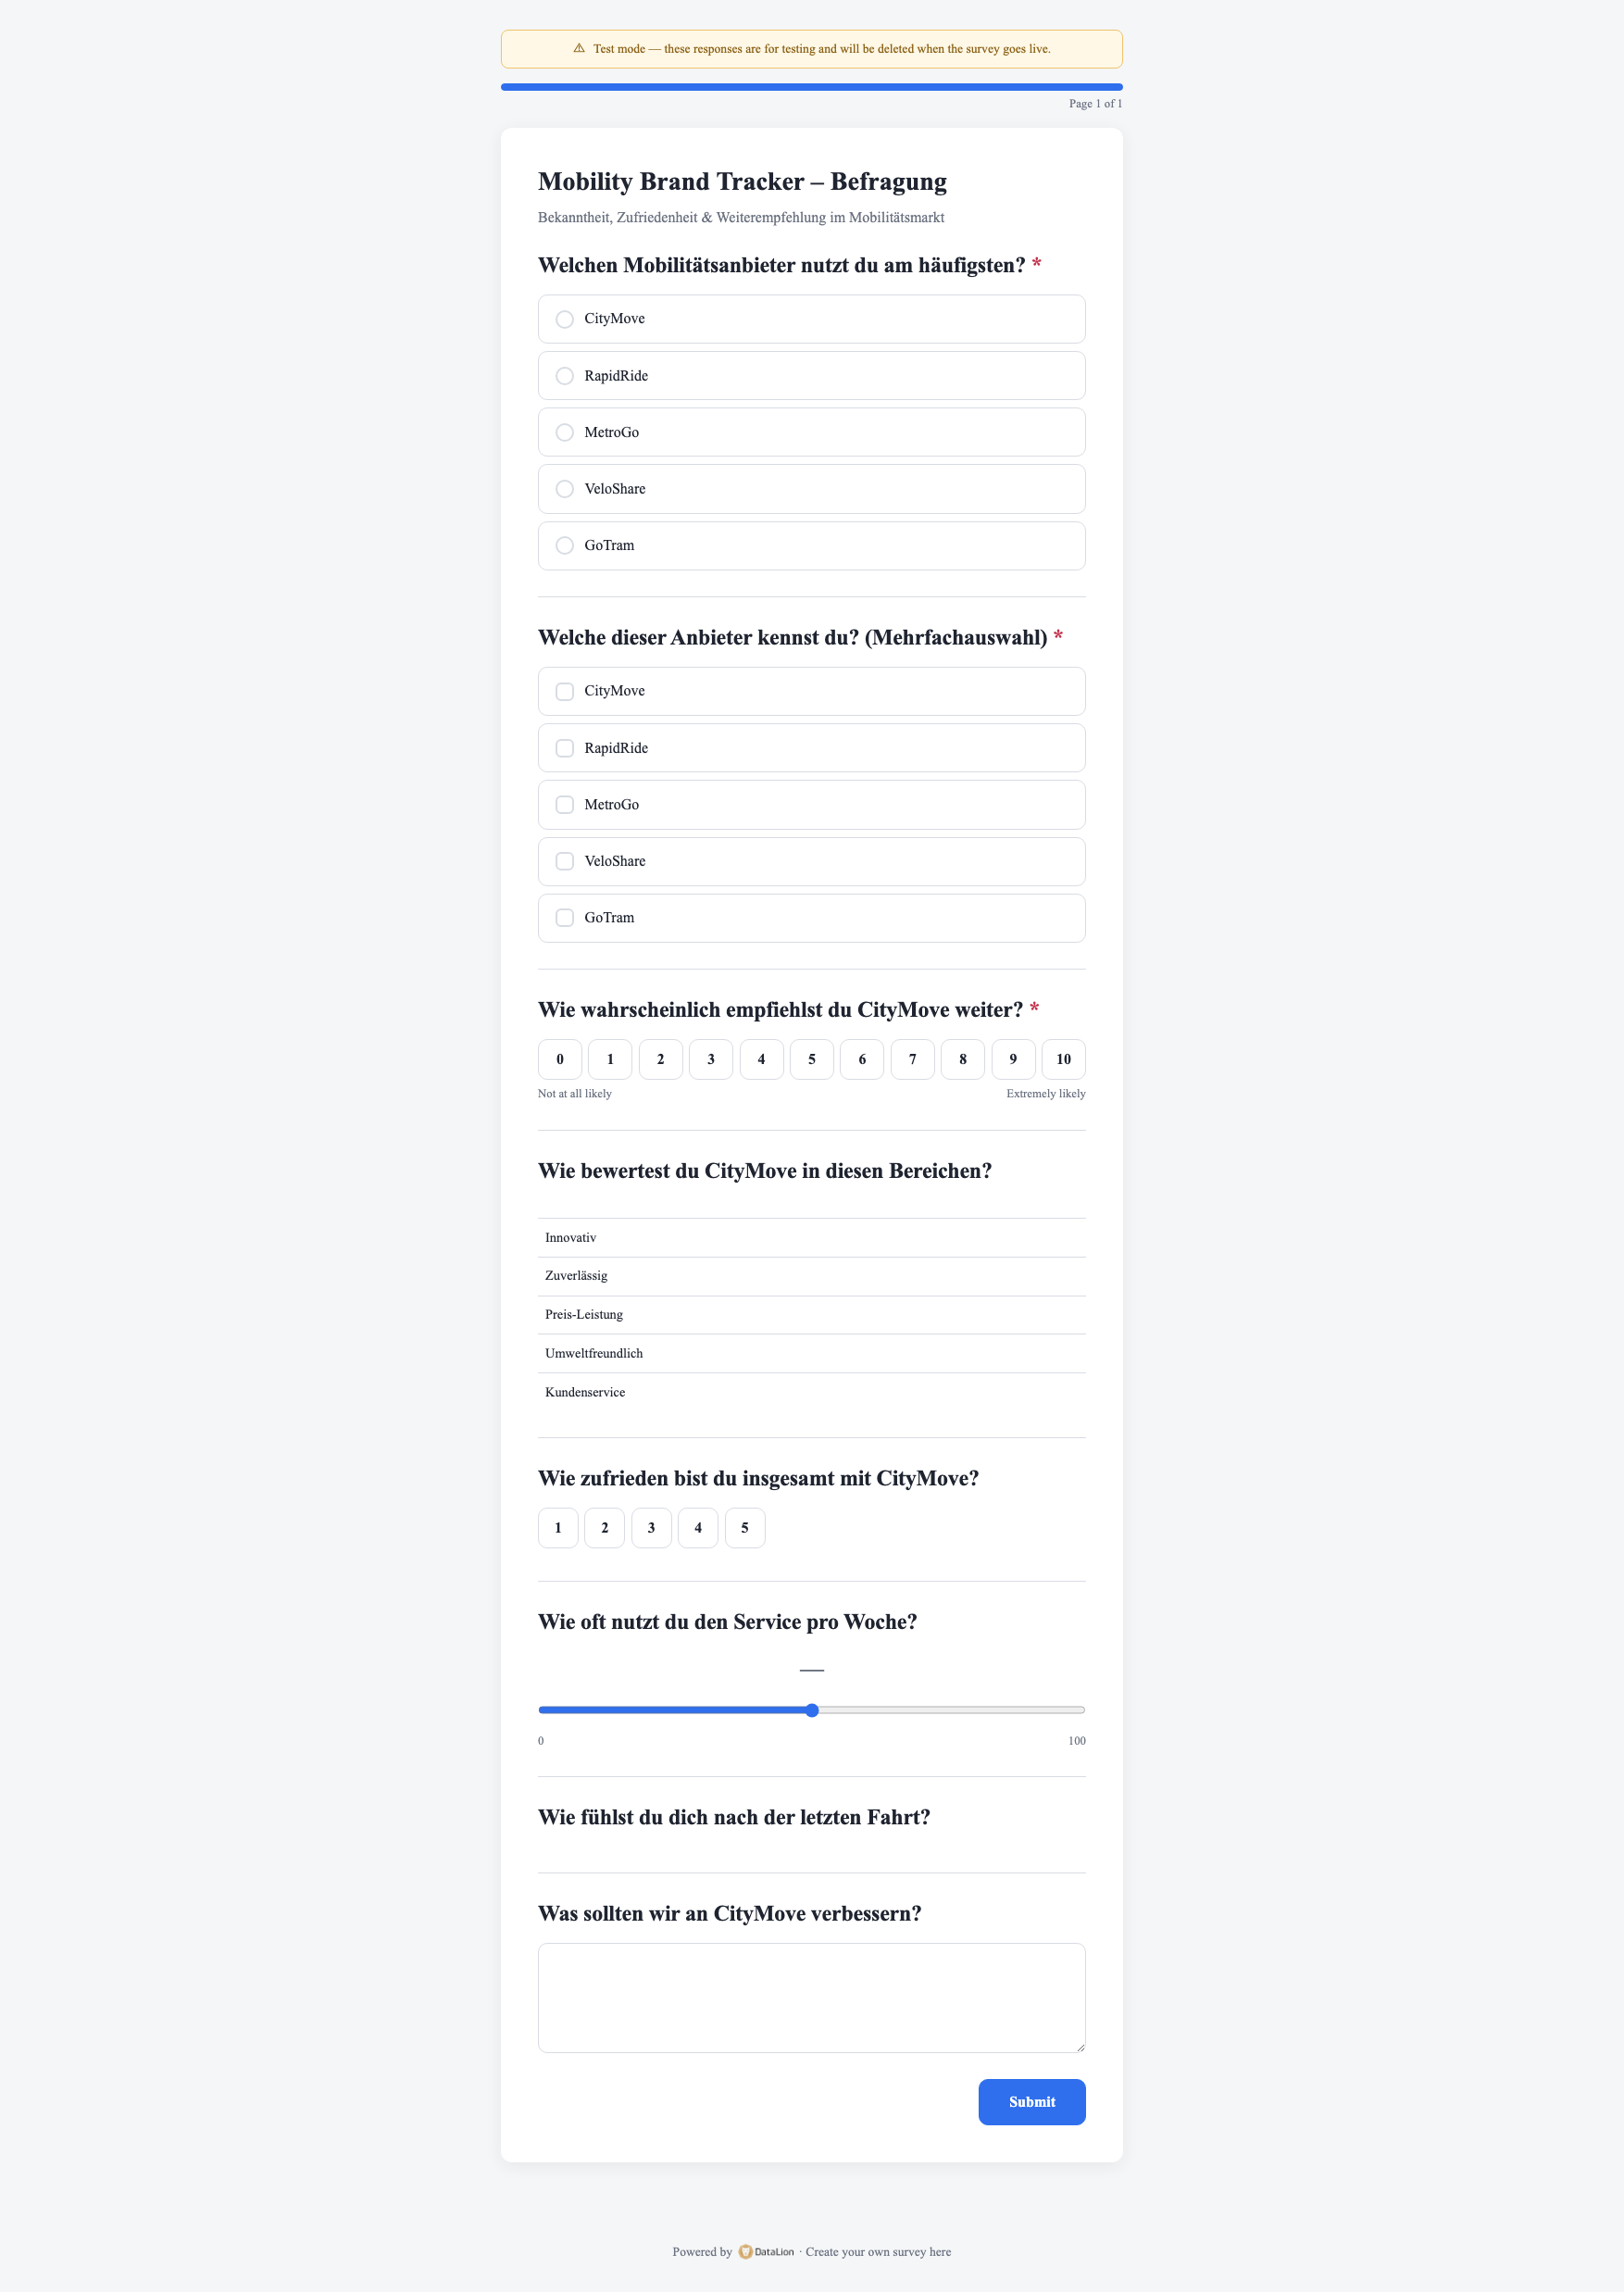
Survey-to-dashboard means: the moment you publish a survey in DataLion, it automatically creates a project, a response dataset, a complete codebook and a live dashboard. Answers become SPSS-style variables with value labels — one column per single-choice question, one 0/1 column per multiple-choice option, one column per matrix row. With no recoding.
- 🇩🇪 Made in Munich
- GDPR-compliant
- DPA included
- Hosted in Germany
- 🌐 Interface in EN, DE, FR & NL
Trusted by research, insights & media teams
- 50+ interactive chart types
- 20+ statistical methods
- SPSS · Excel · CSV import without data loss
- ISO 27001 certified data centers (Germany)
Between the last response and the first chart there are often days
- You export the raw data and rebuild the entire data structure in Excel or SPSS.
- Multiple choice has to be split into 0/1 columns by hand, Likert batteries broken out item by item.
- Variable and value labels are missing or lost — "1" never automatically becomes "Very satisfied".
- Only after all that does the first chart appear — and reporting starts from scratch again.
Project, dataset, codebook and dashboard — automatically
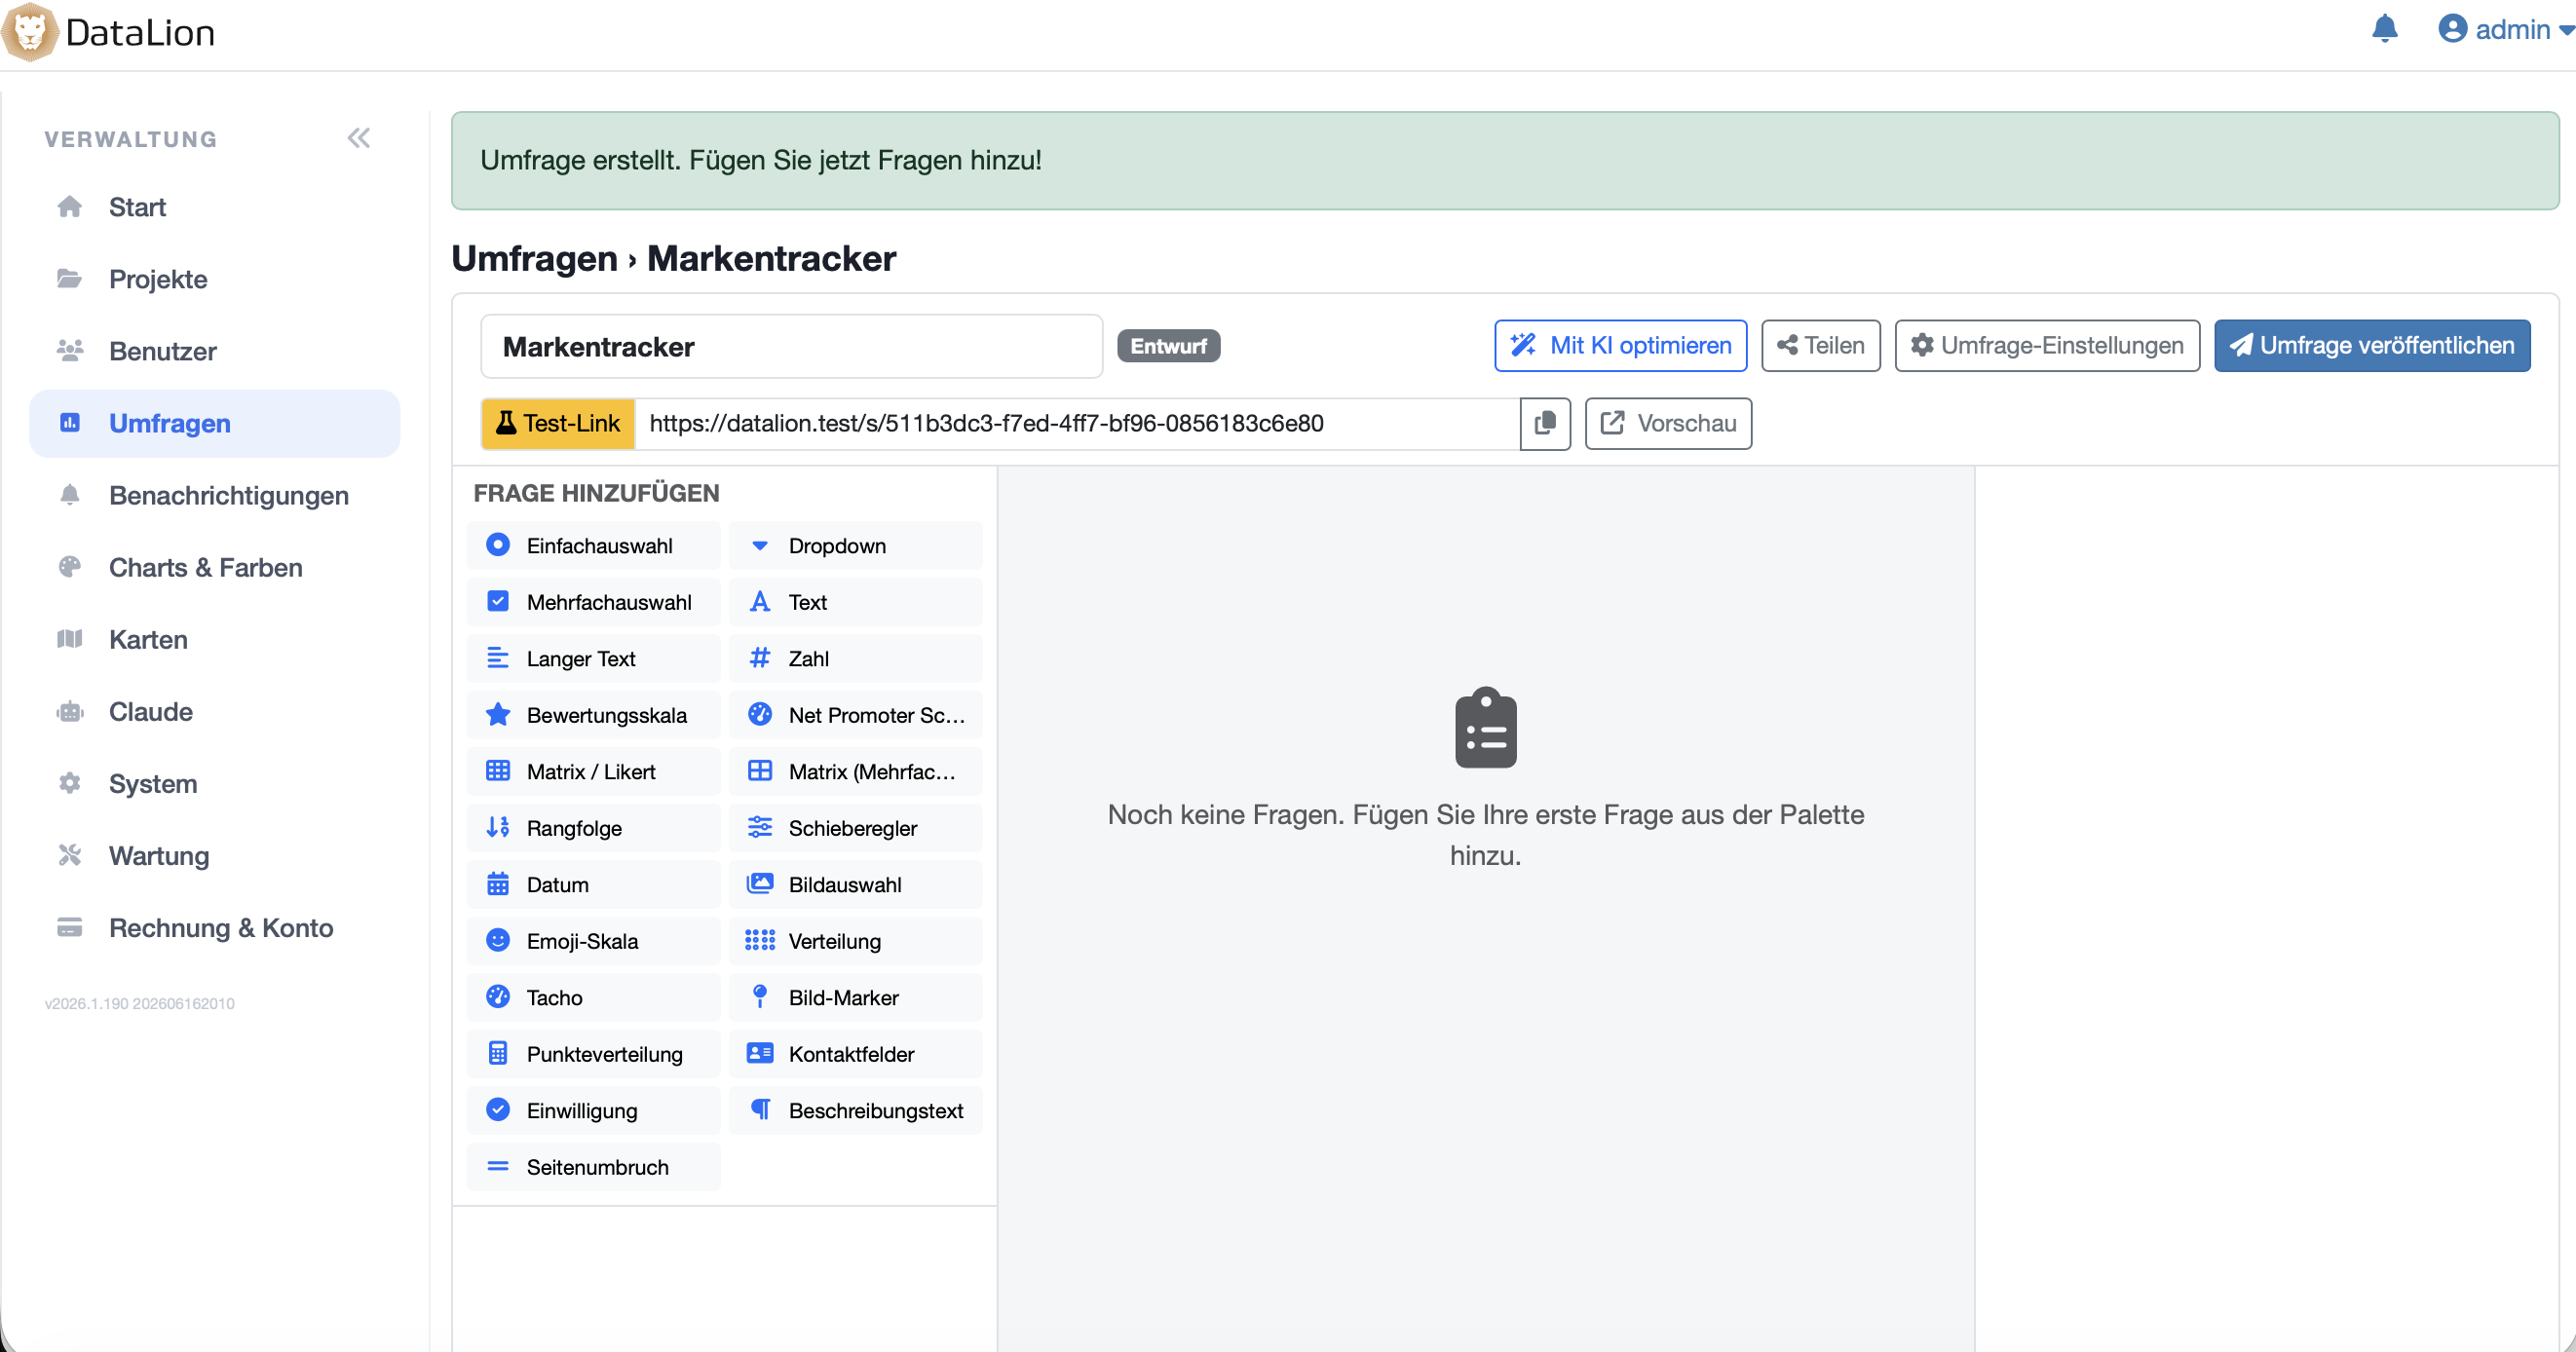
The moment you click Publish, DataLion builds the complete analysis environment in the background: a project, a response dataset, a complete codebook and a results dashboard as the project start page.
There is nothing to wire up. The first response that arrives lands in a dataset that is already ready for crosstabs, weighting and 50+ chart types.
- Project with response dataset created on publish
- Complete codebook with variable and value labels
- Results dashboard as the project start page
- No manual configuration, no separate analysis tool
Answers become SPSS-style variables — with value labels
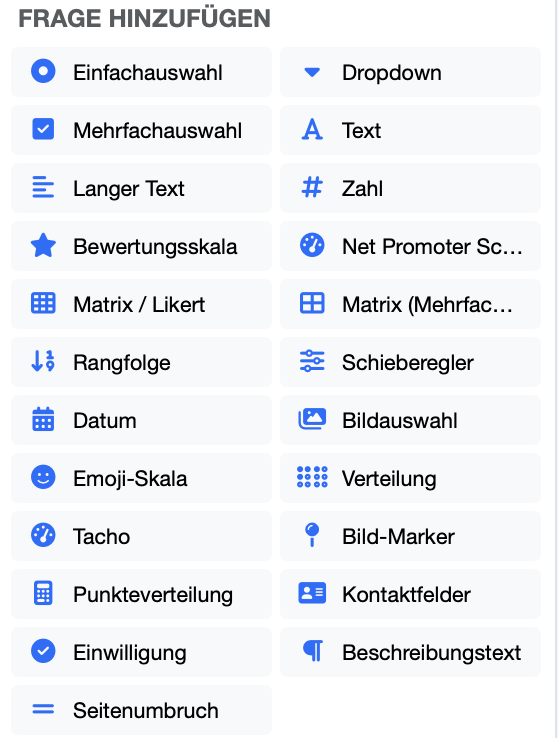
DataLion expands every question into the right data structure — exactly the way professional analysis expects it: one categorical column per single-choice question, one 0/1 column per multiple-choice option and one column per matrix/Likert row with the correct scale values.
Variable and value labels are generated automatically. nps_score = 9 becomes a labeled, immediately analyzable variable, not a bare number. There is nothing to recode.
- One categorical column per single-choice question
- One 0/1 column per multiple-choice option — no manual splitting
- One column per matrix/Likert row with scale value labels
- Variable and value labels generated automatically
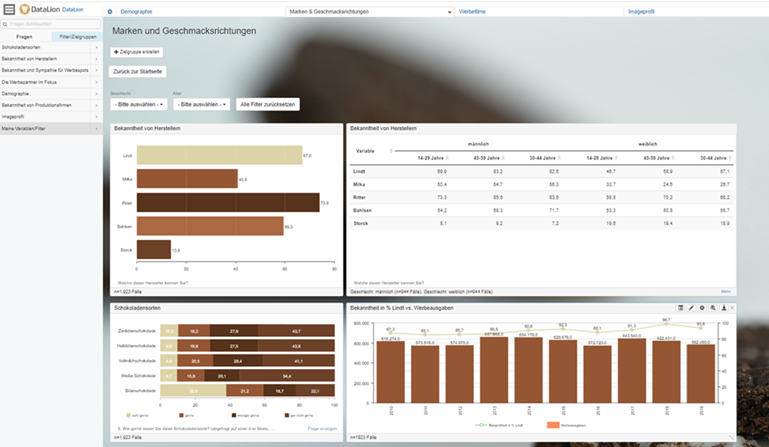
The dashboard fills with every response
The auto-created results dashboard is not a snapshot: it updates live as responses arrive. You watch fieldwork in real time — and can add your own charts, crosstabs and filters at any point.
From the same project you then export natively editable PowerPoint in your layout, flexible Excel report books or a PDF — with no copy-and-paste.
One structure, every wave
Because the dataset and codebook are created automatically and to a fixed scheme, every new wave of your study is instantly comparable. Editable variable codes like gender or nps_score stay stable across waves.
That is exactly what makes DataLion strong for tracking studies and NPS programs: set up cleanly once, every wave runs into the same dashboards.
From questionnaire to data prep — in one platform
Survey-to-dashboard is the bridge between collection and analysis. On the resulting dataset you weight, clean and cross-tabulate directly and run 20+ statistical procedures on an R engine — with no detour through SPSS or Excel.
More on collection on the Survey software page, more on reporting on the Dashboard software page.
See DataLion with your own data
Start a free trial or book a personal demo — from raw data to a finished dashboard.
What users say about DataLion
- via G2
Very professional company, attentive to the customer needs, provider of a great software and service.
Generoso M. · CRM Analyst, Automotive - via G2
The contacts at DataLion are very committed. If you have problems, you can count on help. DataLion reacts quickly to requests for new functions.
Robert Q. · Managing Director - via G2
User-friendliness, especially for market research topics. Structured backend with many customization options.
Verified user · Market Research - via G2
The embedding function allows us to generate insights of our data for our audience and customers by far less than half of the usual time needed before.
Verified user · Leisure, Travel & Tourism

We now work much more efficiently, giving us more time to take care of the derivations and insights from the data for the customers.
More survey features
Guides in the help center
Common questions about survey-to-dashboard
What happens when I publish a survey in DataLion?
Do I have to recode survey data before analysis?
Does the dashboard update automatically with new responses?
How are multiple-choice and Likert questions represented in the dataset?
Is survey-to-dashboard suitable for tracking studies?
Publish your survey — and watch the dashboard go live
Try DataLion free: build a questionnaire, publish it and watch the results dashboard go live instantly — with no recoding. Or book a personal demo.