Survey software compared
The DataLion alternative to SurveyMonkey
A survey in minutes — credit where due, SurveyMonkey nails that. The break comes at analysis: DataLion delivers tabulation, tracker dashboards and editable decks in one tool — hosted in Germany.
SurveyMonkey is great for collecting responses quickly and cheaply. But the moment you need weighting, banner crosstabs or trackers, you export to CSV/XLS/SPSS and finish elsewhere. DataLion does fieldwork, tabulation, dashboards and editable PowerPoint in one tool — hosted in Germany.
DataLion vs SurveyMonkey at a glance
SurveyMonkey is hard to beat at collecting responses — so here is an honest look at where it shines and where the difference really begins at analysis.
| DataLion | SurveyMonkey | |
|---|---|---|
| Survey fieldwork | Built in — a survey creates the project, dataset & codebook | Core strength: fast DIY surveys with a huge template library |
| Tabulation | Banner crosstabs, weighting, significance, net/top-box — point-and-click, R-backed | Crosstabs (5×10) with auto-significance, but no weighting; deep tabulation via export |
| Tracker dashboards | Auto-updating for waves & trackers | Live results view, but no true wave-tracker dashboards |
| Reports | Natively editable PowerPoint in your CI + Excel report books, automated | Export to PDF/PPT/XLS — a snapshot, redone each wave |
| Data export | Import & export incl. SPSS with labels, CSV, Excel, databases | Export CSV, XLS, PDF, PPT and SPSS (.SAV) |
| Data location & hosting | ISO 27001 data centers in Germany, DPA, on-premise | AWS (US); EU data center Dublin only as an Enterprise option |
Choose DataLion if …
- You need real tabulation: banner crosstabs, weighting and significance without exporting
- Tracking studies should run on auto-updating dashboards, wave after wave
- Hosting in Germany (ISO 27001 data centers), a DPA and optional on-premise are mandatory
- You want natively editable PowerPoint reports in your own CI, not manual snapshot exports
Choose SurveyMonkey if …
- You only need to collect responses and quick summaries — no MR tabulation
- Low entry cost and maximum simplicity matter more than analysis depth
- EU data residency is not a hard requirement — or you are on the Enterprise plan with Dublin anyway
- 🇩🇪 Made in Munich
- GDPR-compliant
- DPA included
- Hosted in Germany
- 🌐 Interface in EN, DE, FR & NL
A survey in minutes — this is what SurveyMonkey does well
Be fair: for simply collecting responses SurveyMonkey is extremely accessible. Hundreds of question templates, a clean editor, logic jumps, web/email/link distribution and built-in summaries with charts — for NPS, customer feedback or a quick ad-hoc survey you are live in minutes.
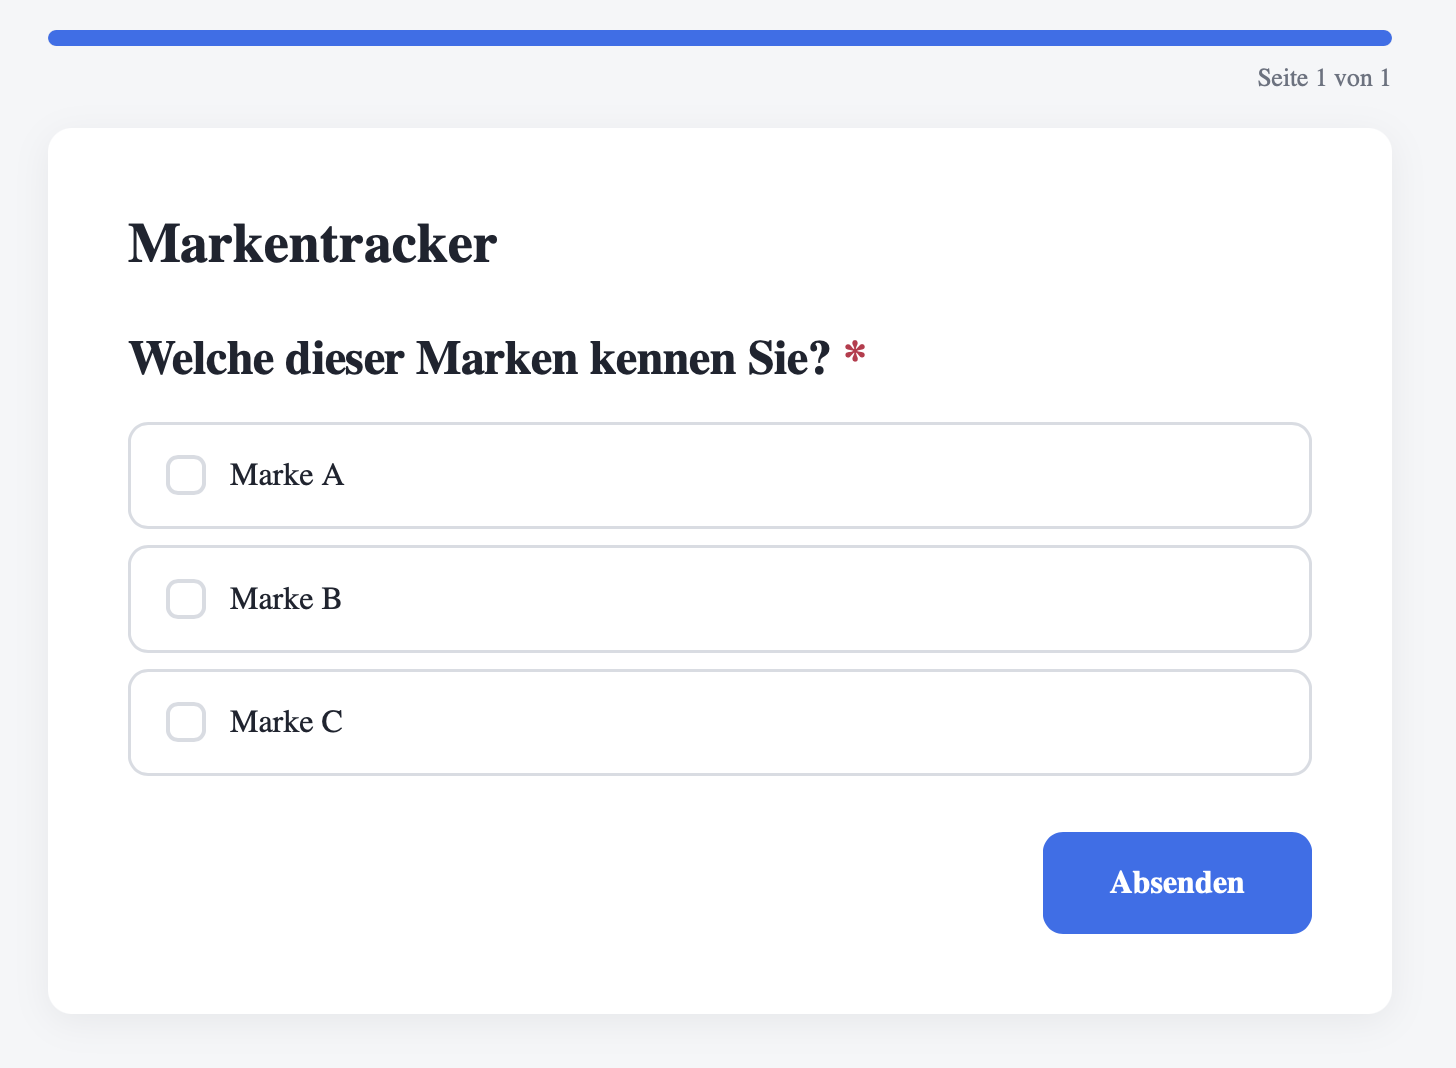
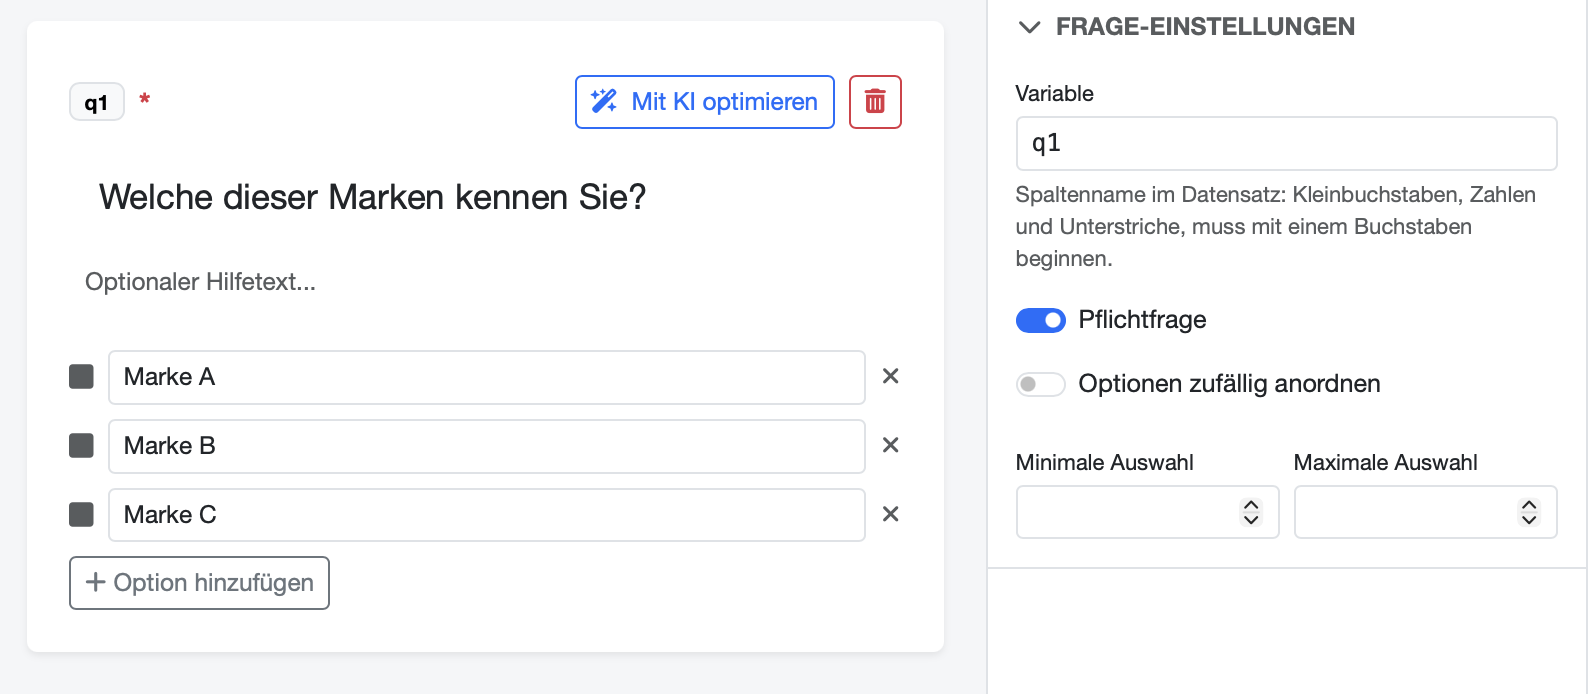
DataLion includes the same fieldwork, but treats it as the start of a data pipeline: publishing a survey auto-creates the project, dataset and a complete codebook. Multi-response becomes 0/1 columns and matrix questions one column per row — exactly the structure you need for crosstabs and weighting, instead of a response export you still have to prep.
- SurveyMonkey: huge template library, live in minutes
- Both: logic, branching and multi-channel distribution
- SurveyMonkey: built-in result summaries with charts
- DataLion: a survey creates the project, dataset & SPSS-style codebook
Tabulation & trackers: built for MR, not just reporting
SurveyMonkey does have analysis — paid plans add crosstabs (up to 5 questions in columns, 10 in rows), and significant differences are highlighted automatically (chi-square, p-values). What is missing is MR depth: no weighting in the basic crosstabs, no true banners across many subgroups, no point-and-click top/bottom-box logic. Once it gets serious, you export to CSV/XLS/SPSS and tabulate elsewhere.
DataLion is built for exactly that: crosstabs, weighting, significance tests, multi-response, net/top-box values and scales — point-and-click and R-backed, with no syntax. Tracking studies run on auto-updating dashboards: drop in a new wave and the tables and charts refresh. Instead of export → SPSS → PowerPoint, everything stays in one tool.
- DataLion: weighting & banner crosstabs across many subgroups
- DataLion: significance tests, net/top-box values & scales point-and-click
- DataLion: auto-updating dashboards for waves & trackers
- SurveyMonkey: solid crosstabs with auto-significance, but no weighting
Editable decks in your own CI — hosted in Germany
For reporting SurveyMonkey exports to PDF, PPT and Excel — fast and usable, but the PowerPoint is a snapshot you re-export each wave and reformat into your layout. DataLion produces natively editable PowerPoint in your corporate design plus Excel report books, and both refresh wave over wave automatically.
On data location the gap is widest: SurveyMonkey runs on AWS (headquartered in San Mateo, California) — there is an EU data center in Dublin, but as an Enterprise option; without it, European data often sits in the US. DataLion hosts in ISO 27001-certified data centers in Germany, includes a DPA and supports on-premise. On price, SurveyMonkey charges per user per year (Team plans from 3 users, with capped response volumes); DataLion uses flexible, usage-based licensing.
DataLion vs other survey tools
Common questions about DataLion and SurveyMonkey
What is the difference between DataLion and SurveyMonkey?
Can SurveyMonkey export data to SPSS?
Does SurveyMonkey have weighting and significance testing?
Where is my data hosted — DataLion vs SurveyMonkey?
See DataLion next to SurveyMonkey
Try DataLion for free — or get a demo of how fieldwork, tabulation, tracker dashboards and editable PowerPoint come together in one German tool.