Data preparation
Custom KPIs — your own metrics with SQL
Define your own metrics right in the codebook: NPS, top-box indices and derived scores via SQL — with CASE WHEN, SUM and ROUND. Computed at the data level and consistent across every wave, with no detour through SPSS.
DataLion computes your own KPIs right in the codebook: NPS, top-box indices and derived scores are built as computed columns via SQL — with CASE WHEN, SUM, ROUND, AVG and COUNT DISTINCT. They are computed at the data level, recalculated on every data update and applied consistently across every wave — with no export to SPSS.
- 🇩🇪 Made in Munich
- GDPR-compliant
- DPA included
- Hosted in Germany
- 🌐 Interface in EN, DE, FR & NL
Trusted by research, insights & media teams
- 50+ interactive chart types
- 20+ statistical methods
- SPSS · Excel · CSV import without data loss
- ISO 27001 certified data centers (Germany)
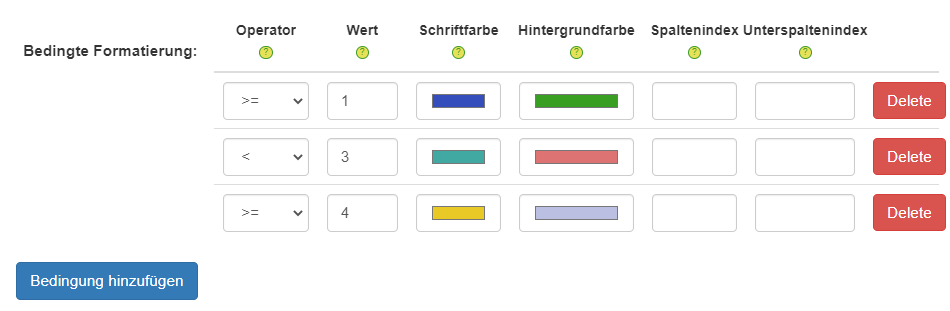
Define NPS, indices and scores yourself
Set your own metrics instead of rebuilding them in Excel: in DataLion you define NPS, top-box indices, sum scores, ratios and derived scores as computed columns — right in the codebook.
You build NPS, for example, with CASE WHEN nps >= 9 THEN 1 WHEN nps <= 6 THEN -1 ELSE 0 END — promoters minus detractors, as its own metric instead of by hand.
- NPS, top-box indices and sum scores
- Ratios and derived scores
- As computed columns right in the codebook
Computed via SQL expression
Your KPIs are built as SQL expressions — with functions like SUM, ROUND, AVG and COUNT DISTINCT plus conditional logic via CASE WHEN. That lets you build composite metrics too, say ROUND(SUM(top2) / COUNT(*) * 100, 1) for a top-2 index in percent.
Custom KPIs are SQL-based columns on your data — not a statistical model. For methods like regression or driver analysis, DataLion has its own analysis building blocks.
- Functions
SUM,ROUND,AVG,COUNT DISTINCT - Conditional logic via
CASE WHEN - Composite indices and ratios in a single expression
At the data level, consistent across every wave
Custom KPIs live at the data level and are recalculated on every data update — not redone chart by chart. When a new tracker wave arrives, DataLion recomputes your metrics automatically.
So every KPI stays consistent across every wave: defined once in the codebook, applied the same way everywhere — with no export to SPSS and no formulas maintained somewhere on the side.
- Computed at the data level, recalculated on every update
- Applied consistently across every tracker wave
- No SPSS export, no formulas maintained on the side
See DataLion with your own data
Start a free trial or book a personal demo — from raw data to a finished dashboard.
What users say about DataLion
- via G2
Very professional company, attentive to the customer needs, provider of a great software and service.
Generoso M. · CRM Analyst, Automotive - via G2
The contacts at DataLion are very committed. If you have problems, you can count on help. DataLion reacts quickly to requests for new functions.
Robert Q. · Managing Director - via G2
User-friendliness, especially for market research topics. Structured backend with many customization options.
Verified user · Market Research - via G2
The embedding function allows us to generate insights of our data for our audience and customers by far less than half of the usual time needed before.
Verified user · Leisure, Travel & Tourism

We now work much more efficiently, giving us more time to take care of the derivations and insights from the data for the customers.
More data preparation
Common questions about custom KPIs
Which KPIs can I compute in DataLion?
How do I compute an NPS?
Are custom KPIs updated when new data arrives?
Is this statistical modeling like regression?
Do I need SPSS or Excel for my own metrics?
Custom metrics that hold across waves
Try DataLion free: compute NPS, top-box indices and derived scores via SQL in the codebook — at the data level and consistent across every wave. Or book a demo.