Analysis & statistics
Crosstabs that understand market research
Build crosstabs with subcolumns, percentages by row, column, cell and total, with means, index and top-box nets — and significance-test column differences right in the table. No export, no SPSS.
DataLion builds crosstabs with subcolumns and nested tables, percentages by row, column, cell and total, sums, means, median and index, plus top-box, top-2, top-3 and bottom net rows. Differences are significance-tested right in the table at 80–99% — as a heatmap, with in-cell bars and conditional formatting.
- 🇩🇪 Made in Munich
- GDPR-compliant
- DPA included
- Hosted in Germany
- 🌐 Interface in EN, DE, FR & NL
Trusted by research, insights & media teams
- 50+ interactive chart types
- 20+ statistical methods
- SPSS · Excel · CSV import without data loss
- ISO 27001 certified data centers (Germany)
Table books nobody wants to maintain
- Banners and subcolumns are built in SPSS, then redone for reporting in Excel and PowerPoint — by hand, every wave.
- Top-box nets, index and weighted bases live in side calculations instead of cleanly in the table.
- Whether a difference between two columns is significant has to be checked separately and marked manually.
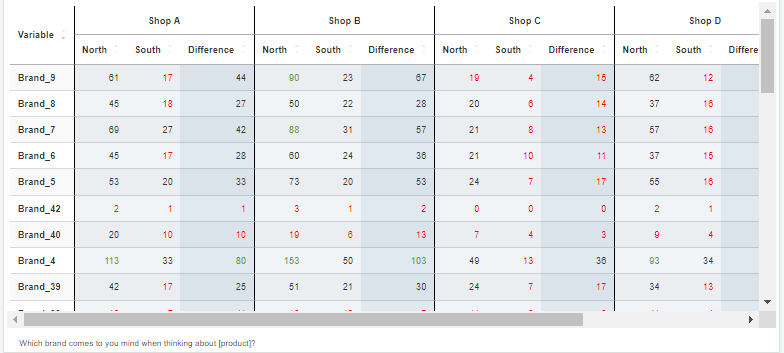
Subcolumns and nested tables
Put your question in the rows and as many subcolumns in the header as you need — by wave, target group, region or product. With nested tables you stack several dimensions and build complete banners.
The table stays consistent wave after wave: defined once, the same banner runs across every new data delivery — with nothing to rebuild.
- As many subcolumns in the header as you need
- Nested tables for multi-dimensional banners
- Base columns and weighted bases per column
- Consistent across every wave
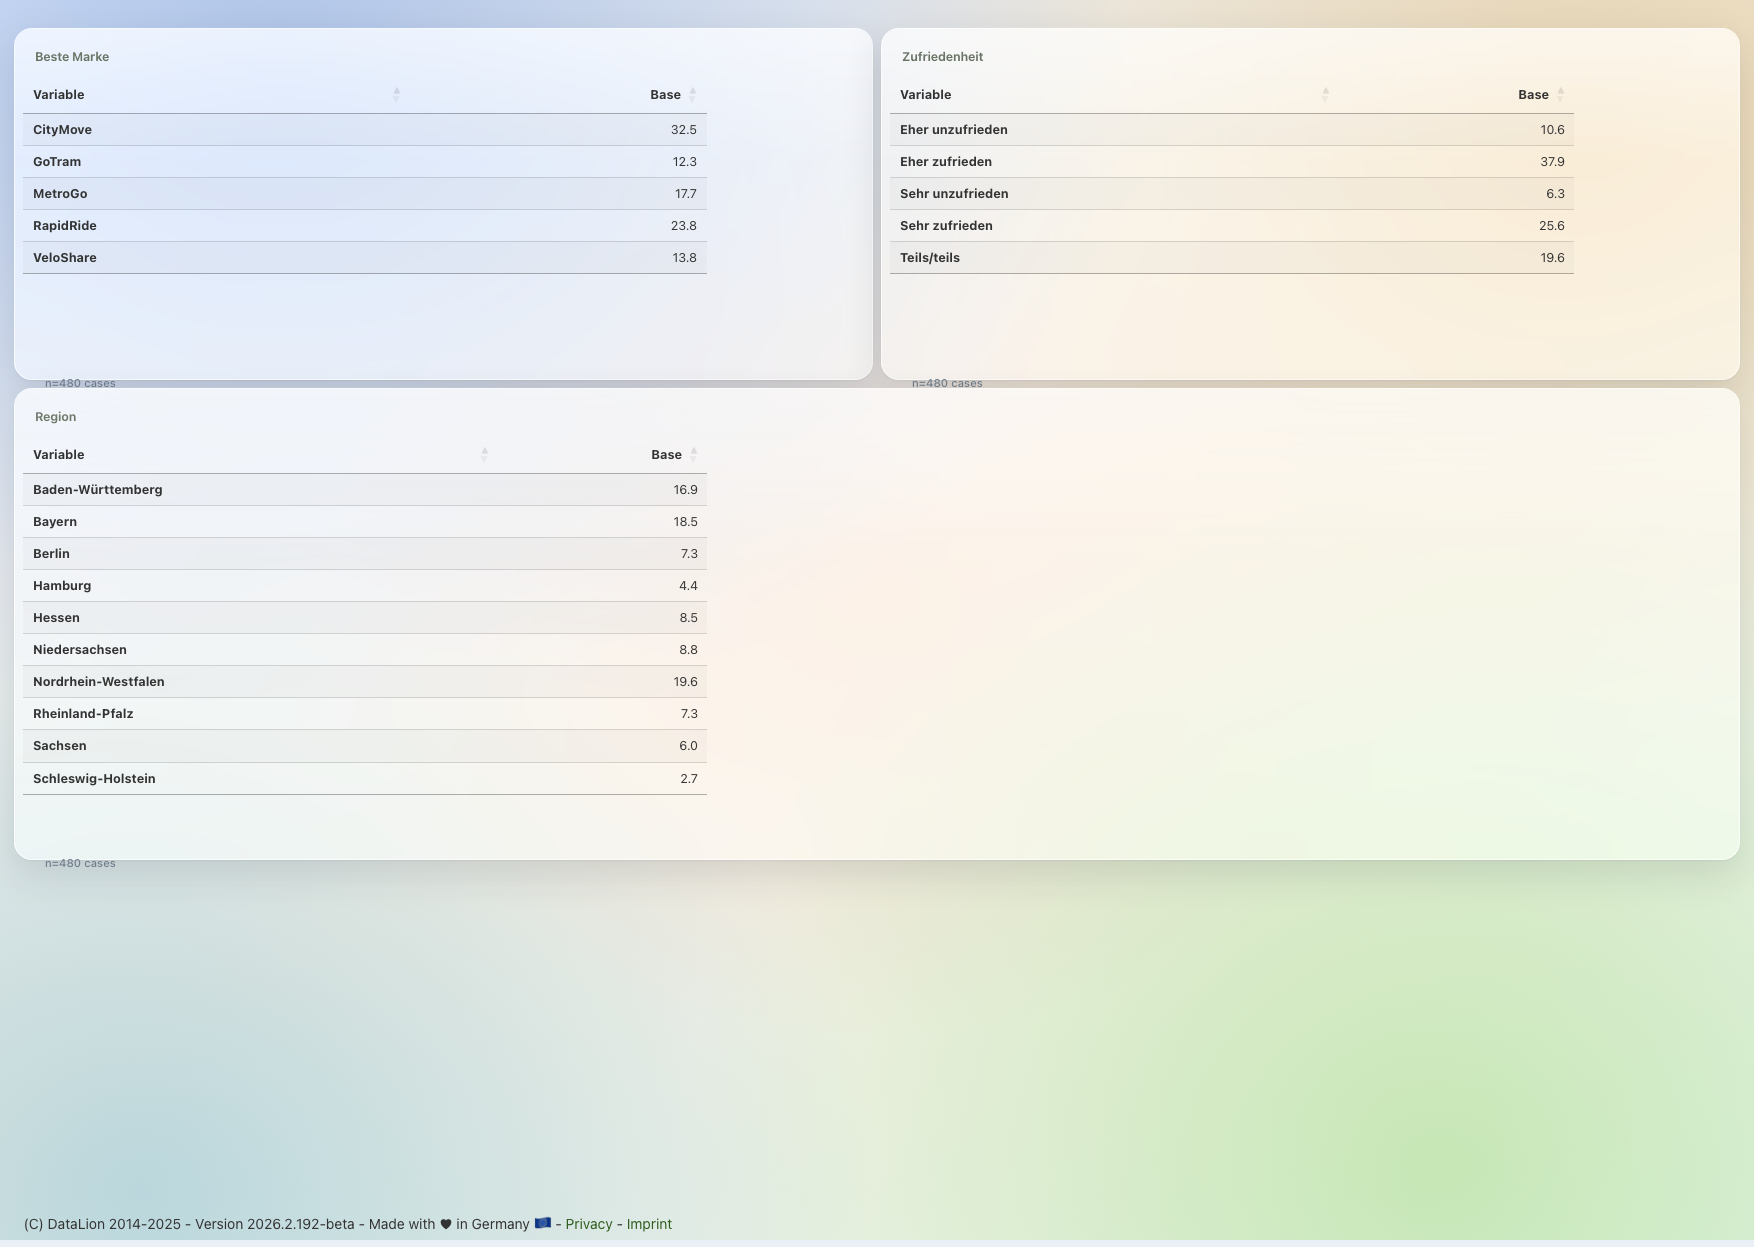
Every metric you need — in one cell
Show absolute values or percentages by row, column, cell and total. Add sums, means, median and an index that relates each cell to the total sample — ideal for spotting over- and under-represented groups at a glance.
Every metric is also available weighted: valid base (validTotal), valid percent and weighted means recalculate automatically as soon as a weight variable is in play.
- Percent by row, column, cell and total
- Sums, means and median per column
- Index against the total sample
- Weighted bases, percent and means
Top-box, top-2 and bottom net rows
Combine scale points into net rows: top-box, top-2, top-3 and bottom are a few clicks away and sit as their own row right in the table — no helper columns, no side calculation.
This is also how you compute metrics like the NPS or a satisfaction top-2 reproducibly, always on the same documented definition.
- Top-box, top-2, top-3 and bottom nets
- Net rows right in the table, no helper columns
- Reproducible, documented definitions
- The basis for NPS and satisfaction metrics
Significance right in the table
Differences between columns are tested directly in the crosstab — at four confidence levels (80%, 90%, 95%, 99%), as stars (*/**/***) or letters (a/A) for pairwise column comparisons.
Behind the scenes run the z-test, chi² and t-test on the R engine, with an optional Yates correction for chi². More on the significance testing page.
- 4 confidence levels: 80/90/95/99%
- Stars or letters for column comparisons
- z-, chi² and t-test on the R engine
- Optional Yates correction for chi²
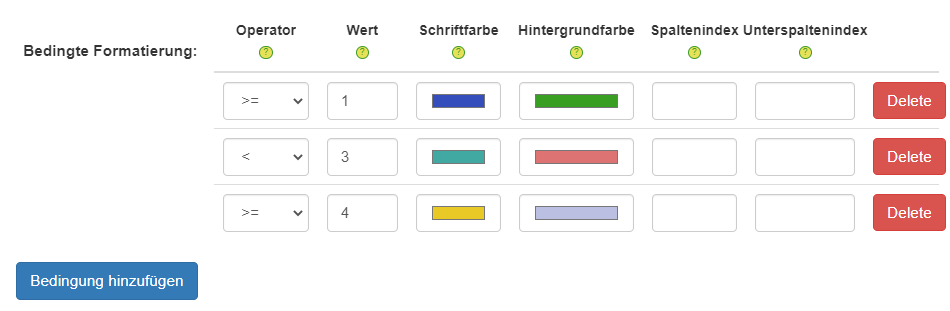
Heatmaps, in-cell bars and difference columns
Numbers become a statement at a glance: color cells as a heatmap, show shares as in-cell bars and flag outliers with conditional formatting. Difference columns place the change between two waves or groups right alongside.
A DataLion table reads like a finished chart — and exports as natively editable PowerPoint, an Excel report book or a PDF.
- Heatmaps and in-cell bars
- Conditional formatting by threshold
- Difference columns between waves or groups
- Export as PowerPoint, Excel or PDF
See DataLion with your own data
Start a free trial or book a personal demo — from raw data to a finished dashboard.
What users say about DataLion
- via G2
Very professional company, attentive to the customer needs, provider of a great software and service.
Generoso M. · CRM Analyst, Automotive - via G2
The contacts at DataLion are very committed. If you have problems, you can count on help. DataLion reacts quickly to requests for new functions.
Robert Q. · Managing Director - via G2
User-friendliness, especially for market research topics. Structured backend with many customization options.
Verified user · Market Research - via G2
The embedding function allows us to generate insights of our data for our audience and customers by far less than half of the usual time needed before.
Verified user · Leisure, Travel & Tourism

We now work much more efficiently, giving us more time to take care of the derivations and insights from the data for the customers.
More analysis features
Guides in the help center
Common questions about crosstabs
Can I build crosstabs with subcolumns and banners?
What percent and metric options are there?
Can DataLion compute top-box nets in the table?
Is significance shown in the crosstab?
How do I make a table readable without a chart?
Build your first crosstab
Try DataLion free: subcolumns, top-box nets, index and significance right in the tool — with no export. Or book a personal demo.