Analysis & statistics
Significance testing that thinks along
Test group and wave differences with the chi², z- and t-test at four confidence levels — shown as stars or letters, right in tables and charts. No data export, no R code. Made in Munich.
DataLion offers six significance tests on the R engine: the chi² test (pairwise, complement, independence), the z-test for proportions and the t-test for independent and dependent samples. Differences are shown at four confidence levels (80/90/95/99%) right in tables and charts — as stars or letters, with an optional Yates correction.
- 🇩🇪 Made in Munich
- GDPR-compliant
- DPA included
- Hosted in Germany
- 🌐 Interface in EN, DE, FR & NL
Trusted by research, insights & media teams
- 50+ interactive chart types
- 20+ statistical methods
- SPSS · Excel · CSV import without data loss
- ISO 27001 certified data centers (Germany)
Differences that only look like differences
- Segments get interpreted without checking whether the difference is statistically robust at all.
- Significance is computed in a second tool and then drawn into the table by hand.
- Which columns were tested against which, and at what level, is no longer traceable in the finished report.
Chi², z-test and t-test — the right test per question
DataLion ships the tests professional market research relies on: the chi² test in three variants (pairwise, complement and independence), the z-test for proportions and the t-test for means.
The t-test comes for independent samples (two separate groups) and for dependent (paired) samples — for example repeated measures before and after a touchpoint.
- Chi² test: pairwise, complement and independence
- z-test for proportions
- t-test for independent samples
- t-test for dependent (paired/repeated-measures) samples
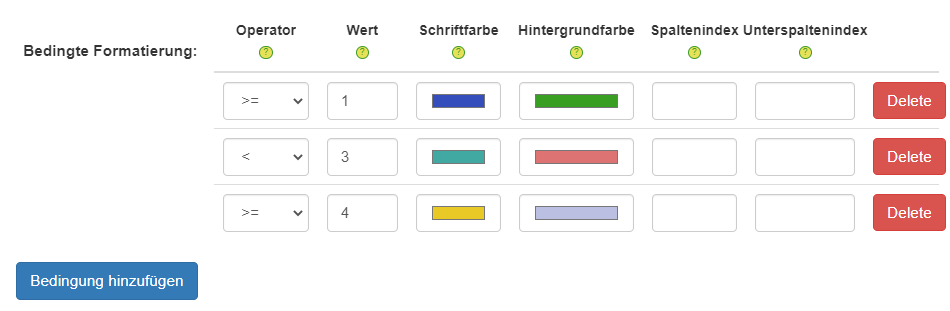
Four confidence levels, stars or letters
You decide how strict the test is: 80%, 90%, 95% or 99% confidence. The result appears as tiered stars (*/**/***) or as letters (a/A) that show which column differs significantly from which.
The notation stays consistent across the whole dashboard — anyone reading the report sees at once which difference is backed at which level.
- 4 confidence levels: 80%, 90%, 95%, 99%
- Stars (*/**/***) for the strength of the effect
- Letters (a/A) for pairwise column comparisons
- Consistent notation across the whole dashboard
Optional Yates correction for chi²
With small cell counts the chi² test can overstate. DataLion therefore offers the Yates correction as a switchable option — so the test stays conservative and robust even on thin bases.
Pairwise and complement comparisons are built in: you compare either two columns directly or one column against the rest of the sample.
- Yates correction for chi² switchable
- Conservative results on small cells
- Pairwise column comparison
- Complement comparison (column vs. the rest)
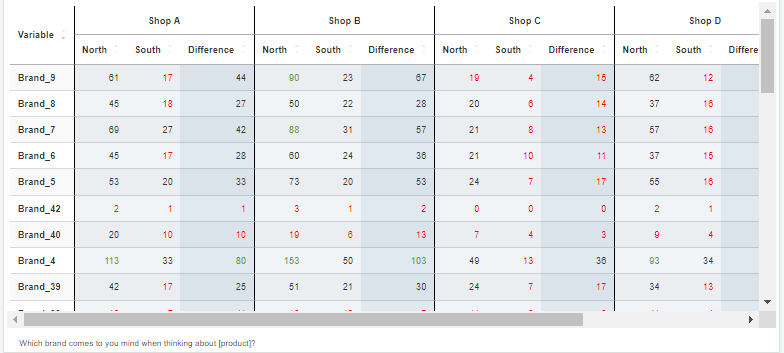
Right in tables, charts and tracking
Significance is not an extra step: it appears directly in the crosstab and in the chart the moment you switch it on. In tracking, this also lets you significance-test wave-over-wave change.
Because everything is computed in DataLion, there is no media break and no external statistics software — you export the tested tables as natively editable PowerPoint, Excel or PDF.
- Significance right in the crosstab and chart
- Wave-over-wave tests in tracking
- No data export, no external software
- Export tested tables as PowerPoint, Excel, PDF
See DataLion with your own data
Start a free trial or book a personal demo — from raw data to a finished dashboard.
What users say about DataLion
- via G2
Very professional company, attentive to the customer needs, provider of a great software and service.
Generoso M. · CRM Analyst, Automotive - via G2
The contacts at DataLion are very committed. If you have problems, you can count on help. DataLion reacts quickly to requests for new functions.
Robert Q. · Managing Director - via G2
User-friendliness, especially for market research topics. Structured backend with many customization options.
Verified user · Market Research - via G2
The embedding function allows us to generate insights of our data for our audience and customers by far less than half of the usual time needed before.
Verified user · Leisure, Travel & Tourism

We now work much more efficiently, giving us more time to take care of the derivations and insights from the data for the customers.
More analysis features
Guides in the help center
Common questions about significance testing
Which significance tests does DataLion support?
At which confidence levels does it test?
Is there a Yates correction?
Where is significance shown?
Do I need statistics or R skills?
Test your differences for significance
Try DataLion free: chi², z- and t-test right in tables and charts — with no export. Or book a personal demo.