
Use case: pricing research
Pricing research: what your market will actually pay
Establish willingness to pay with the established methods — Van Westendorp for the accepted price range, choice-based conjoint for price in a competitive set. Fielding, estimation and the simulator live in one platform. ISO 27001-certified hosting, GDPR-compliant, made in Munich.
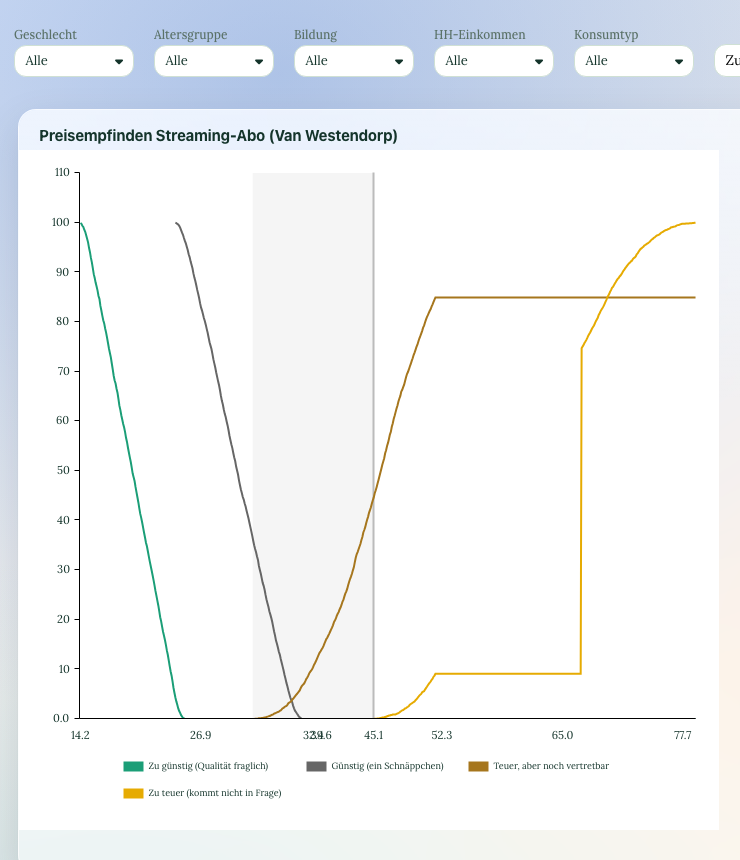
DataLion covers pricing research from fielding to analysis. Van Westendorp ships as its own chart type: it draws four cumulative price curves, shades the accepted price range and marks the optimal price point. Choice-based conjoint runs natively with design, fielding and estimation on R. The preference simulator reports preference shares and willingness to pay in currency.
- 🇩🇪 Made in Munich
- GDPR-compliant
- DPA included
- Hosted in Germany
- 🌐 Interface in EN, DE, FR, ES, IT & NL
Trusted by research institutes, brands & insights teams






- 4 curves Van Westendorp price curves
- PMC · OPP · PME computed price points
- logit/MNL on R conjoint estimation
- WTP willingness to pay in the simulator
Why pricing decisions still get made on instinct
- The price question gets asked, but the analysis stops at the mean — the accepted range stays invisible.
- Conjoint data goes out to an agency and comes back as a PDF nobody can recompute.
- The pricing meeting is missing exactly the one scenario somebody now wants to see.
Van Westendorp: make the accepted price range visible
DataLion analyzes the four classic price questions — too cheap, cheap, expensive, too expensive — with a dedicated chart type. It bins the stated prices into fine price steps and draws four cumulative curves from them: two falling, two rising.
Where those curves cross you get the point of marginal cheapness (PMC), the point of marginal expensiveness (PME) and the optimal price point (OPP). The chart shades the accepted price range between the two limits and marks the optimal price point with a line — so the pricing debate starts from a picture rather than a spreadsheet.
- Four cumulative price curves from the four Van Westendorp questions
- Accepted price range shaded between PMC and PME
- Optimal price point (OPP) marked as a line
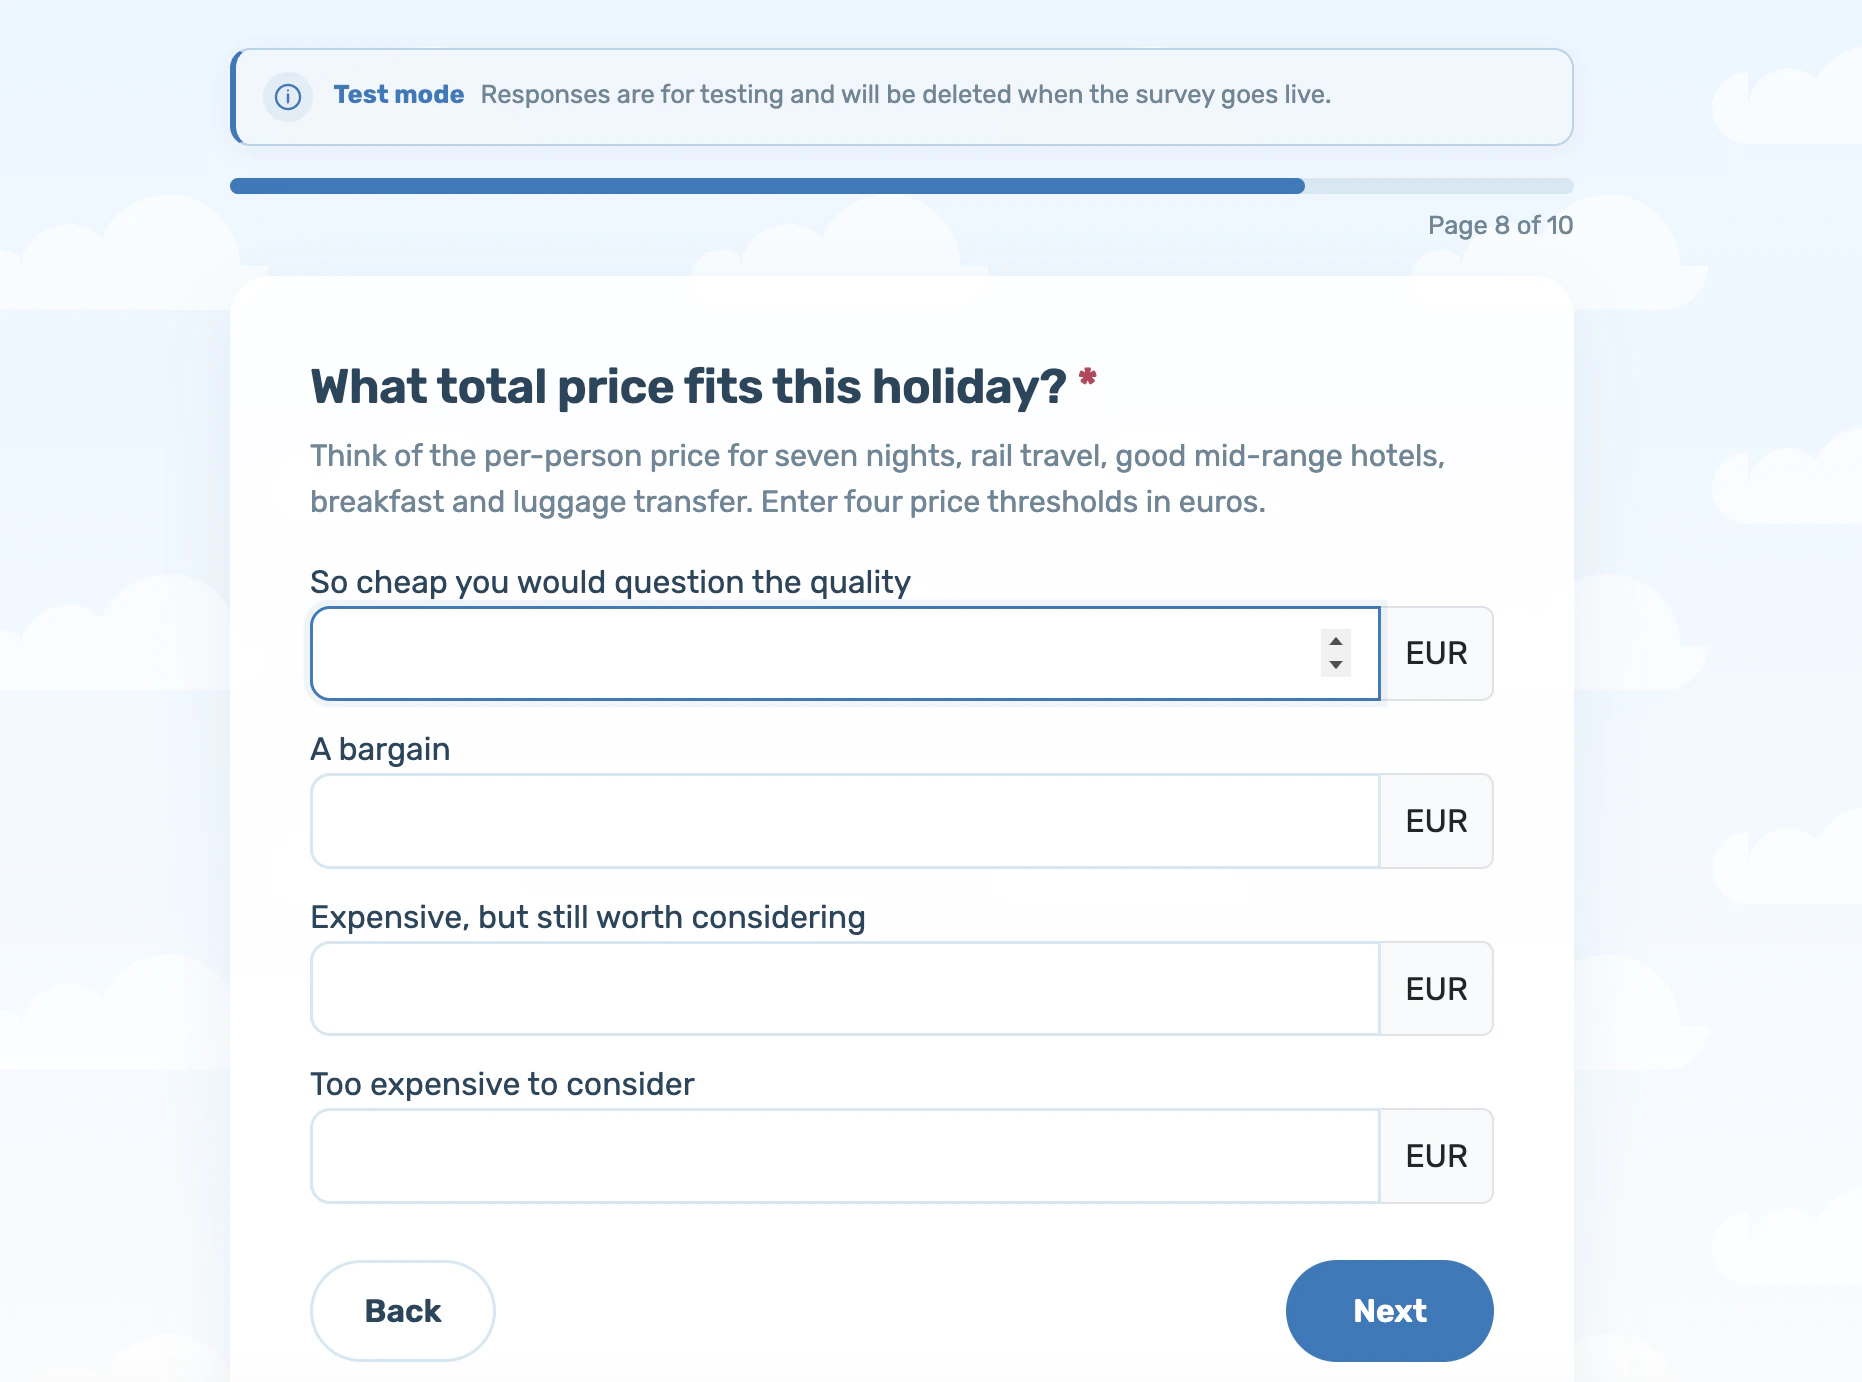
- Ready-made questionnaire template: price sensitivity (Van Westendorp)
Conjoint: price in the context of the whole product
Van Westendorp asks about price on its own. In reality customers trade price against features. That is exactly what choice-based conjoint captures — and it runs natively in DataLion: you define attributes and levels, DataLion generates a balanced choice design, fields it through its own survey and estimates the utilities with a logit model (MNL) on the R engine.
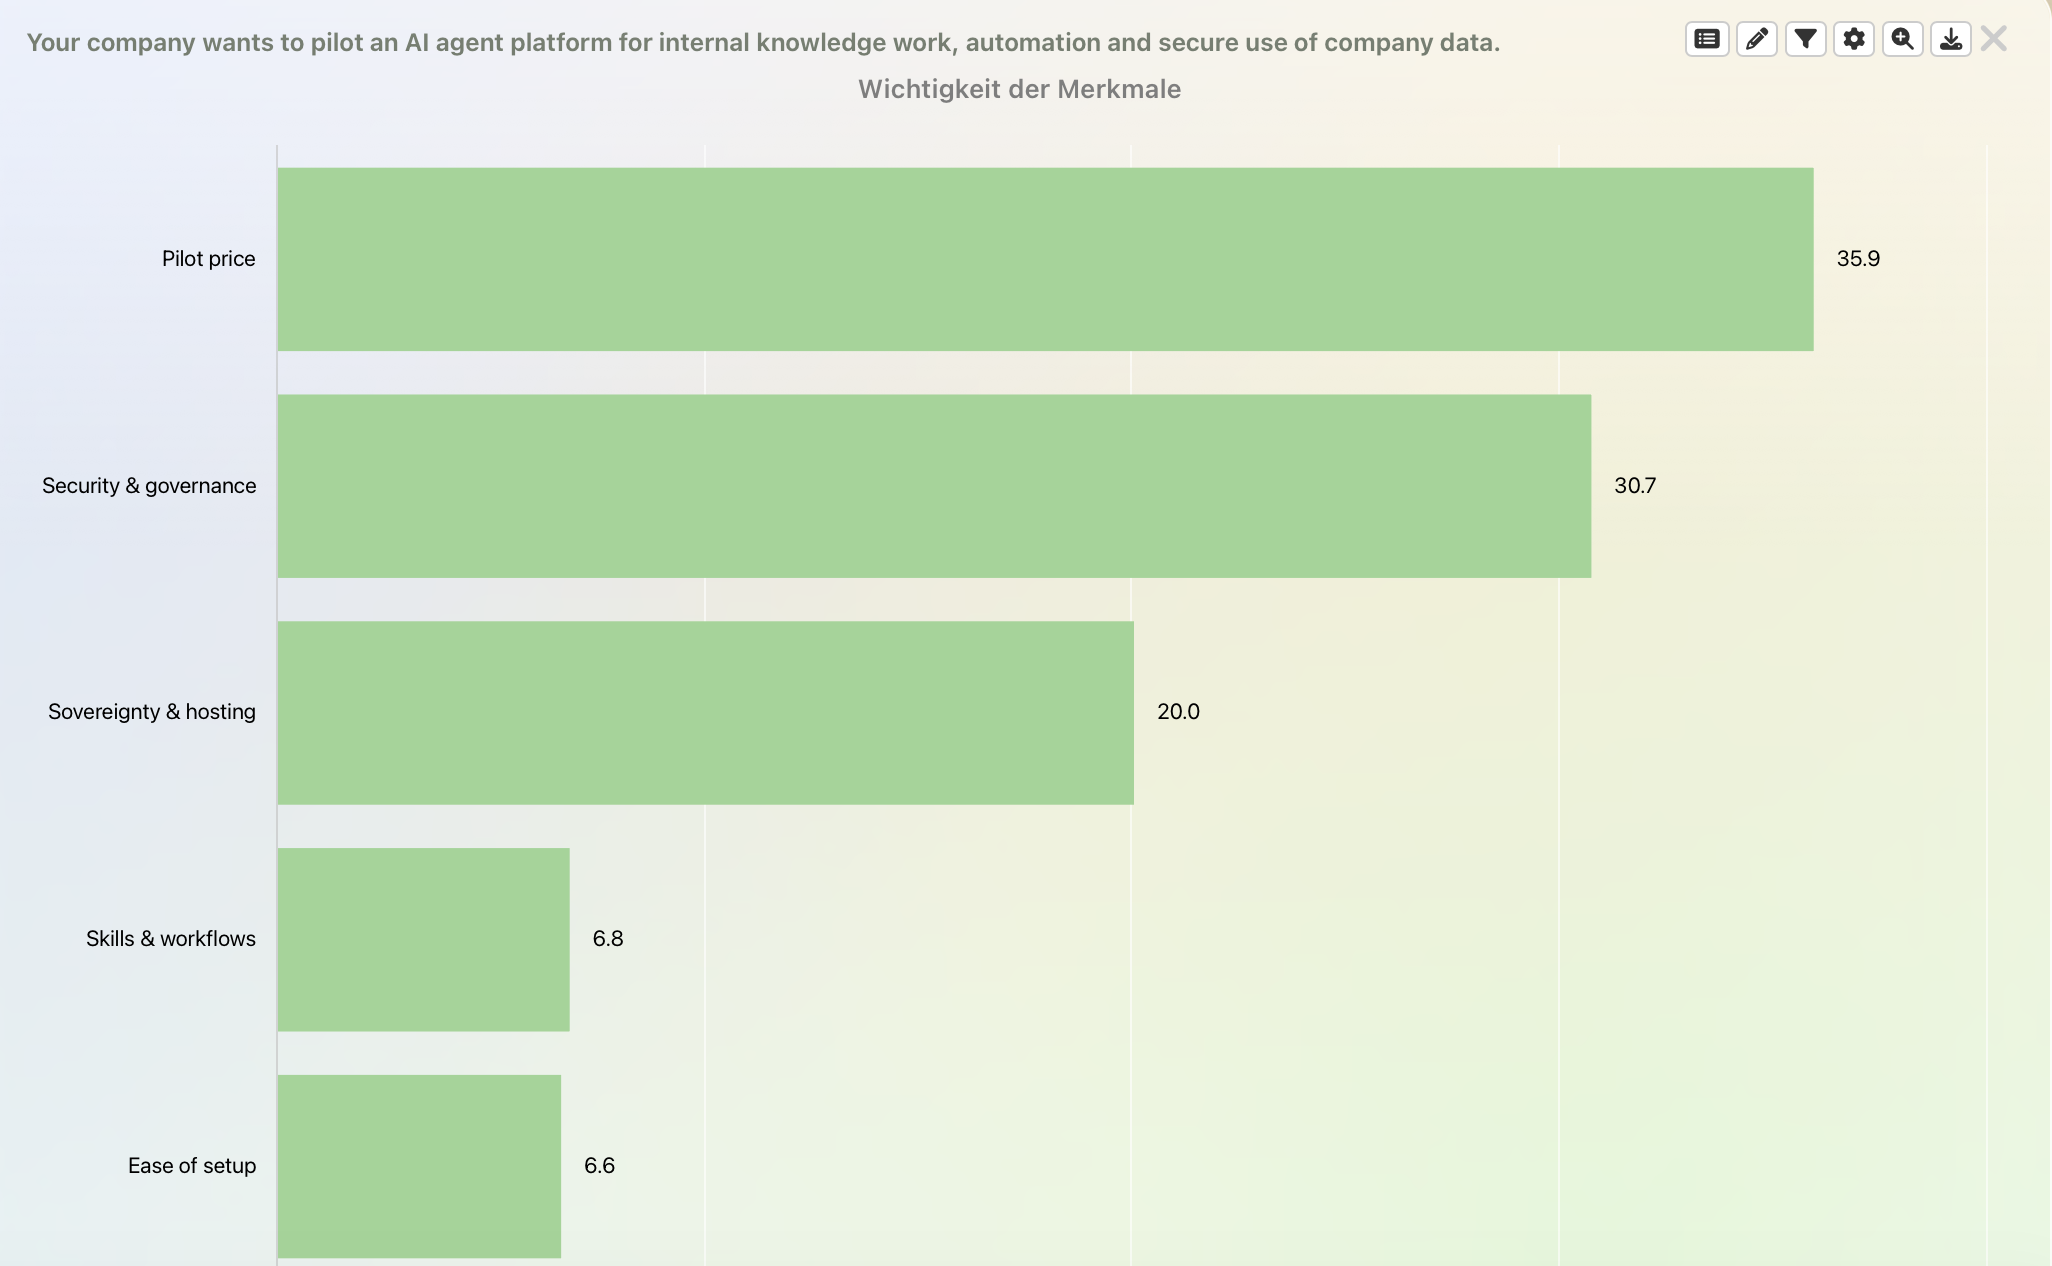
From those utilities DataLion computes attribute importance — the share each attribute contributes to the decision. If your design includes a price attribute, the simulator also converts utilities into currency amounts, giving you the willingness to pay for every single level.
- Balanced, reproducible choice design across several questionnaire versions
- Part-worth utilities estimated by logit/MNL on the R engine
- Attribute importance in percent from the range of the utilities
- Willingness to pay in currency as soon as a price attribute is in the design
Play through price scenarios in the simulator
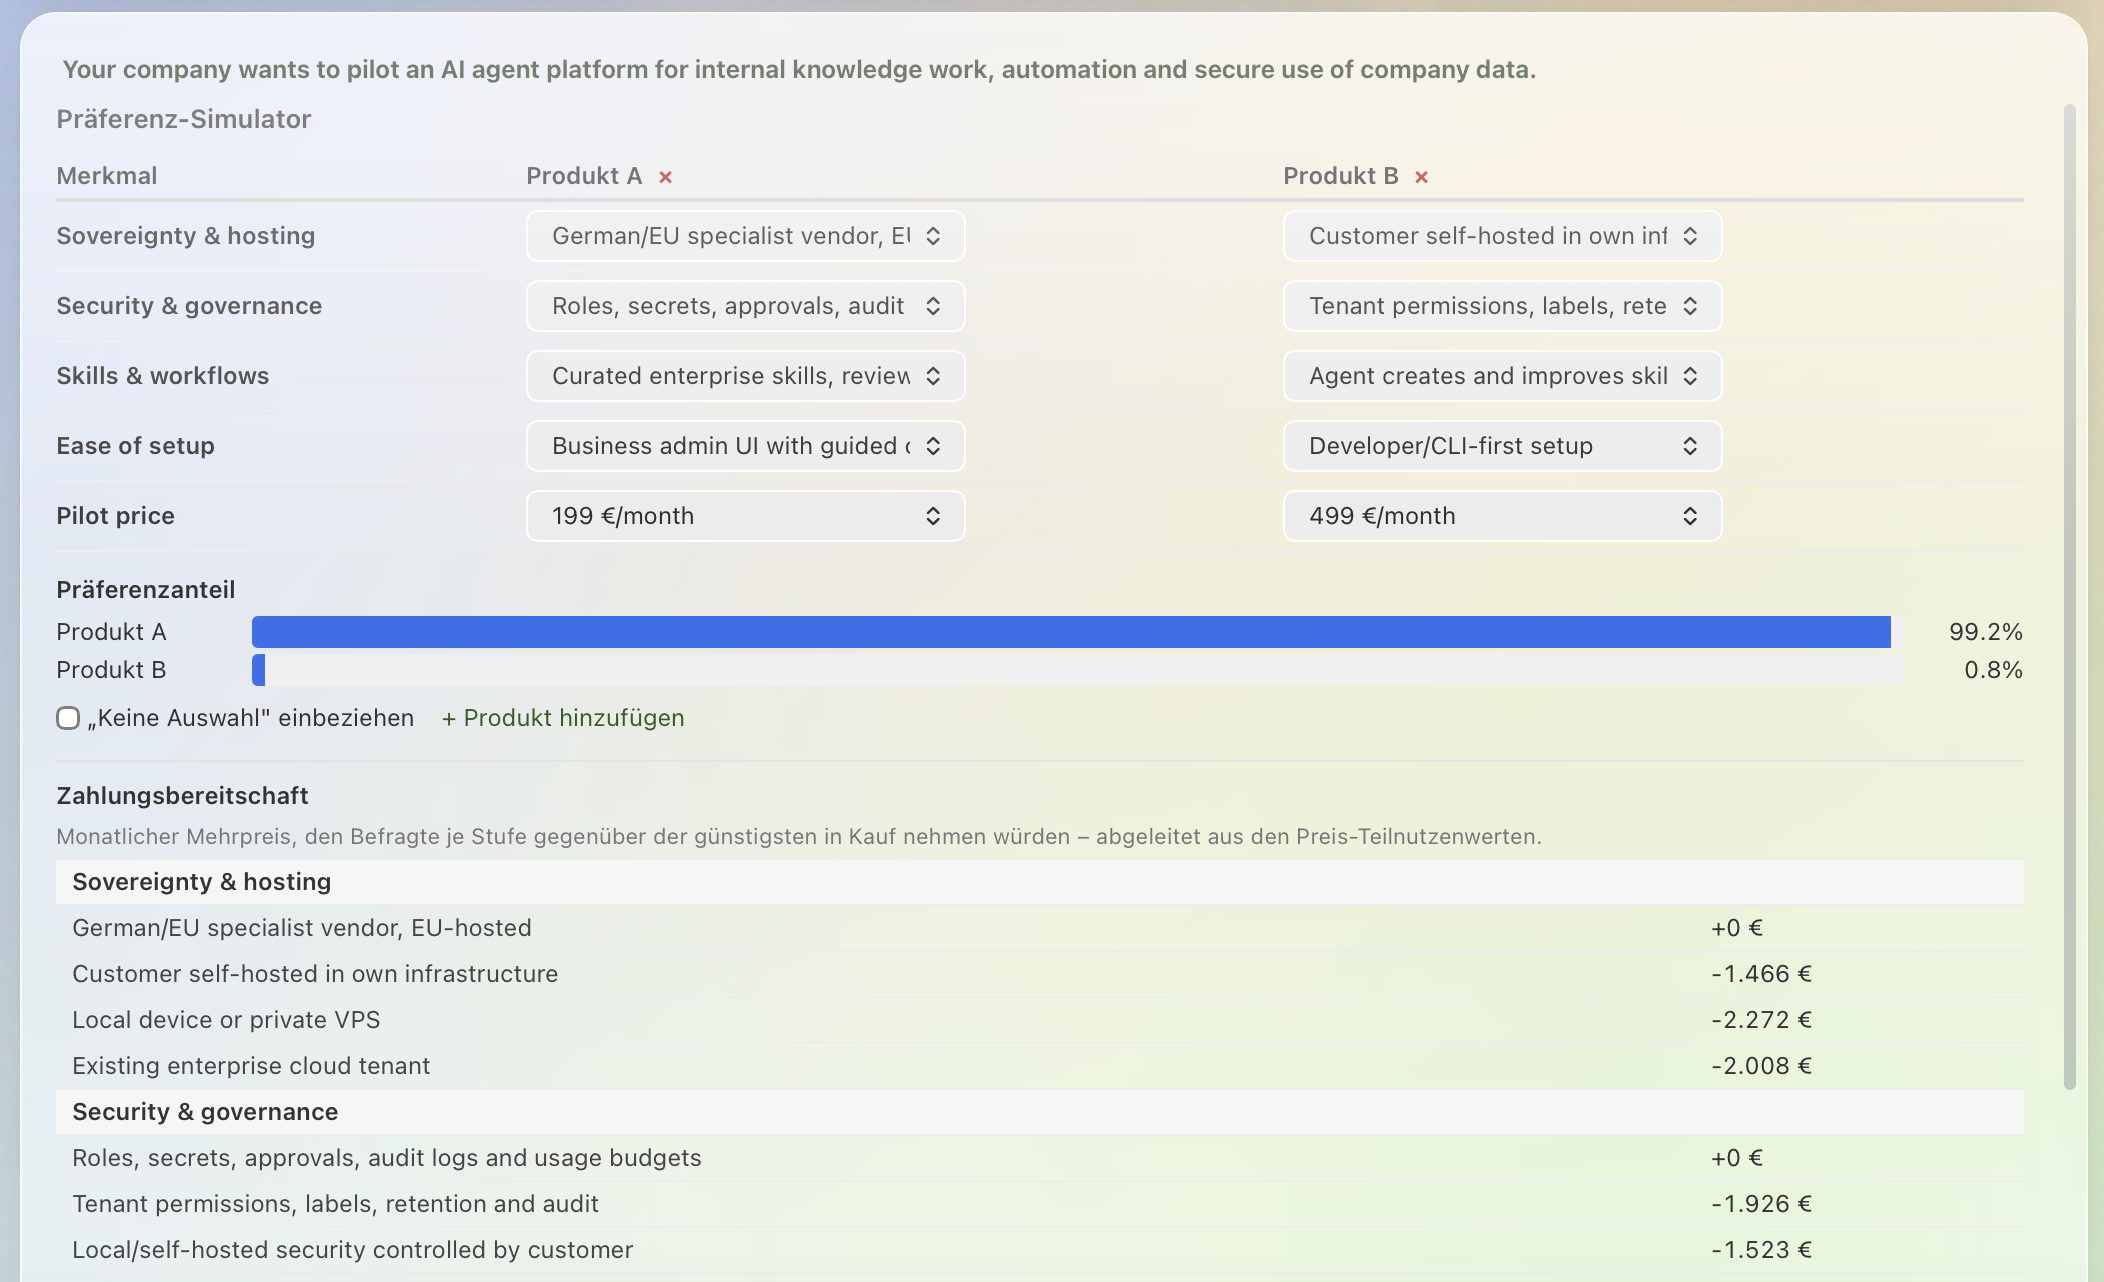
The built-in preference simulator answers the question that actually gets asked in the pricing meeting: what happens if we move the price up one step? You assemble competing products level by level — optionally including a none-of-these option — and see each product’s preference share recomputed immediately.
The sensitivity view sweeps each attribute through all of its levels and ranks them by how far they move the preference share. One picture tells you whether price or a feature is the stronger lever.
- Assemble competing products, none-of-these option optional
- Preference shares in percent, recalculated live
- Sensitivity view: which attribute moves the share most
- Break results out by audience via a screener question
Willingness to pay by segment — with significance
An average price almost always hides the fact that segments pay differently. So break price acceptance and utilities down with live filters by audience, region, customer type or usage intensity. The conjoint analysis compares subgroups side by side and reports the base size for each column.
Differences between segments are significance-tested right in the table — at 80%, 90%, 95% or 99% confidence via z-test, chi² or t-test. If a weight variable is present, DataLion computes price acceptance against your target frame.
- Live filters by audience, region, customer type or usage intensity
- Subgroup comparison with the base size shown per column
- Significance at 80/90/95/99% — as stars or letters
- Weighted analysis against the target frame of your sample
Launch pricing studies with ready-made questionnaires
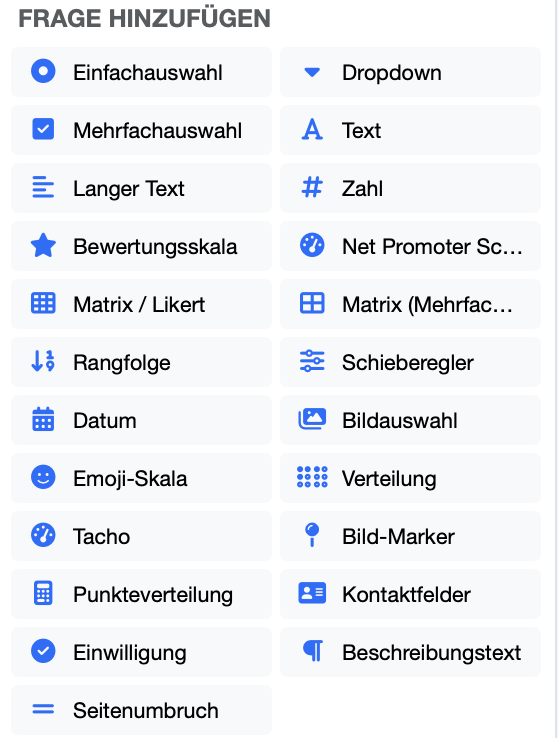
You do not have to build a pricing study from scratch. DataLion ships ready-made questionnaire templates: price sensitivity by Van Westendorp with the four canonical price questions, and a Gabor-Granger price test with stepped purchase-intent questions. Both are bilingual and adapted in minutes.
On publishing, DataLion creates the project, dataset and codebook with value labels automatically. Stated prices are analyzable right away — no recoding, no export to SPSS. For the Gabor-Granger test you assemble the demand curve from the standard chart types; there is no dedicated Gabor-Granger analysis.
- Bilingual templates for Van Westendorp and Gabor-Granger
- Auto-codebook with value labels — analyzable at once, no recodes
- Invite by anonymous link, QR code or one-time token
- Demand curve for the Gabor-Granger test from standard chart types
What you can build with DataLion
-
Van Westendorp pricing study
Four price curves, accepted range and the optimal price point.
See the template → -
Conjoint with a price simulator
Utilities, attribute importance and willingness to pay.
See how → -
Price acceptance by segment
Weighted and checked for significance.
See how →
See DataLion with your own data
Start free with your own raw data. Or book a personal demo of the path to a finished dashboard.
What users say about DataLion
- via G2
The embedding function allows us to generate insights of our data for our audience and customers by far less than half of the usual time needed before.
Verified user · Leisure, Travel & Tourism - via G2
User-friendliness, especially for market research topics. Structured backend with many customization options.
Verified user · Market Research - via G2
The contacts at DataLion are very committed. If you have problems, you can count on help. DataLion reacts quickly to requests for new functions.
Robert Q. · Managing Director - via G2
Very professional company, attentive to the customer needs, provider of a great software and service.
Generoso M. · CRM Analyst, Automotive

We now work much more efficiently, giving us more time to take care of the derivations and insights from the data for the customers.
The platform in detail
Go deeper
Common questions about pricing research with DataLion
Can DataLion run a Van Westendorp analysis?
How do I establish willingness to pay?
Does DataLion support Gabor-Granger?
Does DataLion estimate conjoint with hierarchical Bayes?
Can I analyze willingness to pay by audience?
Ready to prove your price instead of guessing it?
Try DataLion free with a ready-made pricing-study template — from the four price questions to the simulator. Or book a personal demo.