
Sector: manufacturers & importers with dealer networks
Dealer satisfaction that reaches the individual outlet
The agency's slide deck shows that the south region slips on parts supply. It does not show which outlet. DataLion collects the dealer survey and the end-customer service feedback and analyses them per country, region and outlet, with a dashboard for every level of the cascade.
Free to start · no credit card · hosted in Germany
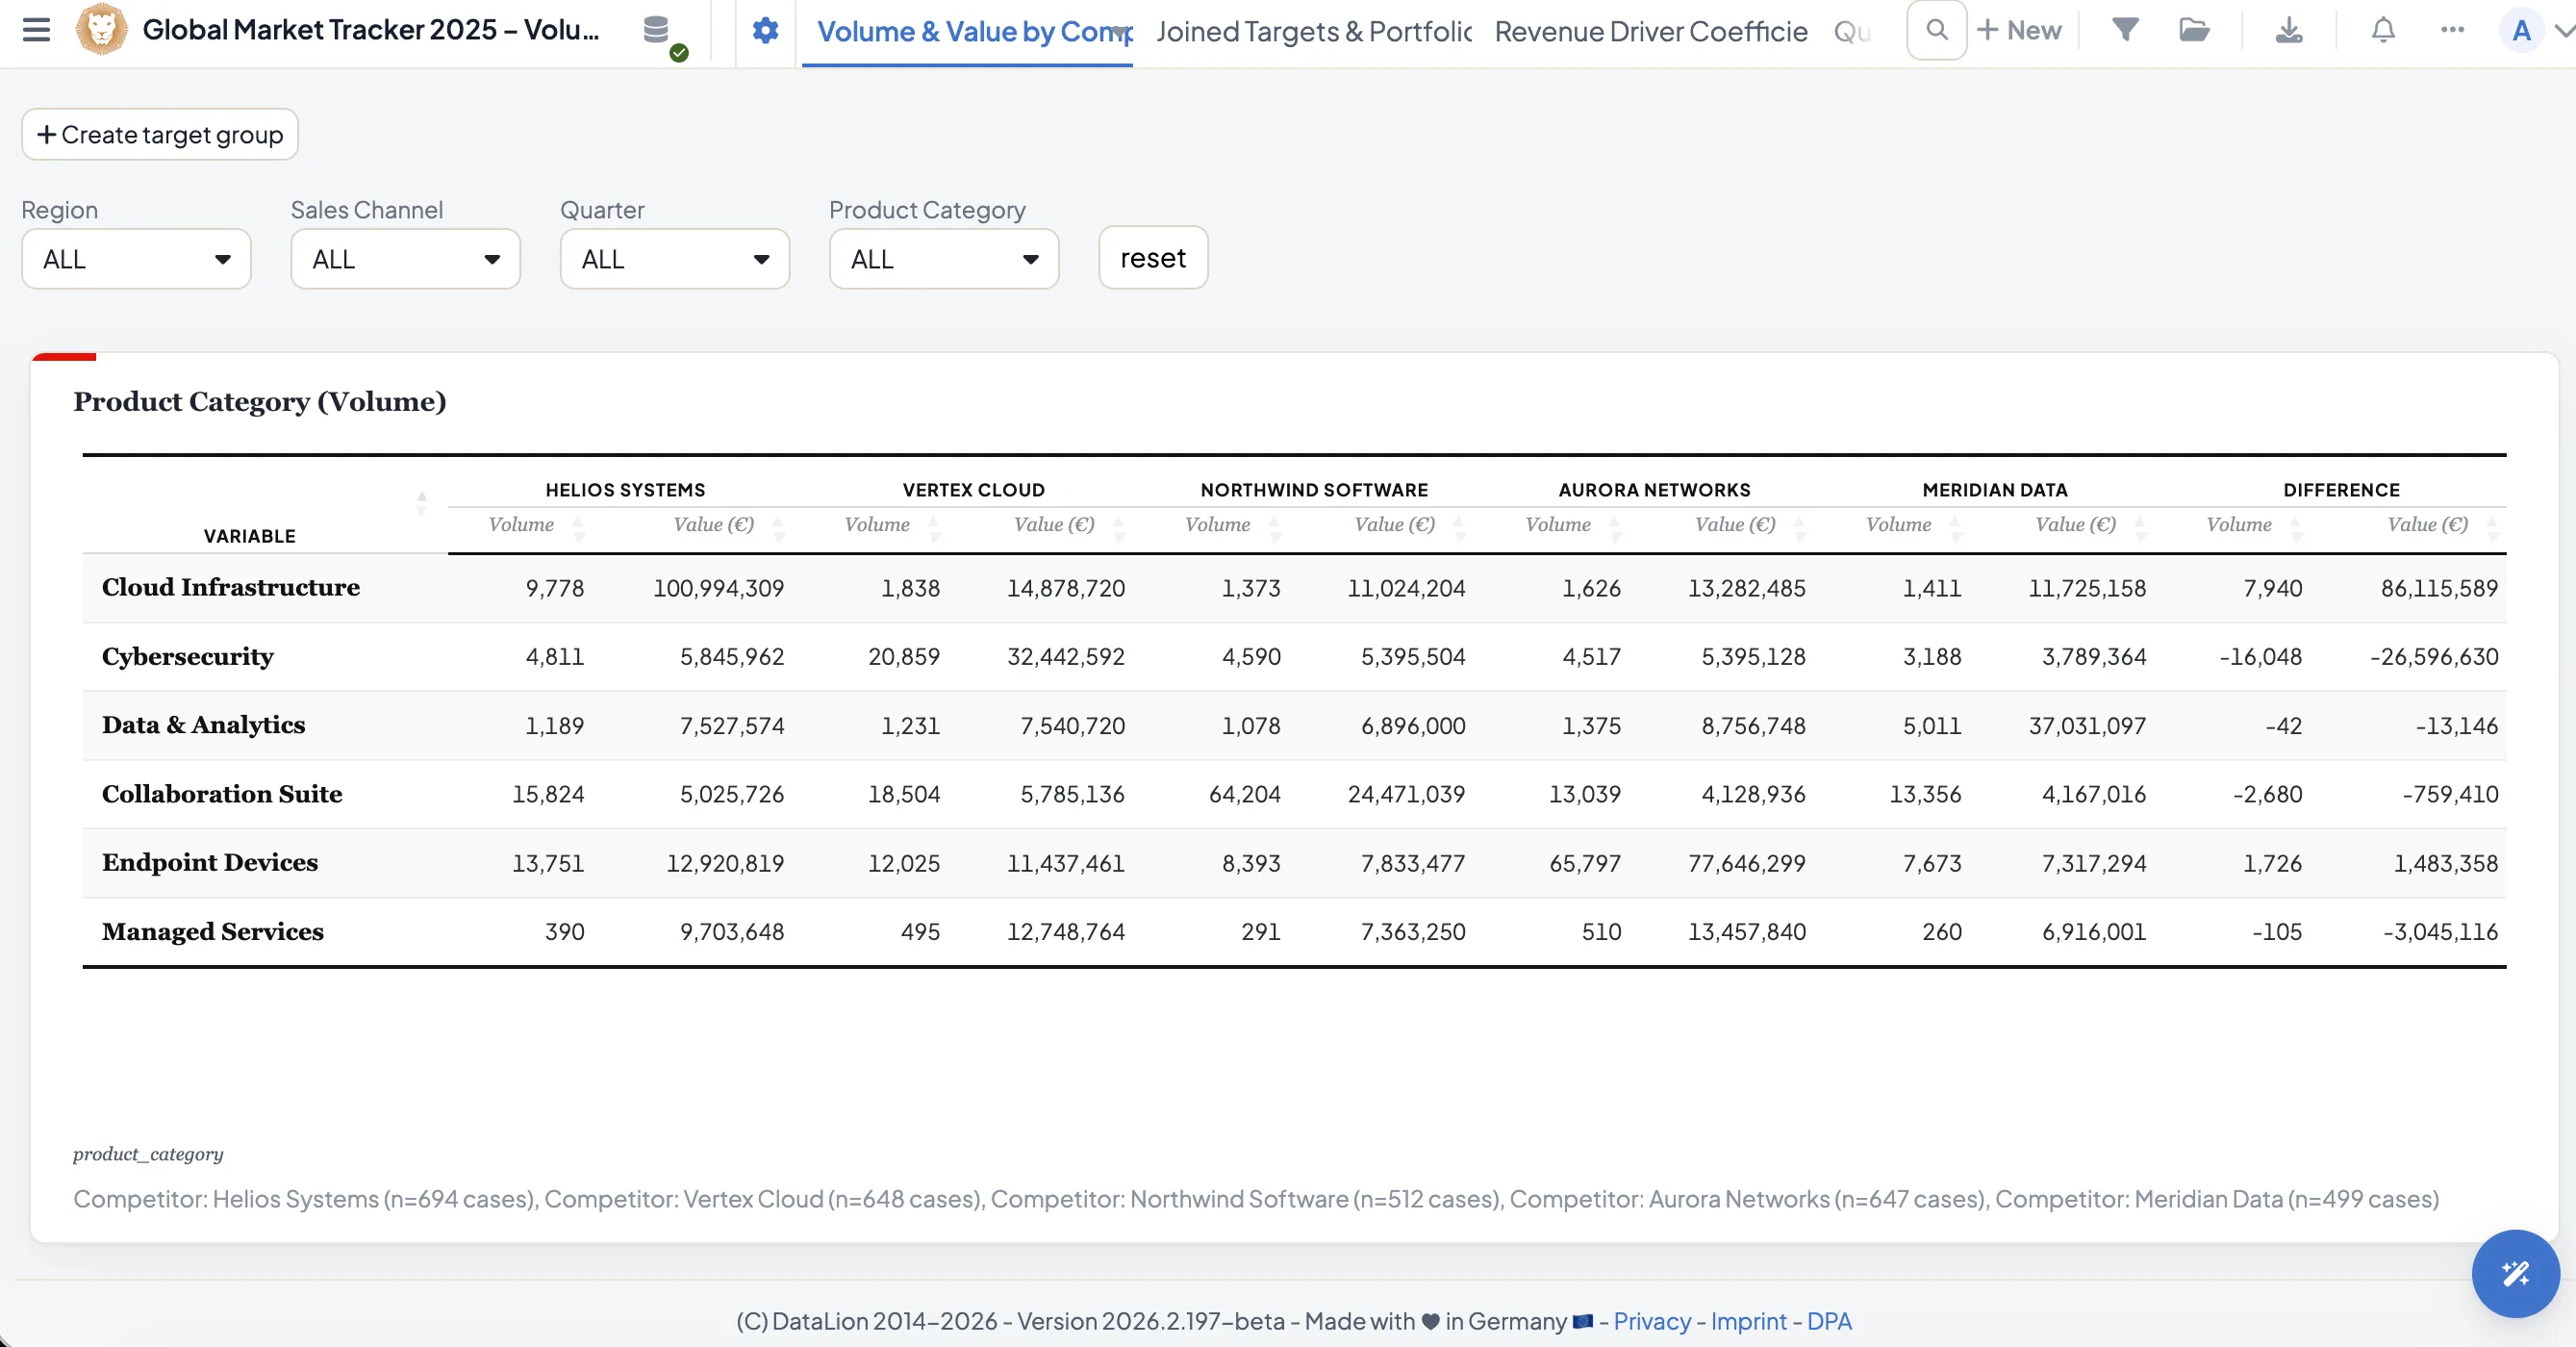
DataLion is a survey and analysis platform for manufacturers and importers with a dealer or service network: the dealer survey (DSI) and the end-customer service feedback (CSI) run in one dataset in which country, region and outlet are analysis dimensions via URL parameters. Every level of the network sees its dashboard pre-filtered, head office compares all regions with significance tests and driver analysis. Invitations and reminders come from the fieldwork module, and the report per outlet is an export.
- 🇩🇪 Made in Munich
- GDPR-compliant
- DPA included
- Hosted in Germany
- 🌐 Interface in EN, DE, FR, ES, IT & NL
Trusted by research institutes, brands & insights teams






- 50+ interactive chart types
- 20+ statistical methods
- SPSS · Excel · CSV import without data loss
- ISO 27001 certified data centers (Germany)
Where network surveys break down in practice
- The dealer survey arrives once a year as a slide deck per region. Nobody answers "which outlet drags the score down?", because the raw data sits with the agency.
- The cascade is manual work: head office builds 40 regional reports from one Excel file, the countries build outlet reports from those, and in March every outlet knows its November score.
- Twelve countries, twelve questionnaires, twelve datasets. The cross-border network comparison lives in a pivot table nobody understands after the third update.
- The dealer rates margins 2.1, and head office does not know whether that drives the intention to leave or is merely the loudest point.
Country, region and outlet are analysis dimensions, not reports
Append a parameter per outlet to the survey link, for example ?country=at®ion=west&outlet=4711. The values are stored as separate variables with every response and are available in the dashboard as filters and comparison dimensions. One link per outlet, one shared dataset for the whole network, and the cascade becomes a matter of filters, not of reports.
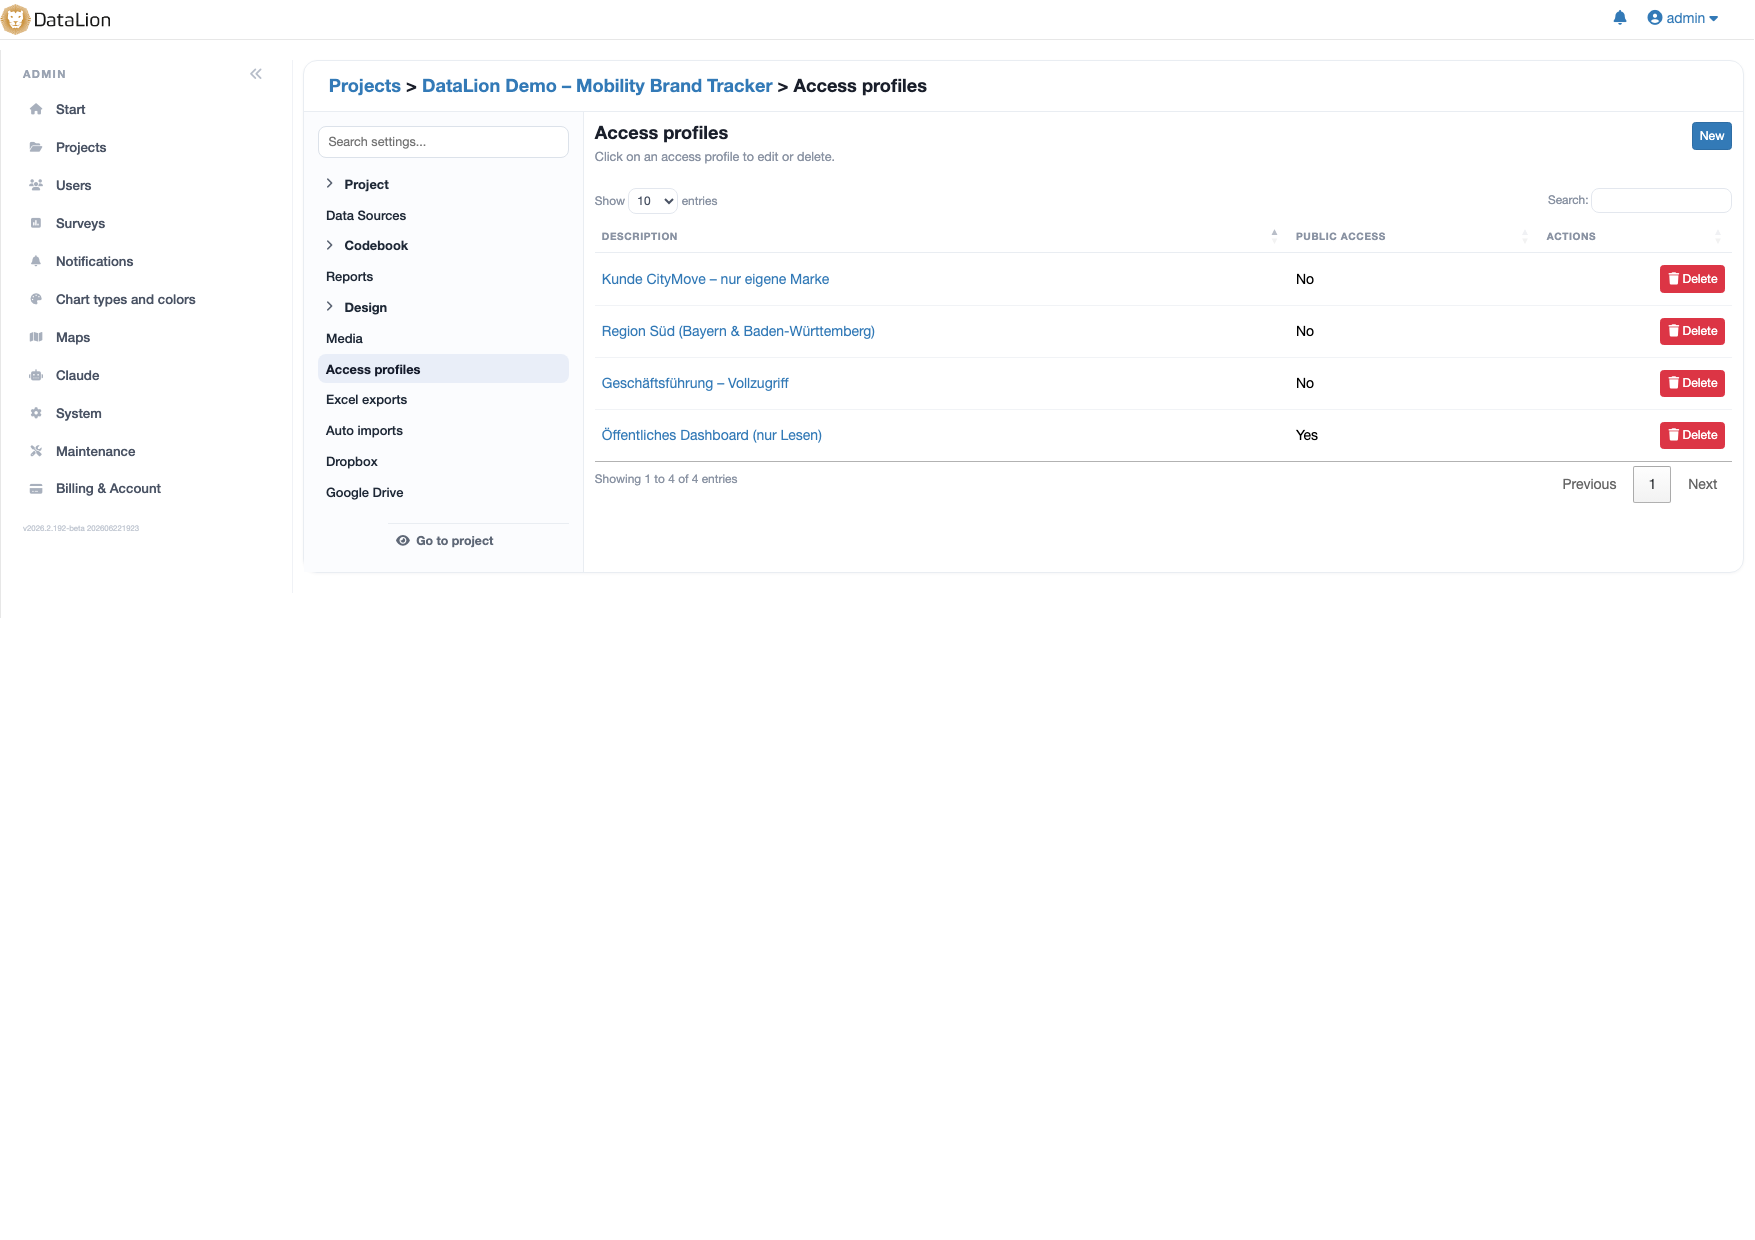
Access profiles give each level its dashboard: the outlet sees its scores next to the regional average, the regional manager their outlets, the country organisation its regions, and head office compares all countries with crosstabs and significance tests. The filter is enforced server-side; anyone not allowed to see a region never receives its data. For small outlets in the service feedback you set a minimum case count.
- One link per outlet, one dataset for the whole network
- Access profiles for outlet, region, country and head office
- Server-side enforced filters, not hidden charts
- Minimum case count protects small outlets from inference
Driver analysis tells you what re-signing depends on
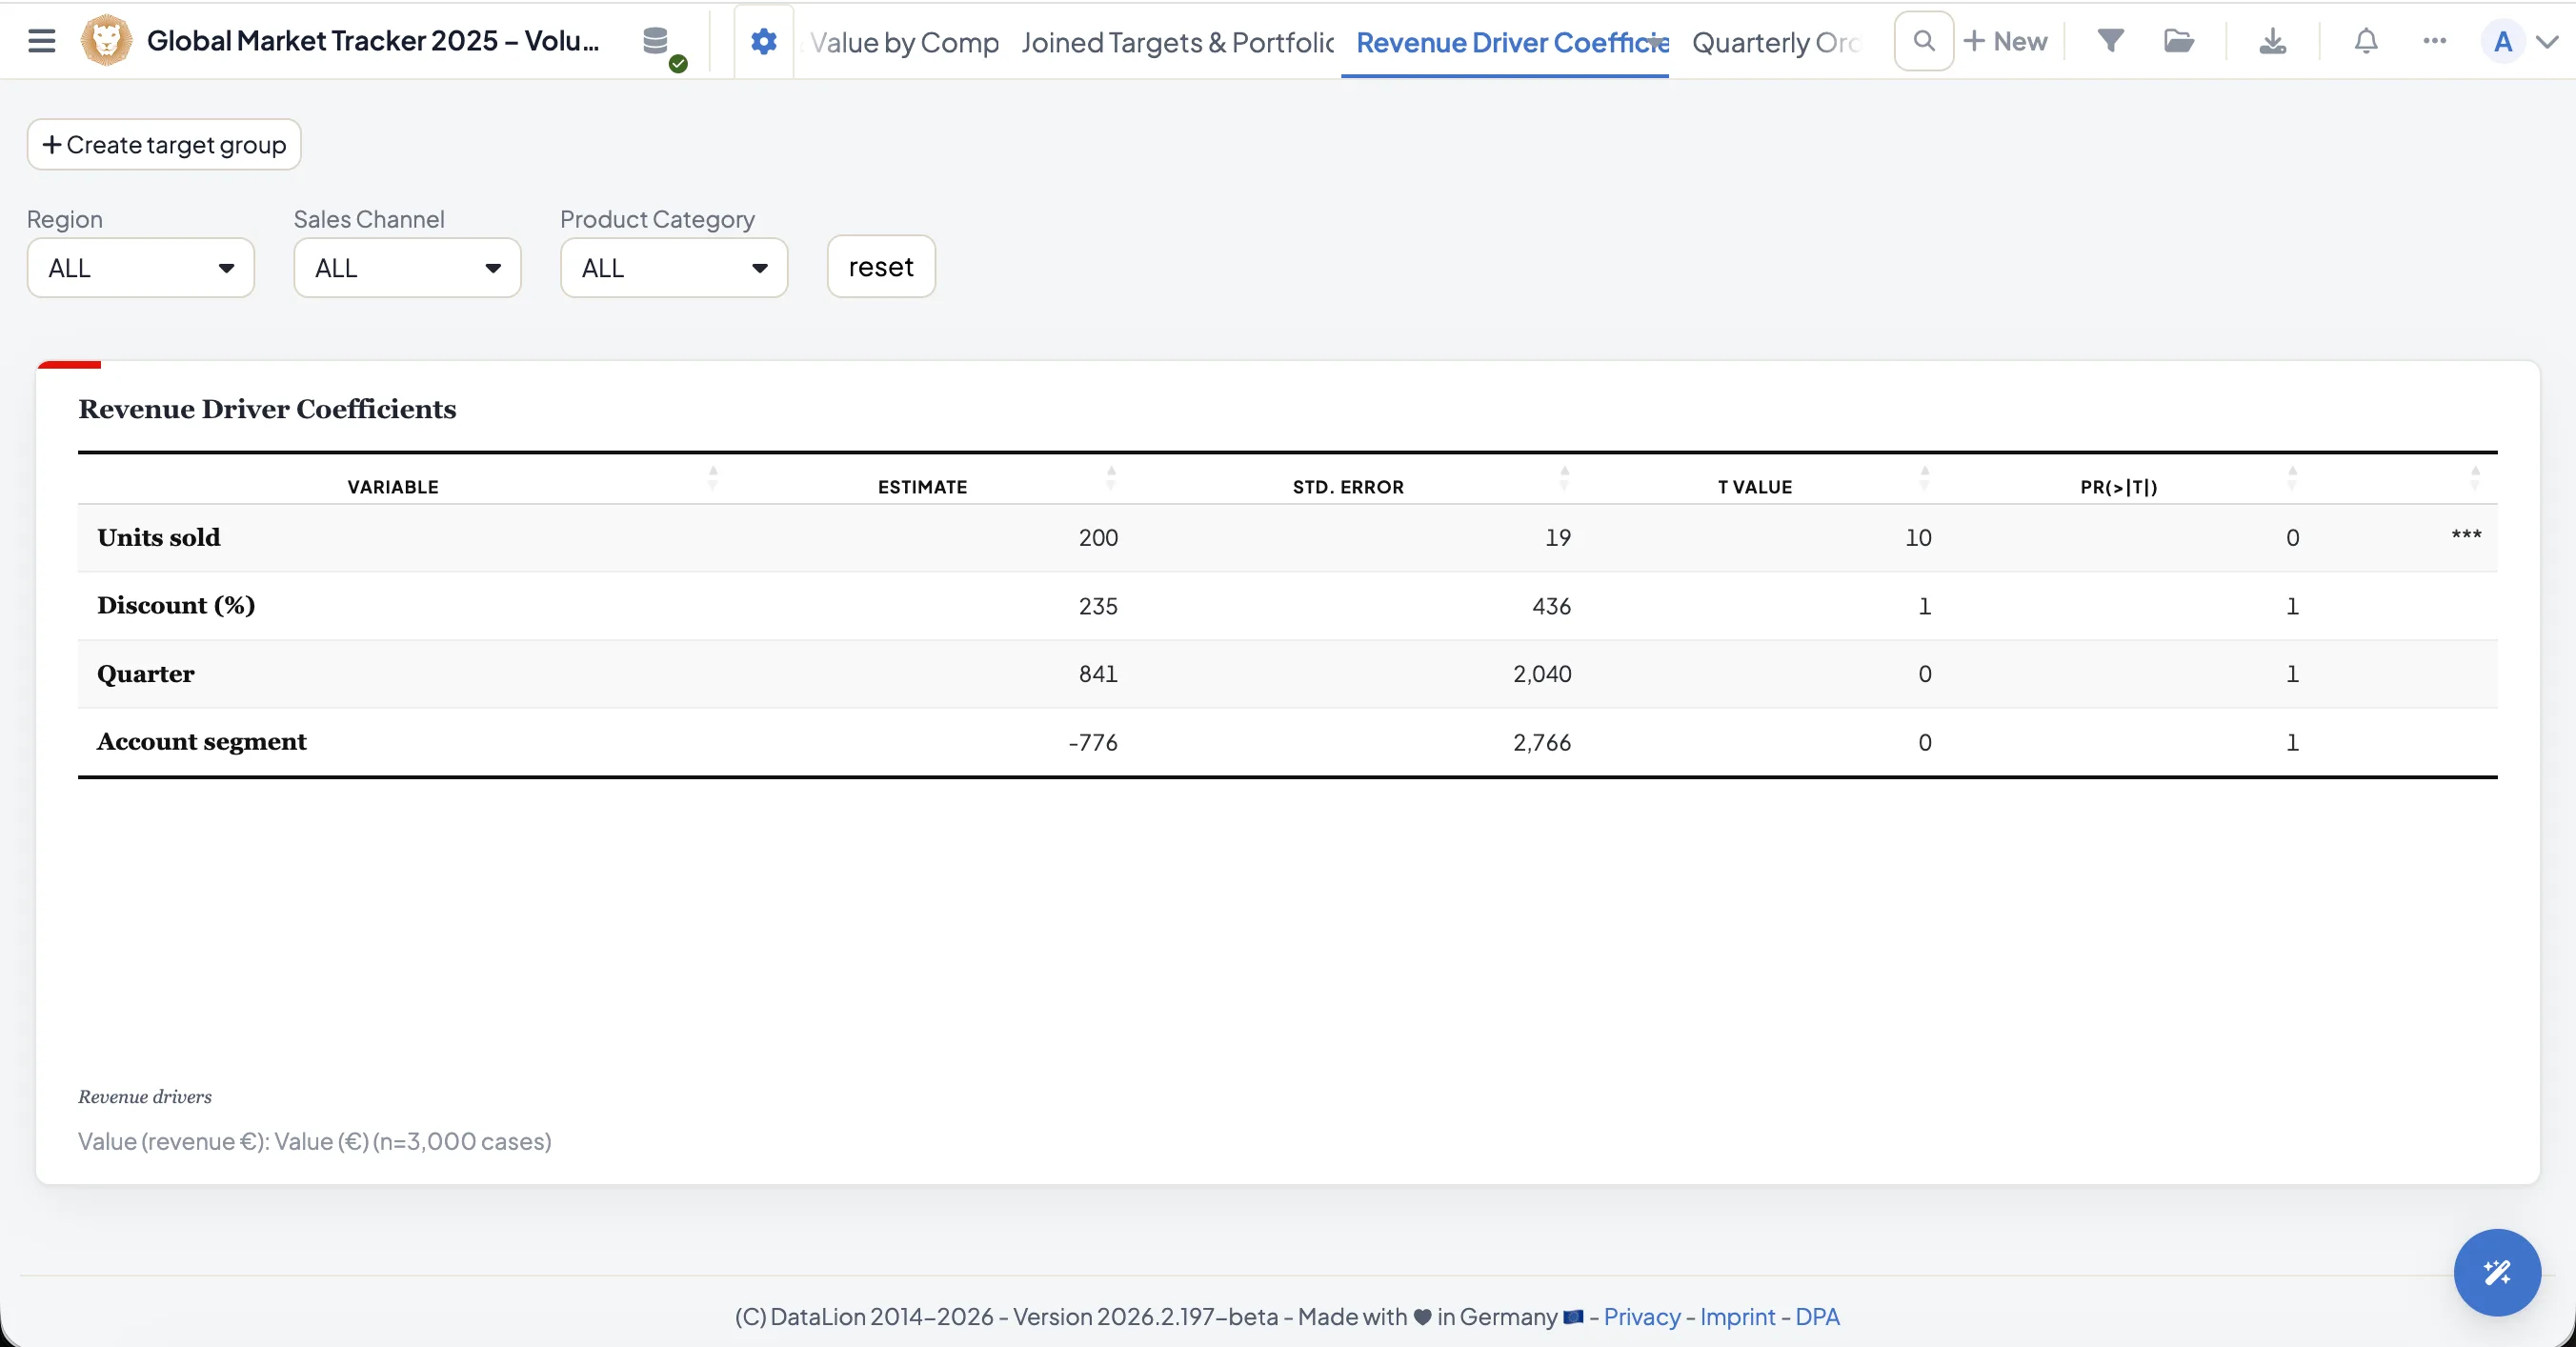
Eleven satisfaction aspects and one question on whether the dealer would sign the contract again: DataLion's driver analysis computes which aspects actually explain re-signing and places relative importance next to satisfaction. Often the field support nobody mentions explains more than the margin everyone talks about.
You set up the Dealer Satisfaction Index once as a computed metric; after that it is available per country, per region and per wave in every chart and export. The open answers are coded by AI for topic and sentiment, so 600 dealer comments become a ranking per region you can take into the dealer council.
- Driver analysis with relative importance per aspect
- DSI as a computed metric in every chart and export
- AI coding of dealer comments by topic and sentiment
- Wave comparison with significance tests
One questionnaire for twelve countries, with AI translation into the project
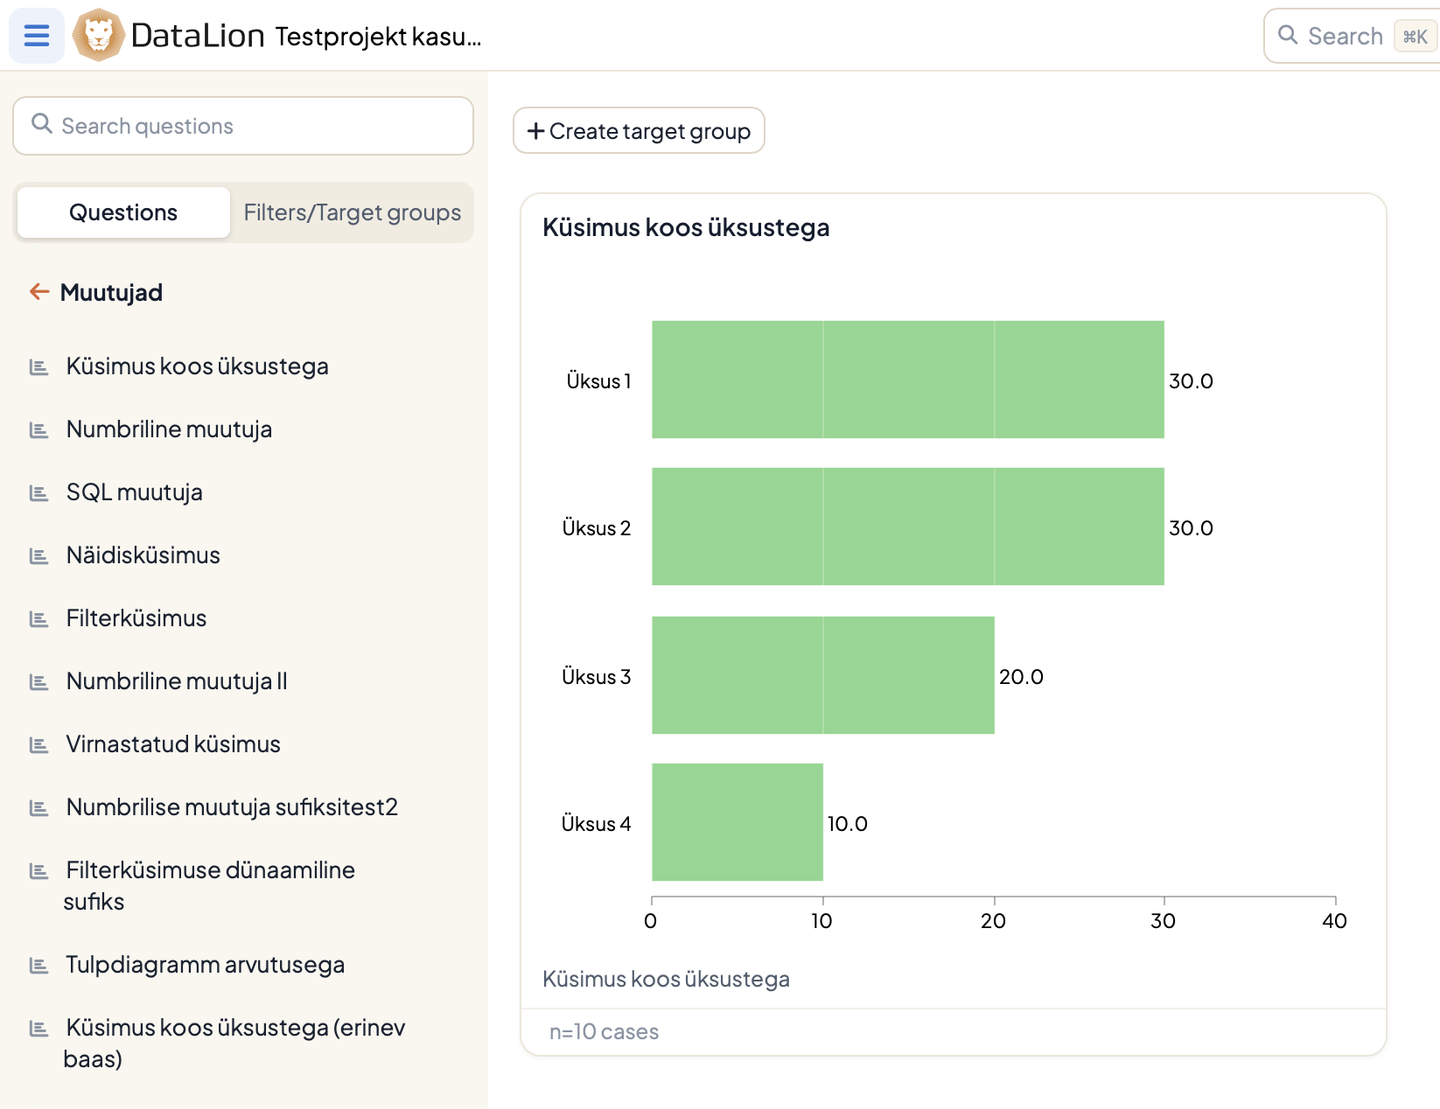
One questionnaire carries every language in the network. Under Survey settings → Languages you add, say, Polish, Czech and Swedish, then enter the translations in the survey editor. All languages share the same answer codes and one dataset, so the network comparison runs across all countries in one dashboard without merging files. Dealers see the questionnaire in the language set in the link, or else in their browser language, and can switch during the survey. Buttons and hints come pre-translated in six languages; for any other language you enter your own text, otherwise they appear in English.
For analysis, AI translation renders the whole project, codebook, charts and reports, into 65+ languages as an additional language layer. The country organisation in Poland sees the same dashboard as head office, only in Polish. Invitations from the fieldwork module can be set up per language and tested before sending.
- One questionnaire, 26 language presets plus custom codes
- Shared answer codes, one dataset for every country
- AI translation of the project into 65+ languages
- Localised invitations from the fieldwork module
End-customer workshop feedback as a continuous measurement per outlet
The second survey in the network is the one outlets are measured on: end-customer feedback after the workshop visit. The link goes on the invoice as a QR code or out as an invitation one or two days after the appointment from the outlet's contact list. The outlet parameter is the same as in the dealer survey, so both perspectives sit side by side in the network comparison.
The fixed-first-time rate and the Customer Satisfaction Index run as a weekly line per outlet. A drop shows up before it reaches the revenue figures. A callback request at the end of the questionnaire is optional and consent-based; via the access profile only the outlet concerned sees the contact details.
- QR code on the invoice or invitation from the fieldwork module
- The same outlet parameter as in the dealer survey
- CSI and fixed-first-time rate as a time series per outlet
- Callback request with consent, visible only to the outlet
The report per outlet is an export, not a project
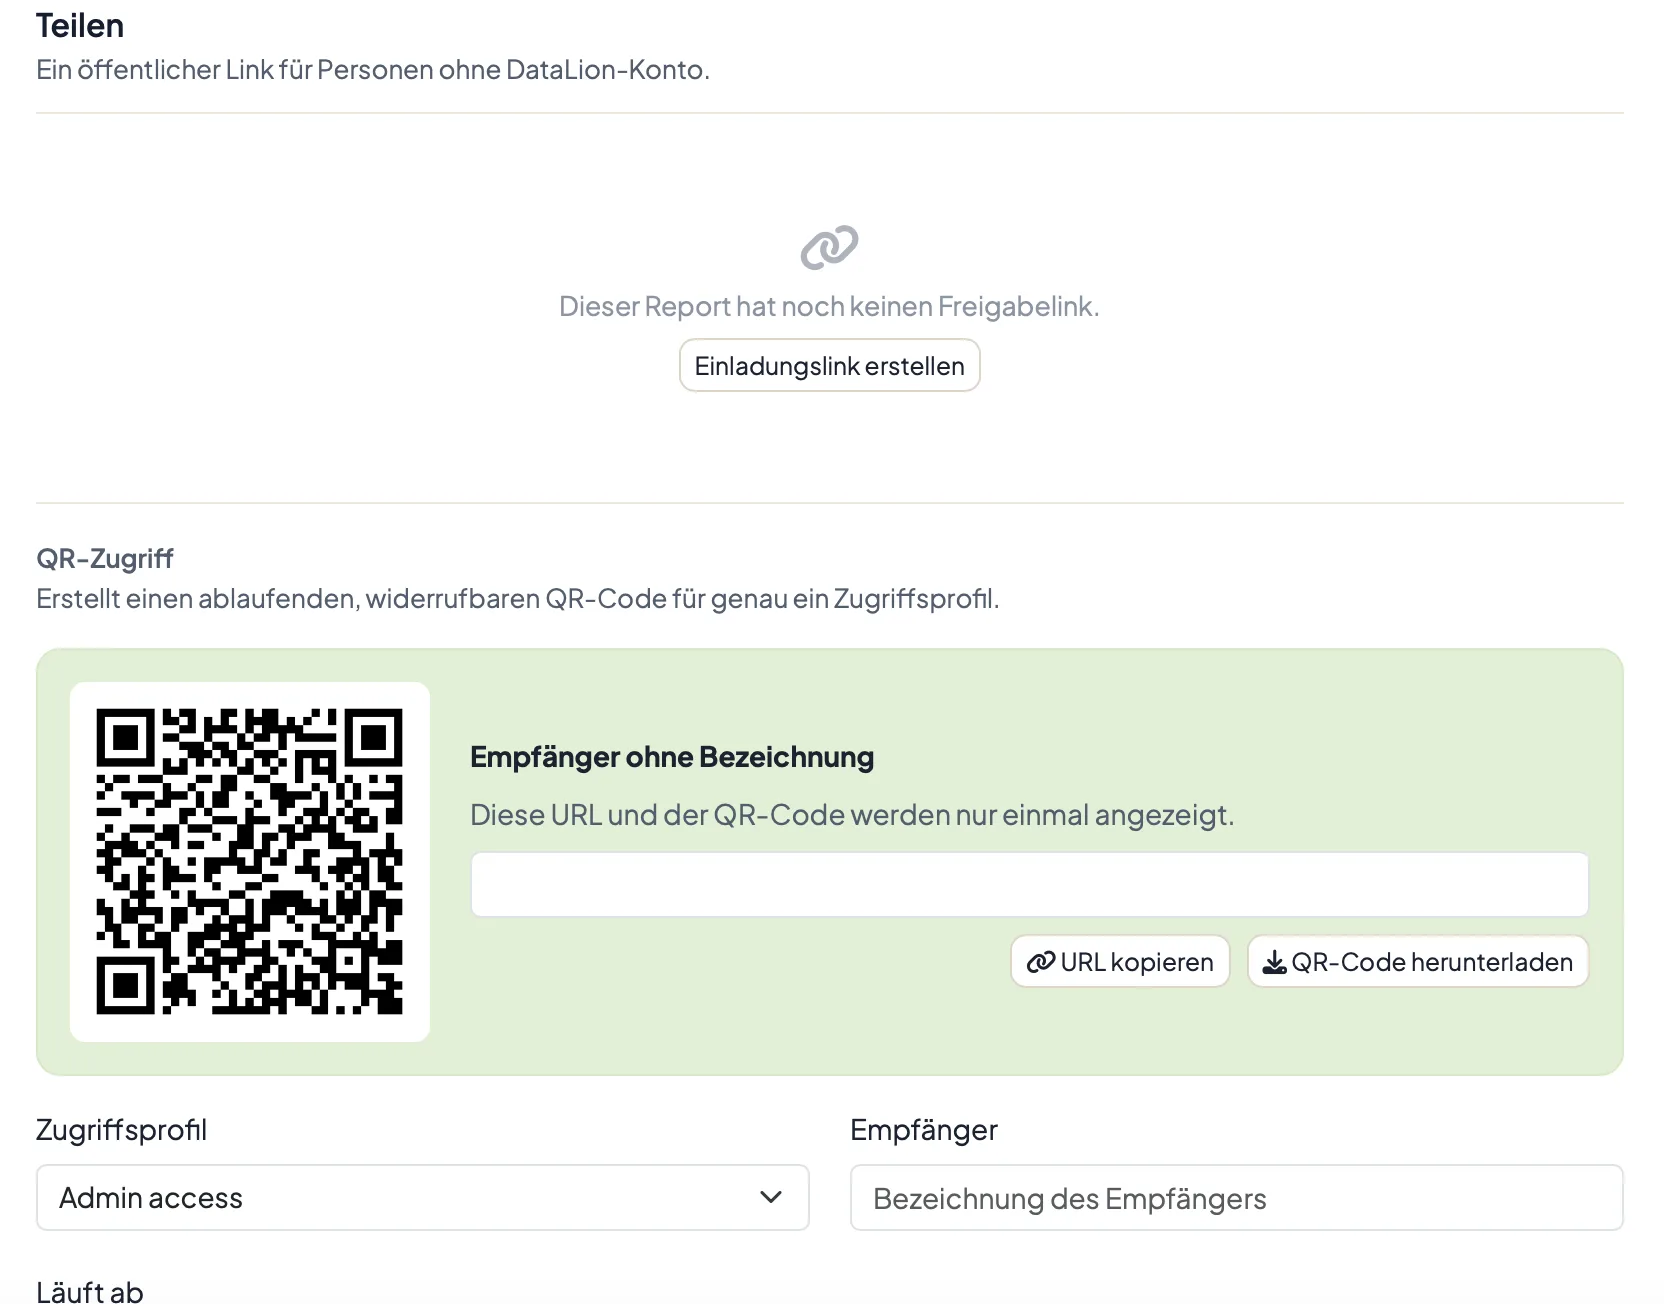
One click turns any dashboard into an editable PowerPoint file in the brand's layout, plus Excel tab books and PDF. The regional report becomes an export with a filter applied, and the 40 regional reports are 40 exports of the same dashboard. For the dealer council you share the dashboard as a link.
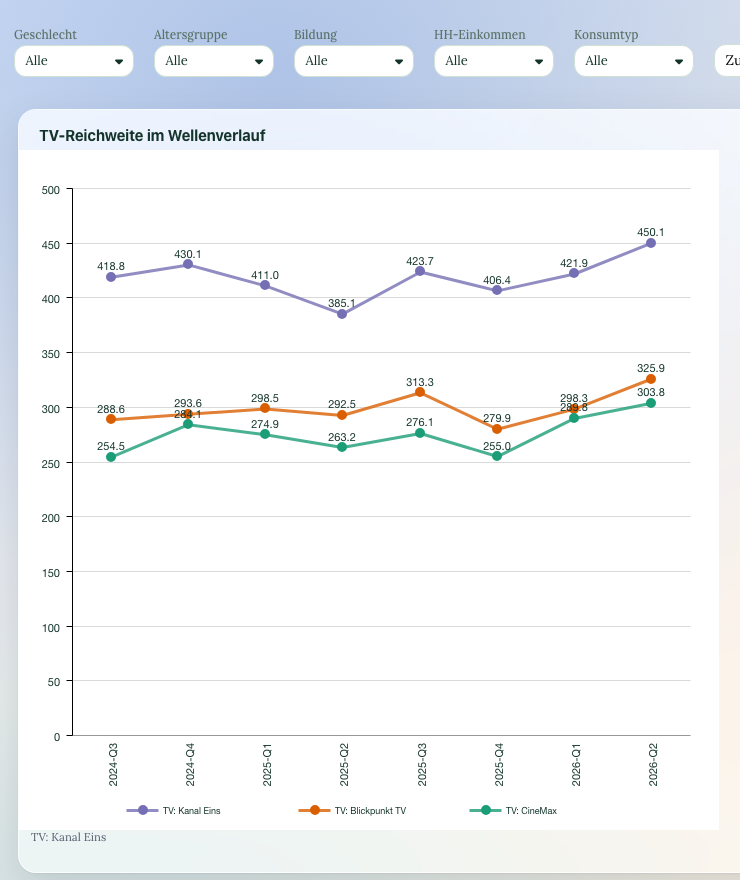
An outlet that should not have its own account gets a QR code that opens exactly one report through an access profile, with an expiry date and revocable. And because the template is kept, the next wave is built identically: same variables, direct comparison, with significance tests where it matters.
- Editable PowerPoint in the brand's layout, Excel tab books, PDF
- Regional reports as exports of the same dashboard
- QR access to exactly one report, time-limited and revocable
- Waves built identically and directly comparable
Four questionnaires for a sales network's survey calendar
-
Dealer satisfaction (DSI)
Eleven aspects of the partnership from model range to field support, plus profitability, re-signing and recommendation.
View template → -
After-sales service feedback (CSI)
The short survey after every workshop visit: seven service aspects, fixed first time, invoice, NPS and callback request.
View template → -
Seminar and training feedback
For dealer trainings and product courses: content, trainer, organisation and applicability in the business.
View template → -
Win-loss analysis
Why the customer bought from the competitor: the survey of lost quotes across the network.
View template →
Charts that fit
The analyses you actually need
DataLion ships over 40 chart types. For the dealer survey and the service feedback across the network, these three carry the work.
-
table
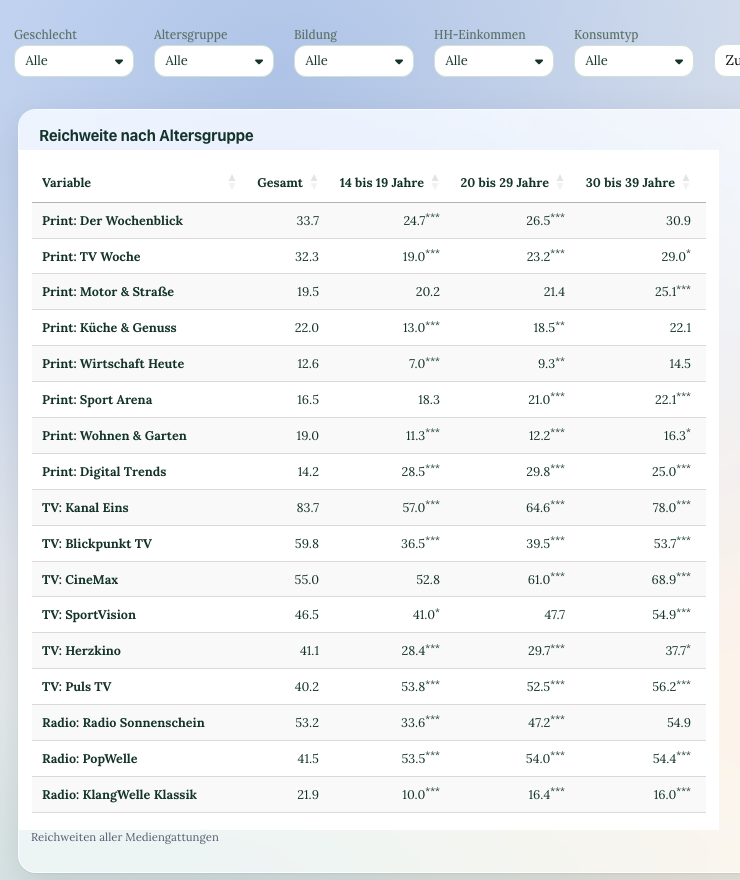
Crosstab with significance markers
The south region sits 0.4 points below the north on parts supply. Whether that means anything at 35 dealers per region is told by the stars in the table, before the regional manager has to justify it.
-
regression
Driver analysis and regression
Which of the eleven satisfaction aspects explain re-signing, with coefficients instead of gut feel. Often it is the field support nobody mentions, not the margin everyone talks about.
-
timeline
DSI and CSI across waves
The index as a time series per region or outlet. Whether the new bonus scheme changed anything is shown by the line in the following wave, not by the anecdote from the dealer council.
See DataLion with your own data
Start free with your own raw data. Or book a personal demo of the path to a finished dashboard.
What users say about DataLion
- via G2
The embedding function allows us to generate insights of our data for our audience and customers by far less than half of the usual time needed before.
Verified user · Leisure, Travel & Tourism - via G2
User-friendliness, especially for market research topics. Structured backend with many customization options.
Verified user · Market Research - via G2
The contacts at DataLion are very committed. If you have problems, you can count on help. DataLion reacts quickly to requests for new functions.
Robert Q. · Managing Director - via G2
Very professional company, attentive to the customer needs, provider of a great software and service.
Generoso M. · CRM Analyst, Automotive

We now work much more efficiently, giving us more time to take care of the derivations and insights from the data for the customers.
The relevant features in detail
Guides for sales networks
Questions manufacturers and importers ask
Can we bring the outlet numbers over from our dealer management system?
How anonymous is the dealer survey if we issue one link per outlet?
Does the outlet get a notification when a customer asks for a callback?
Can we link the dealer survey to our sales figures per outlet?
We currently survey through an agency. What goes away, what stays?
What does it cost for a network of 400 outlets in eight countries?
Analyse your next dealer survey down to the outlet
Create a workspace, start from the DSI template and see on the test dataset what the cascade of country, region and outlet looks like.