
Sector: associations, chambers & guilds
Business climate and member surveys without the Excel night shift
The business climate report is the product that puts your association in the press, and it is built in an Excel file only one person understands. DataLion keeps every wave in the same dataset, computes balance and climate as metrics and delivers the report as PowerPoint and as a dashboard members open themselves.
Free to start · no credit card · hosted in Germany
DataLion is a survey and analysis platform for trade associations, chambers and guilds: the business climate survey runs as a time series with balance and climate index as computed metrics, the member survey separates importance and satisfaction of services, and each section sees its dashboard pre-filtered. Invitations and reminders come from the fieldwork module, the report for board and press is a PowerPoint export. Anonymous, hosted in Germany.
- 🇩🇪 Made in Munich
- GDPR-compliant
- DPA included
- Hosted in Germany
- 🌐 Interface in EN, DE, FR, ES, IT & NL
Trusted by research institutes, brands & insights teams






- 50+ interactive chart types
- 20+ statistical methods
- SPSS · Excel · CSV import without data loss
- ISO 27001 certified data centers (Germany)
Where association surveys break down in practice
- The business climate survey is manual work: returns in Excel, balance by formula, time series in a file with 27 tabs. When the colleague is out, the report is out.
- The member survey arrives every three years as a PDF from an agency, and "how do firms under ten employees see this?" costs a new quote.
- The overall score smooths over the section that is dissatisfied and considering leaving. You notice it on the fee invoice, a year later.
- Members get a press release and a slide deck. A business climate report they can filter by their own sector would be a reason to stay a member.
Every wave in the same dataset, the balance as a metric
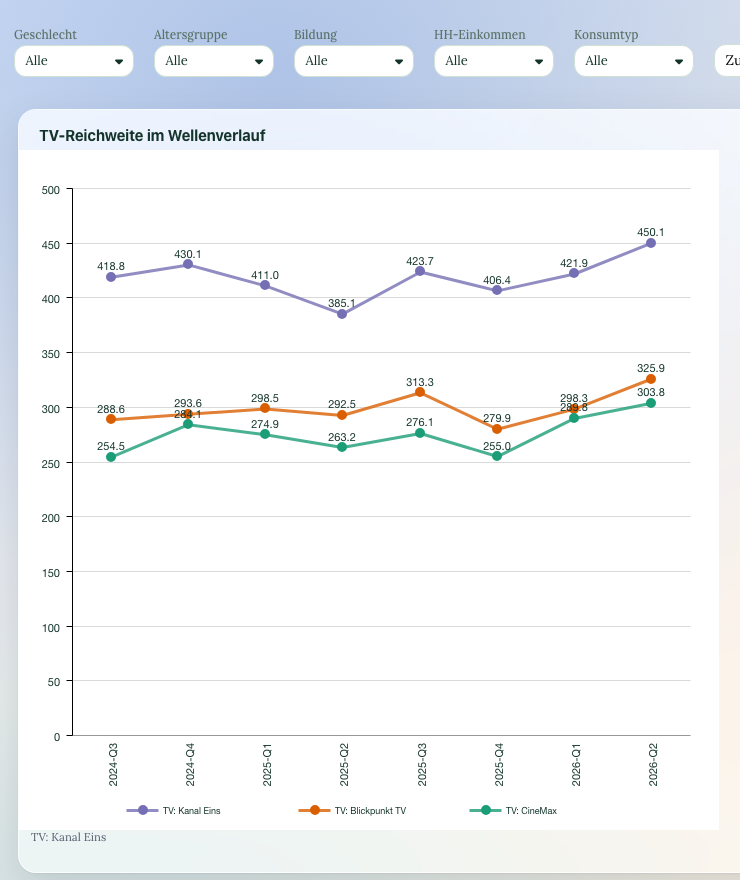
The business climate survey lives on its time series, and the time series dies when every wave is a new project. In DataLion the questionnaire stays as a template, every wave is appended to the same dataset, and the wave field turns the time series per sector into a chart instead of a chore. You set up balance and climate index once as computed metrics; after that they are available in every wave, every sector and every export.
If the member structure by sector and company size is known, you weight the returns to it. Then the balance is no longer a mood picture of the keen responders but a figure you can stand behind in a press release. The special question on the current topic is appended per wave without touching the skeleton.
- Waves in one dataset, time series per sector as a chart
- Balance and climate index as computed metrics
- Weighting to the member structure
- Special questions per wave without breaking the time series
Importance and satisfaction separated, so the action list becomes visible
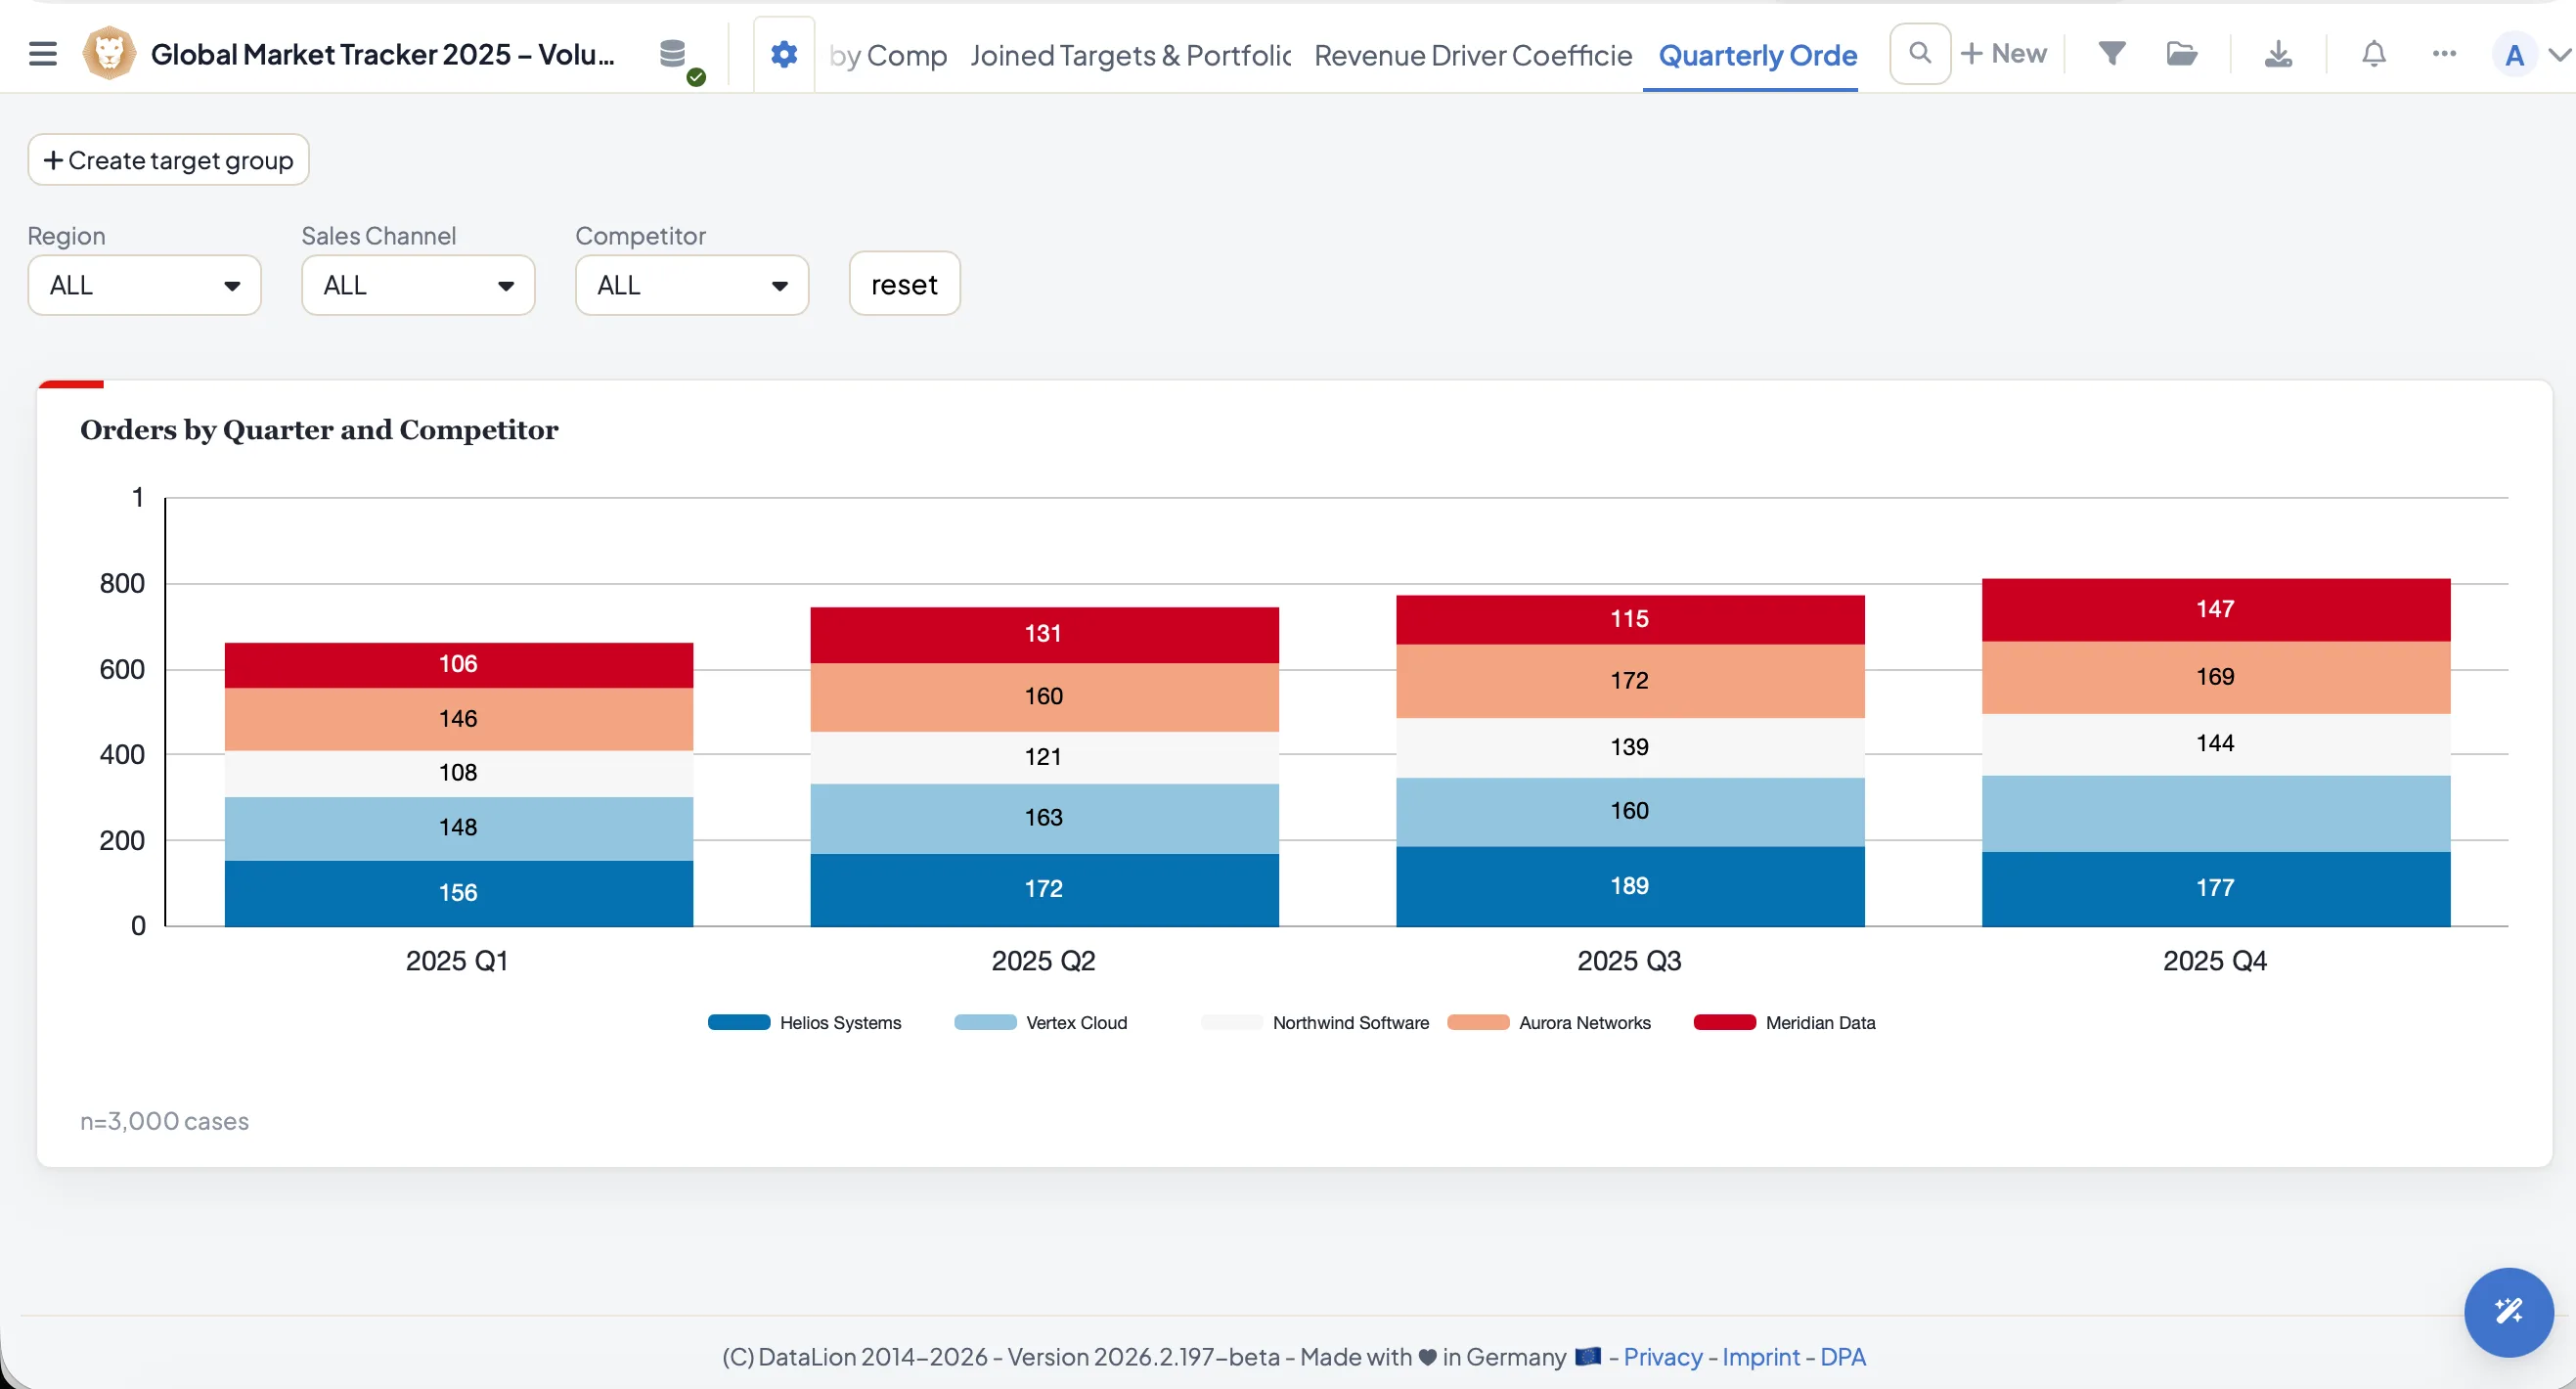
A satisfaction matrix alone tells the executive that the member magazine scores 3.4. Only the importance next to it says whether that is a problem. The member survey template asks both; in the dashboard the services sit as dots in a scatter plot, and bottom right is the list for the strategy retreat: important, but rated poorly.
The questions on advocacy, intention to cancel and recommendation are the board's early-warning system. Filtered to the members who have considered cancelling, the topic list shows what this group expects from the association. The open question at the end is coded by AI for topic and sentiment; 800 comments become a ranking per section.
- Service portfolio as a scatter plot of importance and satisfaction
- Intention to cancel and NPS as an early-warning system
- AI coding of open comments by topic and sentiment
- Crosstabs by company size and membership tenure
Each section sees its sector, head office sees everything
Append a parameter per section or regional office to the survey link, for example ?section=construction. The value is stored as a variable, the answer stays anonymous, and the association's regional structure becomes an analysis dimension without asking which firm it is. For small sections you set a minimum case count below which nothing is shown.
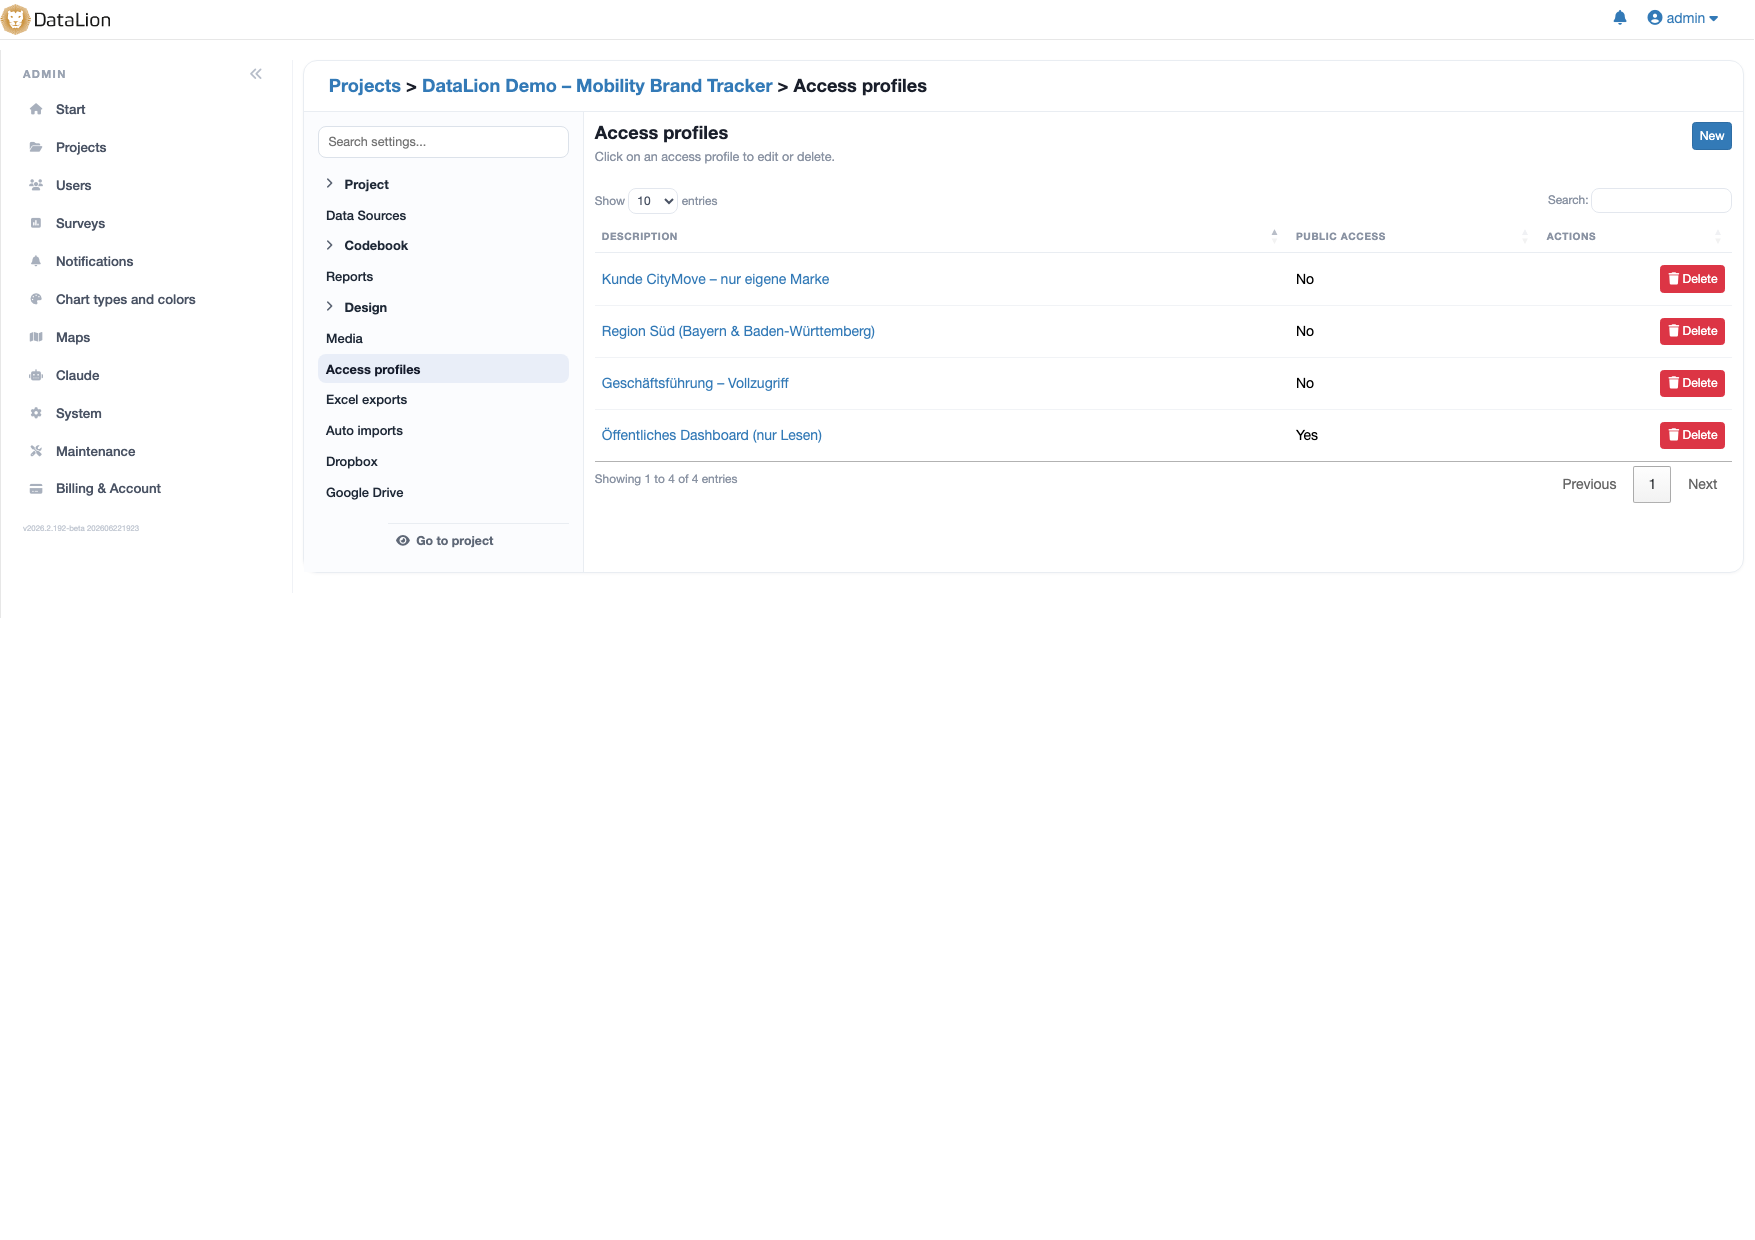
Access profiles give each section head a dashboard fixed to their own sector with the total next to it. For members you share the business climate report as a link they open without a login and filter by their sector. That is the report they never got from the agency.
- One link per section, one shared dataset
- Access profiles with a hard-wired sector filter
- Shared dashboard link for members, no login
- Minimum case count protects small sections
Invitations and reminders from the fieldwork module, not from a mail merge
The response rate of an association survey depends on the reminder. In DataLion's fieldwork module you upload the contact list, send the invitation in the association's layout, schedule the reminder and watch the delivery status. Opt-outs are respected, duplicates detected. The answers themselves stay anonymous and are not linked to the contact list.
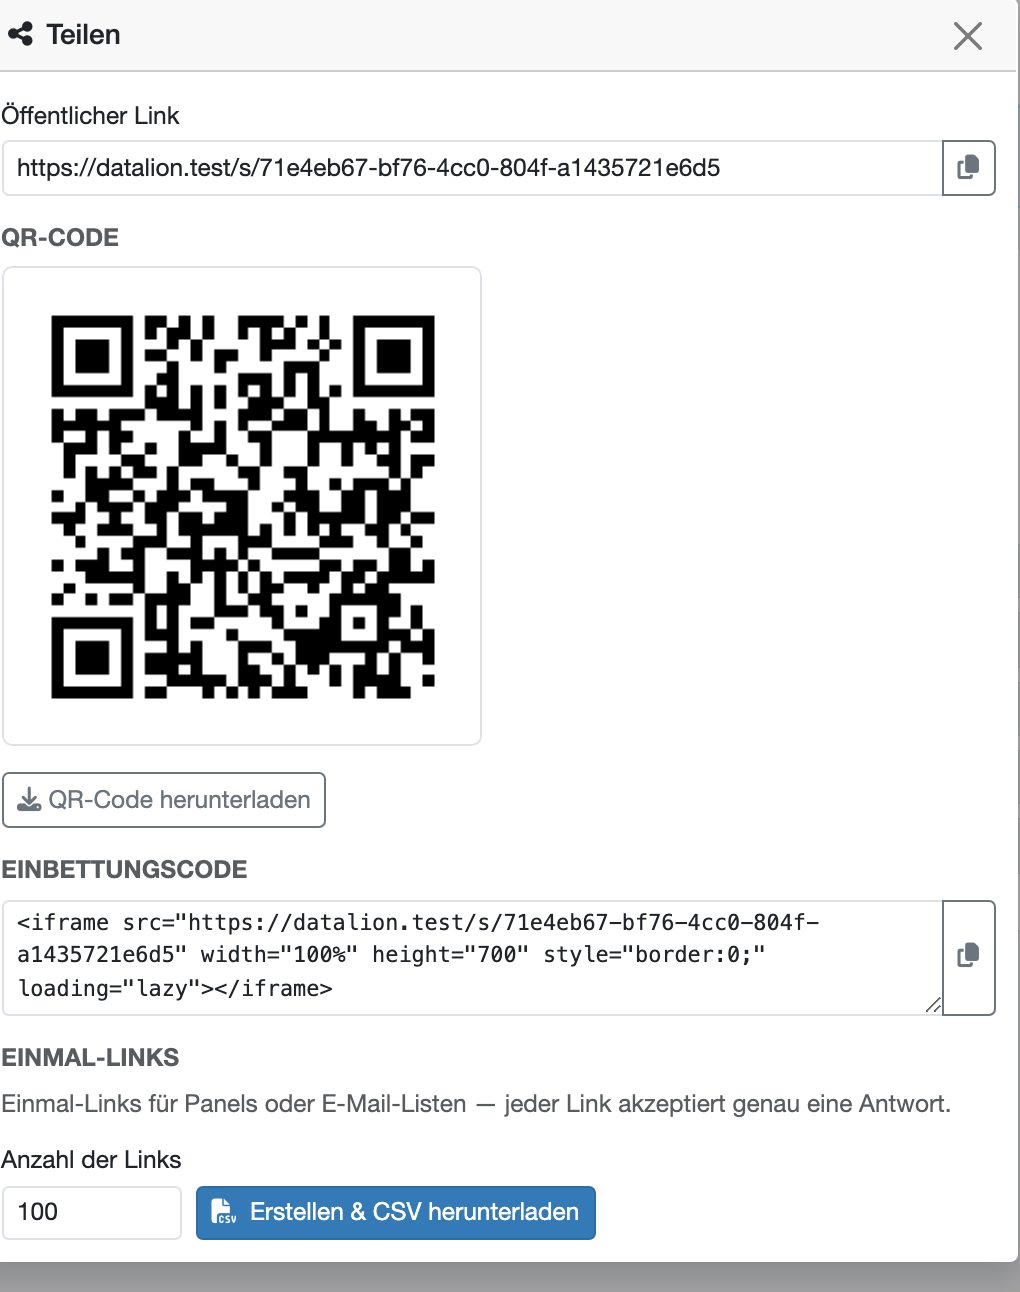
If you prefer to work without a contact list, use the public link with a QR code in the newsletter or the member magazine. Both can be combined, for example email invitations to full members and a QR code for supporting members, and land in the same dataset.
- Contact lists, invitations, reminders and opt-outs in DataLion
- Delivery status per invitation
- Invitations in the association's layout
- Public link and QR code as a supplement
From dashboard to press conference and general meeting
One click turns any dashboard into an editable PowerPoint file in the association's layout, plus Excel tab books and PDF. The business climate report for the press becomes an export, and the journalist's follow-up on construction becomes a filter click. For the general meeting you share the dashboard as a link.
Because the business climate survey, the member survey and the event feedback run on the same platform, the end of the year gives the executive a picture of the association it otherwise pieces together from three tools.
- Editable PowerPoint in your own layout, Excel tab books, PDF
- Share dashboards as a link, no account needed to view
- Every survey of the association on one platform
Four questionnaires for an association's survey calendar
-
Business climate survey
Situation, expectations, orders, investment, employment and risks in the proven question set, as a time series per sector with balance.
View template → -
Association member survey
Satisfaction with and importance of services, advocacy, topic wishes, channels, NPS and intention to cancel.
View template → -
Club member survey
For clubs and volunteer-run organisations: identification, programme, willingness to get involved.
View template → -
Event feedback
The survey after the annual conference or industry meet-up: programme, organisation, networking and returning.
View template →
Charts that fit
The analyses you actually need
DataLion ships over 40 chart types. For business climate and member surveys, these three carry the work.
-
timeline
Time series across survey waves
Balance, situation and expectations as lines across all waves, filterable by sector. The chart that goes into the press release, and the one the 27-tab Excel file never produced cleanly.
-
polarity
Polarity profile of services
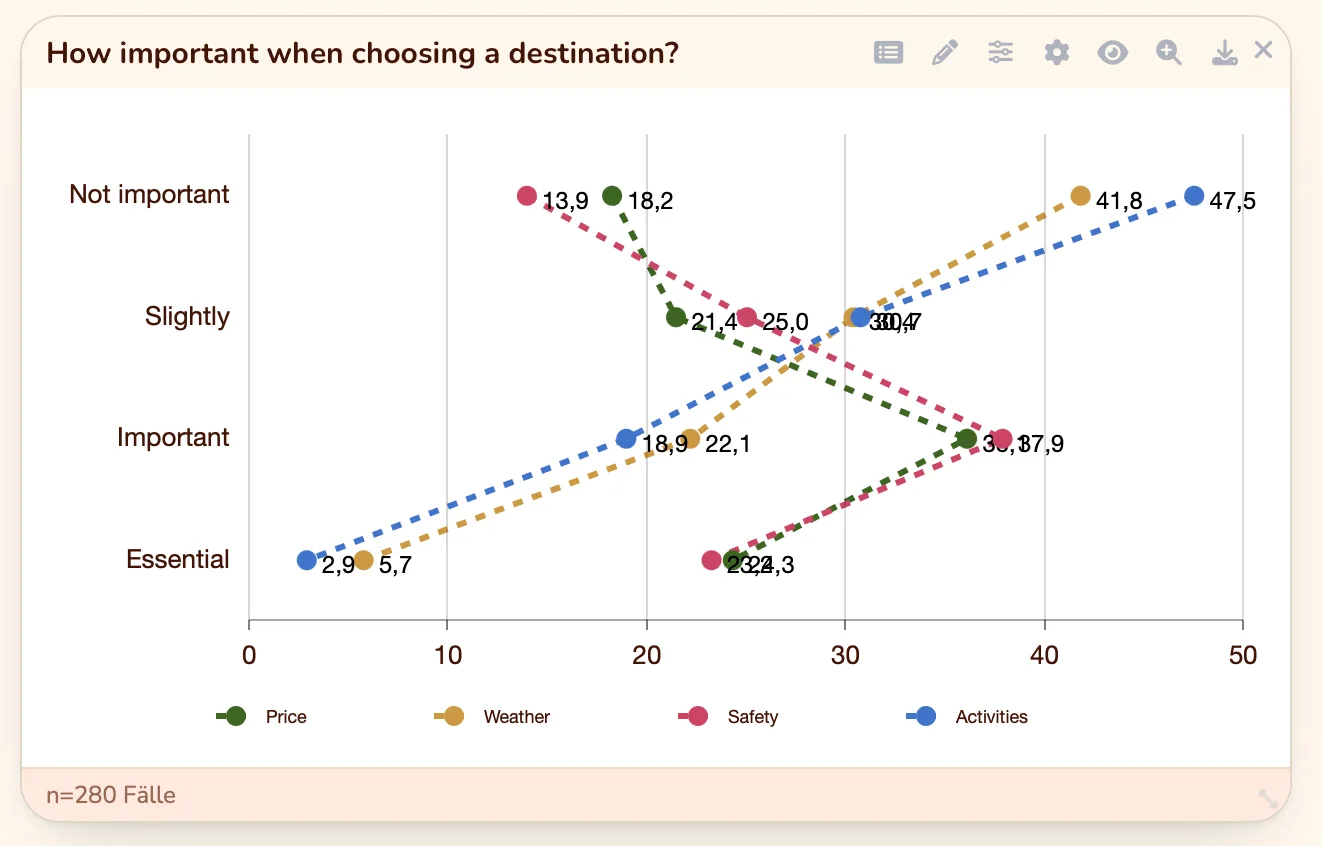
The association's services as a profile across the importance scale, with satisfaction as a second line. Where the two lines diverge is the action list the strategy retreat should discuss.
-
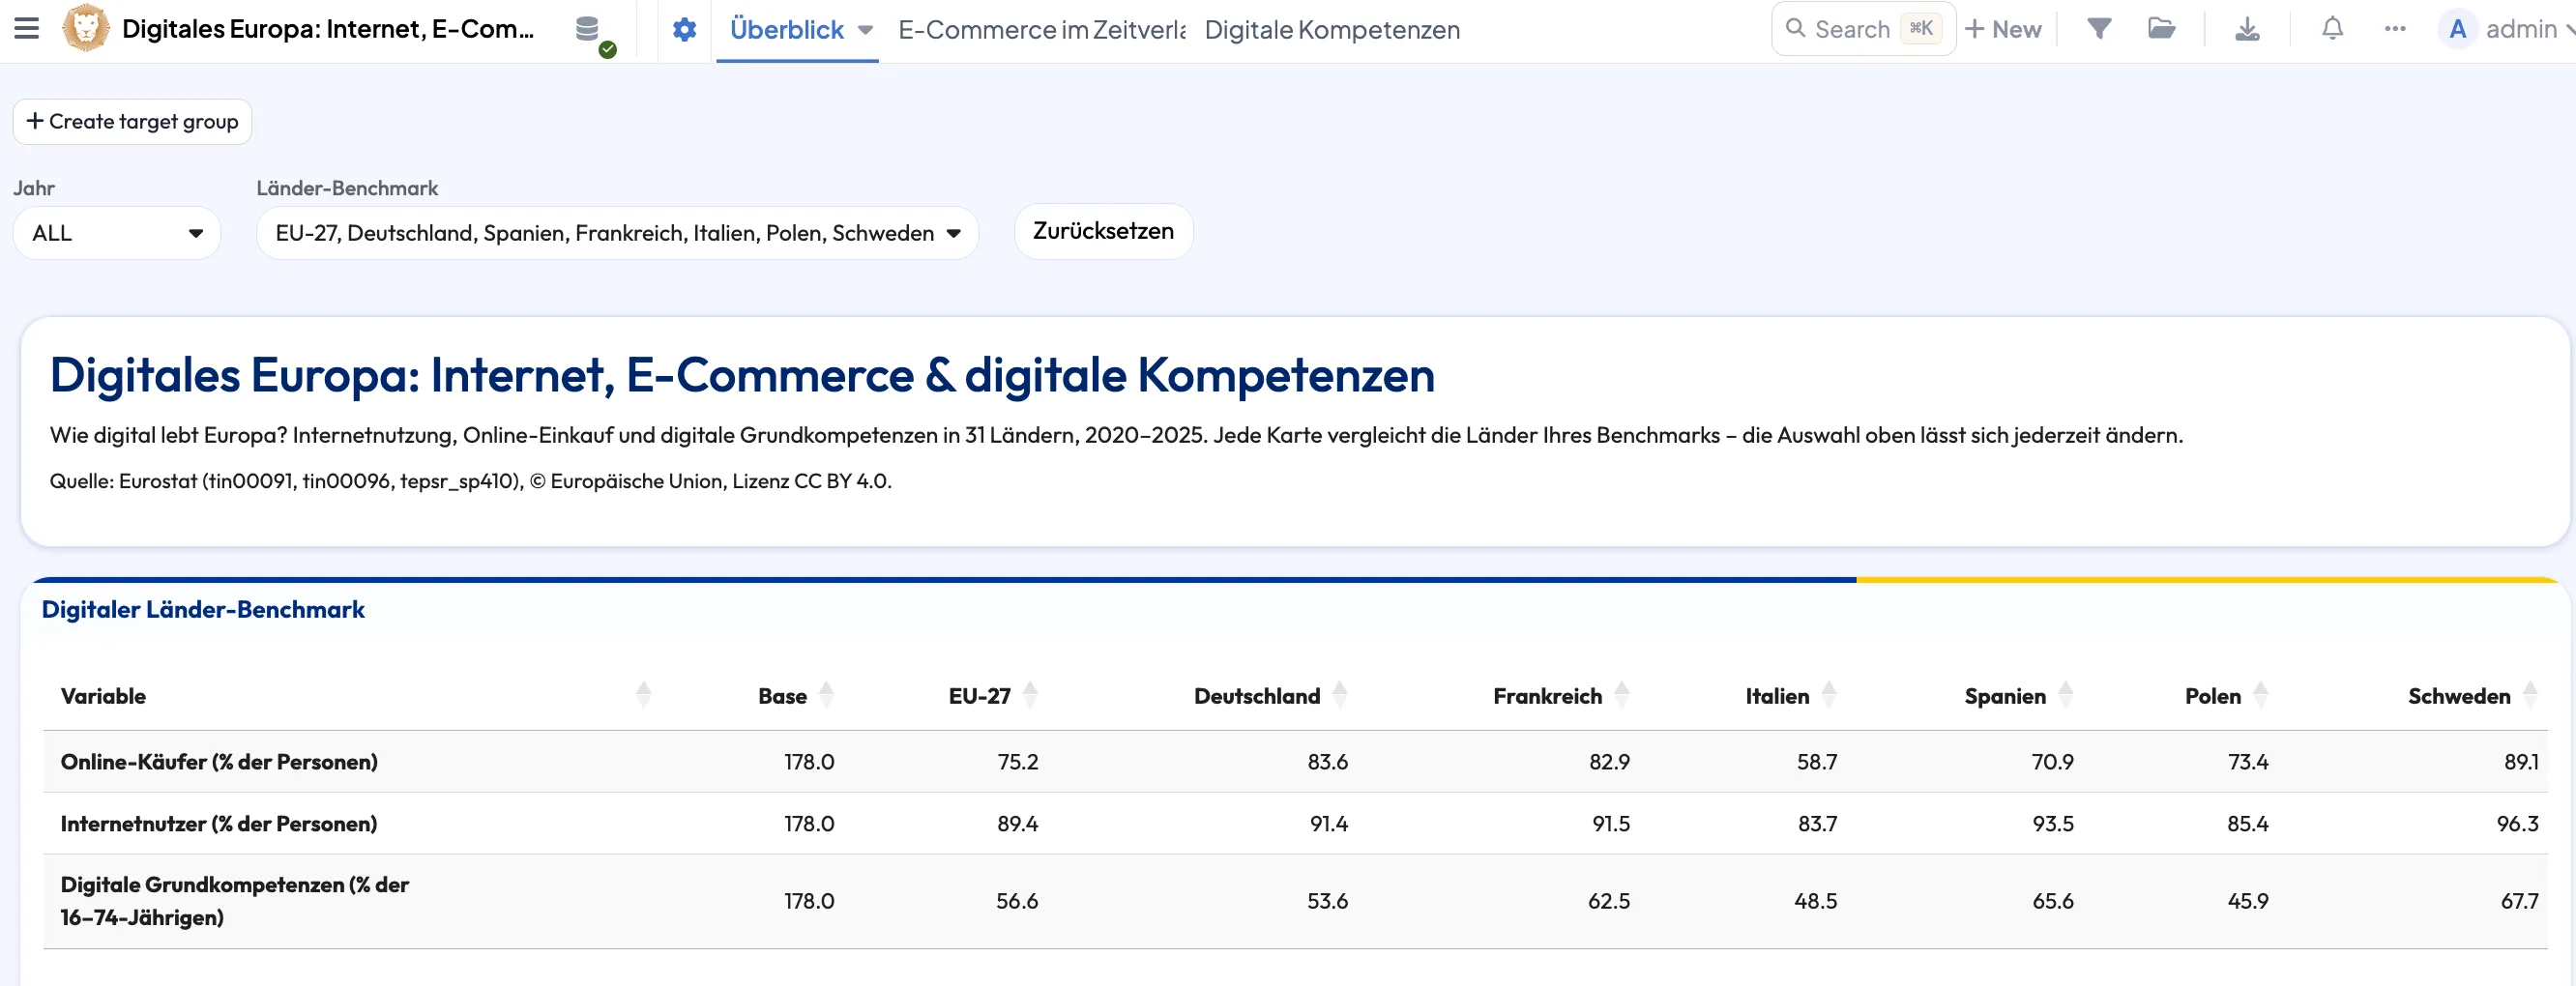
table
Benchmark table per section
The total and the sections as columns side by side, chosen with a benchmark filter. The table every section head uses to see whether their sector sits above or below the association.
See DataLion with your own data
Start free with your own raw data. Or book a personal demo of the path to a finished dashboard.
What users say about DataLion
- via G2
The embedding function allows us to generate insights of our data for our audience and customers by far less than half of the usual time needed before.
Verified user · Leisure, Travel & Tourism - via G2
User-friendliness, especially for market research topics. Structured backend with many customization options.
Verified user · Market Research - via G2
The contacts at DataLion are very committed. If you have problems, you can count on help. DataLion reacts quickly to requests for new functions.
Robert Q. · Managing Director - via G2
Very professional company, attentive to the customer needs, provider of a great software and service.
Generoso M. · CRM Analyst, Automotive

We now work much more efficiently, giving us more time to take care of the derivations and insights from the data for the customers.
The relevant features in detail
Guides for associations & chambers
Questions associations and chambers ask
Can we bring our old business climate surveys from Excel into the time series?
How do we stop a member from answering more than once?
Is the survey representative of our members?
Can members filter the business climate report by their own sector?
We have a membership management system. Is there an integration?
What does it cost for an association with 3,000 members?
Set up your next business climate survey as a time series
Create a workspace, start from the business climate survey template and see on the test dataset what balance and time series per sector look like.