Analysis & statistics
Timelines that show the trend — not the noise
Visualize trends as timelines and smooth them with SMA or EMA — with a freely chosen window. Projections and moving sums separate the real trend from sampling noise. No export.
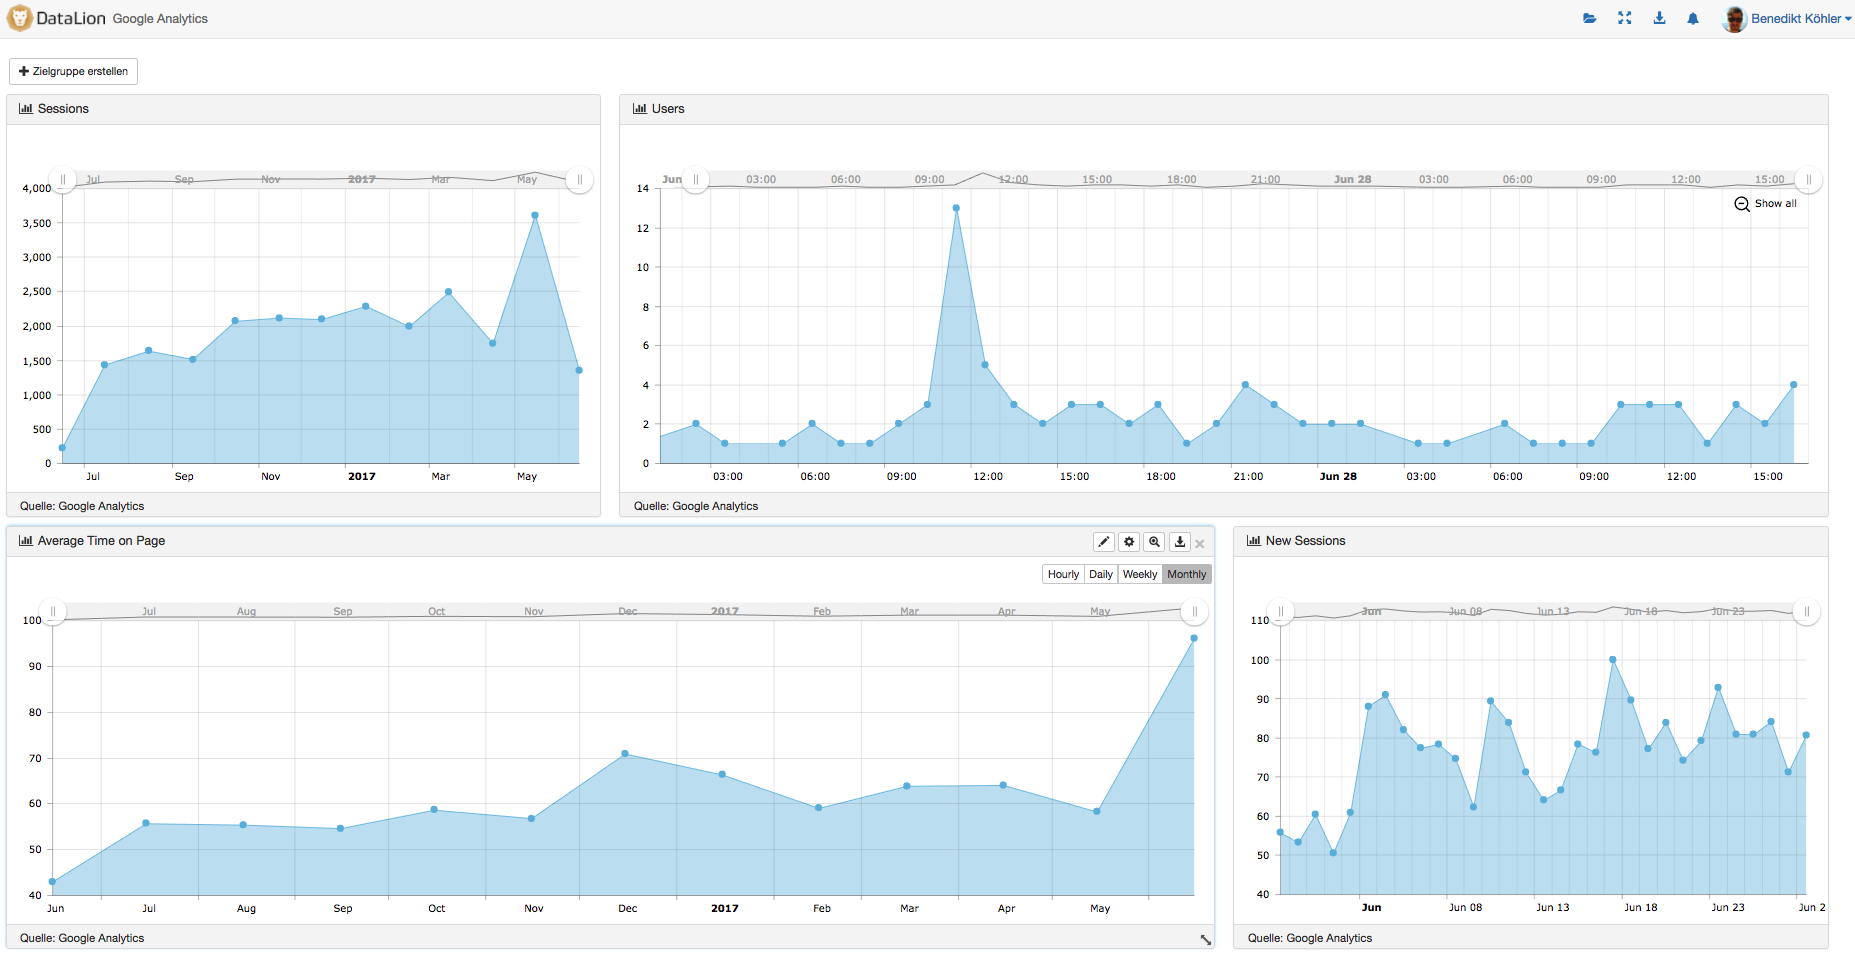
DataLion shows trends as timelines and smooths them with a moving average (SMA) or an exponentially weighted average (EMA) — with a freely chosen window. Projections add the weighted moving average (WMA), and moving sums separate trend from noise. All right in the tool, with no export.
- 🇩🇪 Made in Munich
- GDPR-compliant
- DPA included
- Hosted in Germany
- 🌐 Interface in EN, DE, FR & NL
Trusted by research, insights & media teams
- 50+ interactive chart types
- 20+ statistical methods
- SPSS · Excel · CSV import without data loss
- ISO 27001 certified data centers (Germany)
Smoothing via SMA and EMA
Sampling fluctuations make every wave value jitter. DataLion smooths timelines with a moving average (SMA) or an exponentially weighted average (EMA), which weights more recent waves more heavily — turning noise into a clear trend.
You choose the smoothing window freely: a short window stays close to the raw values, a longer one emphasizes the long-term trend.
- SMA: moving average across several waves
- EMA: more recent waves weighted more heavily
- Freely chosen smoothing window
- From the short-term signal to the long-term trend
Projections and moving sums
For projections, DataLion adds the weighted moving average (WMA) alongside SMA and EMA. Moving sums aggregate values over a rolling window — ideal for smoothing short-term spikes and surfacing cumulative effects.
In tracking studies this lets you separate the real trend, seasonal patterns and individual outliers cleanly.
- Projection with an additional WMA
- Moving sums over a rolling window
- Surface cumulative effects
- Separate trend, season and outliers
Wave after wave, updated automatically
Timelines are the backbone of tracking studies: new waves are imported, the tracker dashboard updates, and the smoothed line keeps growing on its own.
Wave-over-wave change can also be significance-tested — so you know whether a rise is real or lies within the noise.
- New waves automatically in the timeline
- Tracker dashboards update themselves
- Wave-over-wave change significance-tested
- Consistent definitions across all waves
See DataLion with your own data
Start a free trial or book a personal demo — from raw data to a finished dashboard.
What users say about DataLion
- via G2
Very professional company, attentive to the customer needs, provider of a great software and service.
Generoso M. · CRM Analyst, Automotive - via G2
The contacts at DataLion are very committed. If you have problems, you can count on help. DataLion reacts quickly to requests for new functions.
Robert Q. · Managing Director - via G2
User-friendliness, especially for market research topics. Structured backend with many customization options.
Verified user · Market Research - via G2
The embedding function allows us to generate insights of our data for our audience and customers by far less than half of the usual time needed before.
Verified user · Leisure, Travel & Tourism

We now work much more efficiently, giving us more time to take care of the derivations and insights from the data for the customers.
More analysis features
Common questions about time series
How does DataLion smooth timelines?
Does DataLion support projections?
What is the difference between SMA and EMA?
Do timelines update automatically in tracking?
Do I need to export data?
Get your trend on track
Try DataLion free: smoothed timelines, projections and moving sums right in the tool — with no export. Or book a personal demo.