
Use case: customer satisfaction
Measure customer satisfaction — and finally see what drives it
From questionnaire to driver in one platform: CSAT comes out as a top-box score with no recoding. Driver analysis shows which factors explain satisfaction, and open ends are coded by AI. ISO 27001-certified hosting, GDPR-compliant, made in Munich.
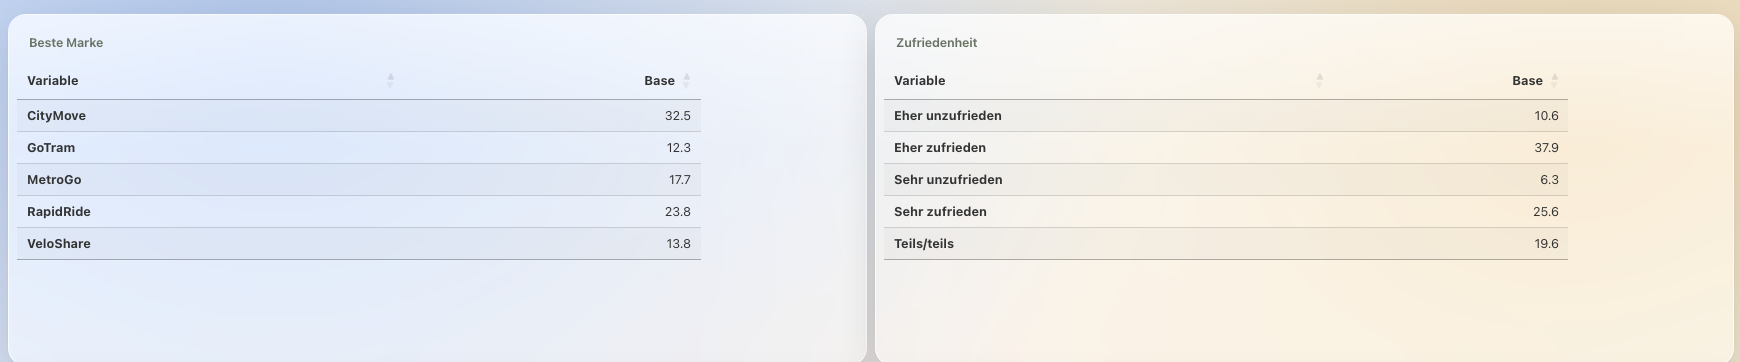
DataLion measures and analyzes customer satisfaction in one platform. CSAT comes out as a top-box score: for every scale question, top box, top-2 and top-3 as well as the bottom boxes are available automatically, and one click picks the right one. Relative-importance analysis on the R engine shows which factors explain satisfaction, and open-ended answers are coded by AI for sentiment and topic.
- 🇩🇪 Made in Munich
- GDPR-compliant
- DPA included
- Hosted in Germany
- 🌐 Interface in EN, DE, FR, ES, IT & NL
Trusted by research institutes, brands & insights teams






- Top box CSAT with no recoding
- 6 boxes top-1/2/3 and bottom per scale question
- 80–99% significance levels
- Relative importance driver analysis on R
Why satisfaction studies rarely change anything
- The overall score gets reported, but nobody knows which sub-satisfaction is pulling it up.
- At best one person skims the open ends — and never codes them.
- Locations get ranked against each other without checking whether the gap is significant at all.
CSAT comes out as a top box — with no recoding
The customer satisfaction score is a top-box figure at heart: the share of people picking the highest scale points. In DataLion you do not have to build that row. For every scale question, top box, top-2 and top-3 plus the matching bottom boxes are available automatically — one click decides which one appears in the table.
That also defuses the definition debate: whether your CSAT is the top-2 of a five-point scale or the top-3 of a ten-point scale is a switch in the chart, not a new variable. With no explicit choice, DataLion reports the top-2 box. If your scale runs the other way — 1 being the best value — flip the scale direction for the project, and the top box still means the positive end.
- Top box, top-2, top-3 and bottom boxes available automatically per scale question
- Switch the CSAT definition with a click instead of creating new variables
- Scale direction is a project setting — the top box stays the positive end
- Weighted shares against your target frame, missing values excluded by definition
Driver analysis, not an overall grade
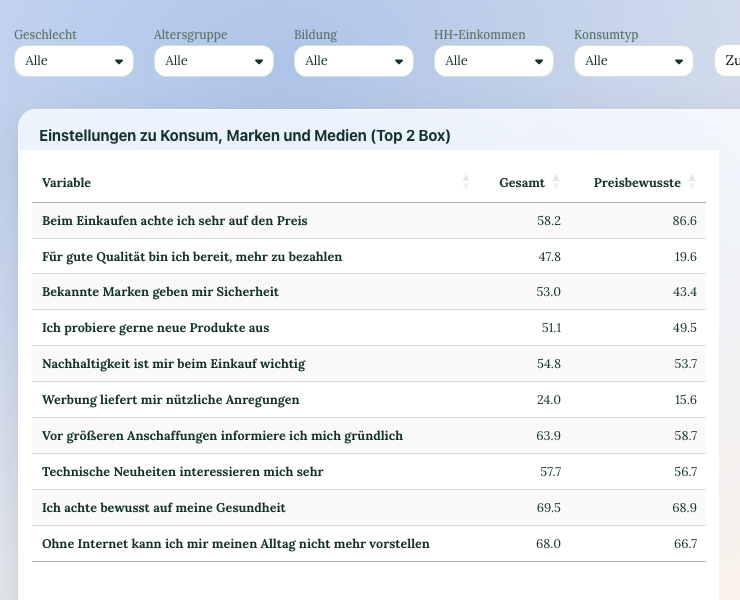
An overall satisfaction of 78% does not tell you what to change on Monday. Relative-importance analysis on the R engine checks which sub-satisfactions — product, advice, delivery time, value for money, support — explain overall satisfaction most.
The result reads as a classic action matrix: importance against performance. High importance with weak performance is where the work is; high importance with strong performance is what you must protect. Regressions are available for deeper models.
- Relative importance: which sub-satisfactions explain the overall score
- Importance against performance, readable as an action matrix
- Linear, ordinal and other regressions on R
- Compare drivers by segment
Code open ends by sentiment and topic automatically
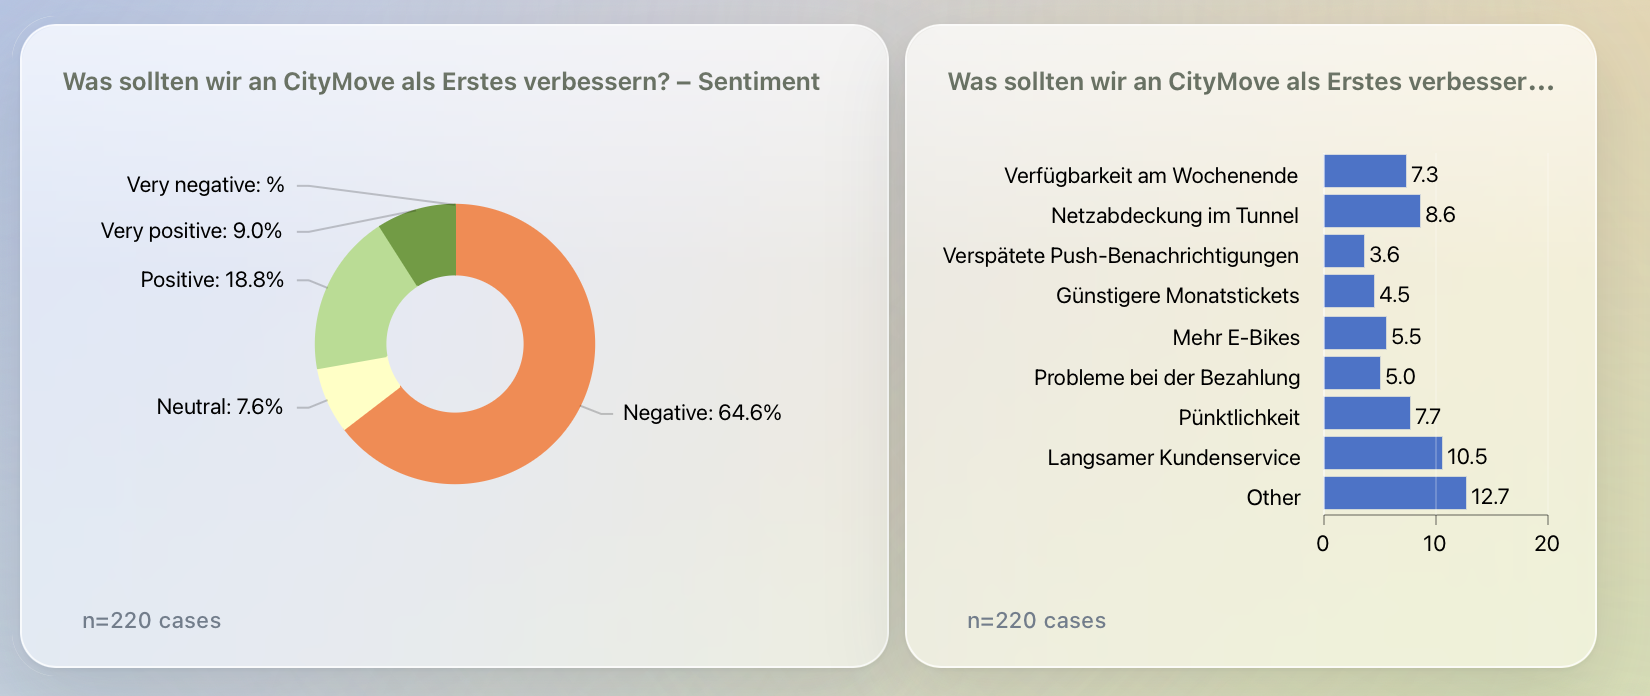
The most telling answers sit in the free-text box — and usually go unread. DataLion codes open-ended responses by sentiment and topic with AI and writes the result back into the dataset as new variables.
Quotes become quantities: crosstab topics against CSAT, track them across waves, and see which topic dominates among the dissatisfied. More on the sentiment & topic analysis page.
- Sentiment and topics of open ends coded by AI
- Results as new variables in the dataset — crosstabbable and weightable
- Analyze topics against CSAT, segment or wave
- Your own topic lists instead of rigid default categories
Satisfaction by touchpoint, location and customer group
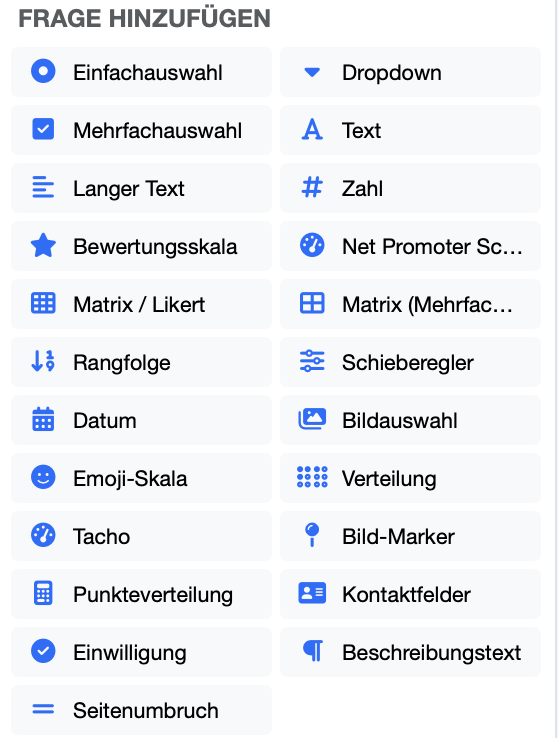
Satisfaction is rarely uniform. Break CSAT down with live filters by touchpoint, location, product, channel or customer segment — the table recalculates instantly, weighted bases included.
DataLion checks whether a difference holds up right in the table: at 80%, 90%, 95% or 99% confidence via z-test, chi² or t-test, shown as stars or letters, with an optional Yates correction for chi². So you argue about real differences instead of noise.
- Live filters by touchpoint, location, product or customer segment
- Significance at 80/90/95/99% — as stars or letters
- z-test, chi² and t-test; pairwise and complement comparisons
- Weighted bases that recalculate as you filter
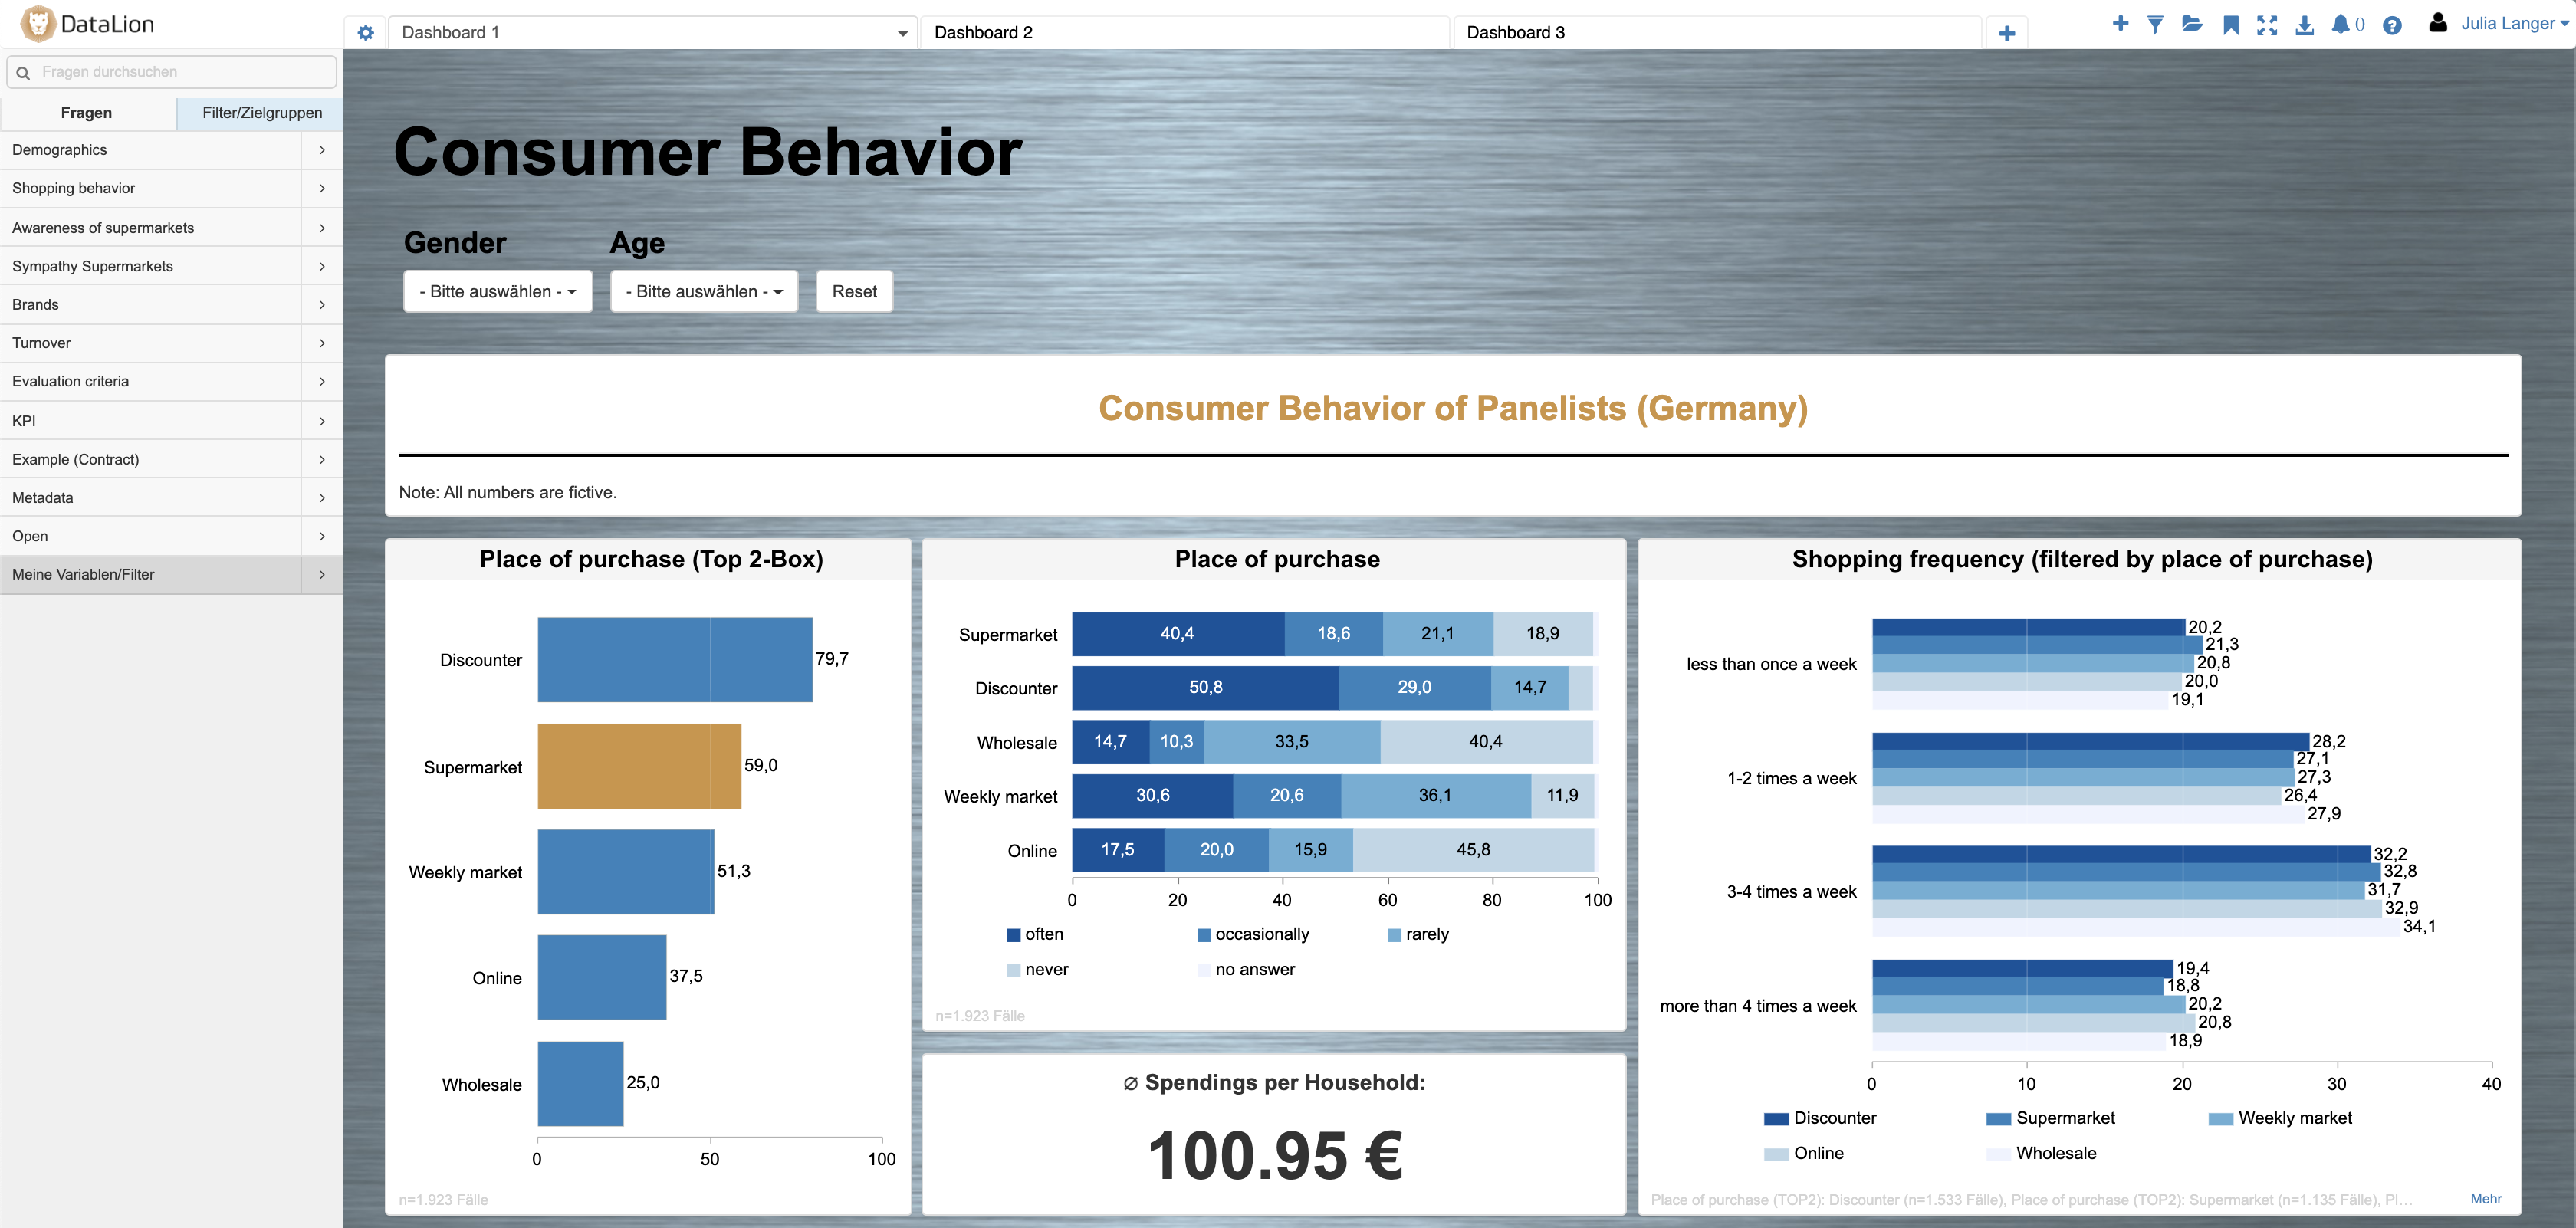
Track satisfaction instead of measuring it once
A single measurement is a snapshot. In tracking, DataLion shows CSAT as a timeline and smooths it on request with a moving (SMA) or exponentially weighted (EMA) average — you choose the window.
New waves are imported automatically, the dashboard updates, and wave-over-wave change can be significance-tested. The wave setup itself is covered on the tracking studies page.
- CSAT as a timeline, wave after wave
- SMA/EMA smoothing with a freely chosen window
- Wave-over-wave change significance-tested
- Automatic wave import, dashboard refreshes itself
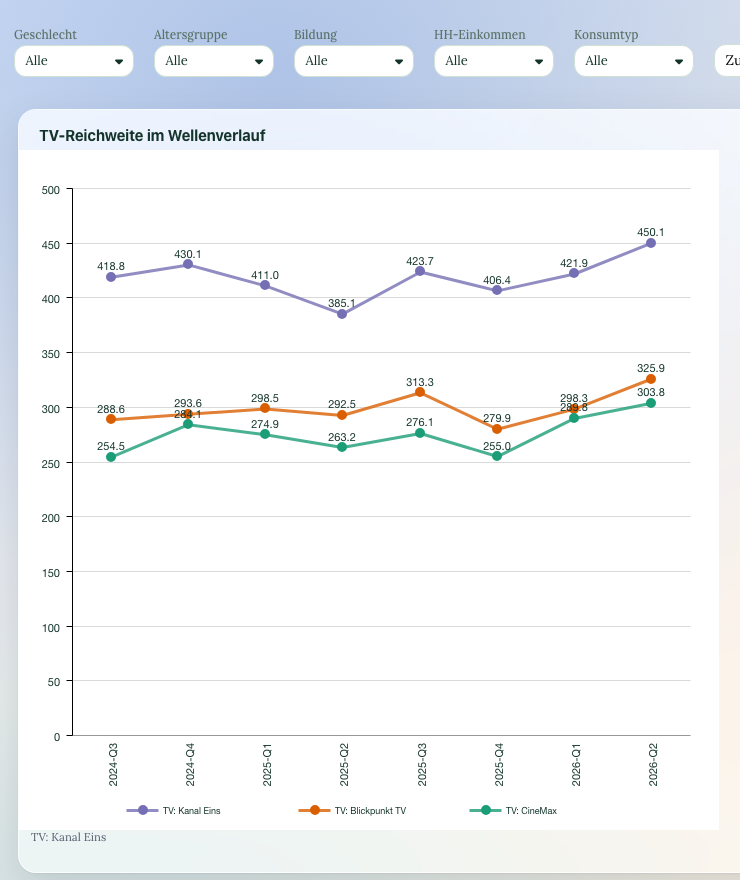
Field the survey — answers are analyzable at once
Collect satisfaction with rating, scale and matrix/Likert questions, plus an open why-question. For loyalty, add the NPS question type — how DataLion computes that score is covered on the Net Promoter Score page.
On publishing, DataLion creates the project, dataset and codebook with value labels automatically. Every matrix row becomes its own variable and answers are chartable immediately — no recodes, no export to SPSS.
- Rating, scale and matrix/Likert questions plus an open why-question
- NPS question type for loyalty in the same questionnaire
- Auto-codebook with value labels — chartable at once, no recodes
- Invite by anonymous link, QR code or one-time token
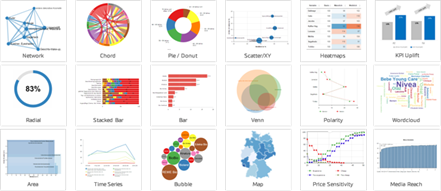
What you can build with DataLion
See DataLion with your own data
Start free with your own raw data. Or book a personal demo of the path to a finished dashboard.
What users say about DataLion
- via G2
The embedding function allows us to generate insights of our data for our audience and customers by far less than half of the usual time needed before.
Verified user · Leisure, Travel & Tourism - via G2
User-friendliness, especially for market research topics. Structured backend with many customization options.
Verified user · Market Research - via G2
The contacts at DataLion are very committed. If you have problems, you can count on help. DataLion reacts quickly to requests for new functions.
Robert Q. · Managing Director - via G2
Very professional company, attentive to the customer needs, provider of a great software and service.
Generoso M. · CRM Analyst, Automotive

We now work much more efficiently, giving us more time to take care of the derivations and insights from the data for the customers.
The platform in detail
Go deeper
Common questions about customer satisfaction with DataLion
How do you measure customer satisfaction?
How does DataLion calculate CSAT?
How do I find out what drives satisfaction?
Can DataLion analyze the open-ended answers?
Is the difference between two locations significant?
What is the difference between CSAT and NPS?
Ready to turn satisfaction into action?
Try DataLion free with your own satisfaction survey — from the top-box score to the driver analysis. Or book a personal demo.