
Sector: housing providers & cooperatives
The tenant survey that reaches the individual estate
An overall score of 3.8 has never triggered a maintenance decision. DataLion collects your tenant and member surveys and analyses them — by estate, by length of tenancy, by age group, including AI coding of the open comments.
Free to start · no credit card · hosted in Germany
DataLion is a survey and analysis platform for housing providers and cooperatives: tenants answer via a QR code on your letter, results flow into a live dashboard, and AI codes open comments by topic and sentiment — optionally against your own topic list, so waves stay comparable. URL parameters turn the estate into a filter and comparison dimension. Anonymous, GDPR-friendly, hosted in Germany.
- 🇩🇪 Made in Munich
- GDPR-compliant
- DPA included
- Hosted in Germany
- 🌐 Interface in EN, DE, FR, ES, IT & NL
Trusted by research institutes, brands & insights teams






- 50+ interactive chart types
- 20+ statistical methods
- SPSS · Excel · CSV import without data loss
- ISO 27001 certified data centers (Germany)
Where tenant surveys break down in practice
- The report arrives every two or three years as a PDF from an agency — and cannot be questioned afterwards. "What does that look like on the Northside estate?" costs a new quote.
- The overall mean irons flat the one estate where the dissatisfaction actually sits — the one that needs the investment.
- The open comments are the most productive question in the whole survey and still go largely unread, because nobody hand-codes 4,000 of them.
- Nothing happens between waves: repairs, modernisation and neighbourhood projects have no continuous measurement, even though that is where decisions are made.
A QR code on the letter — the channel you already use
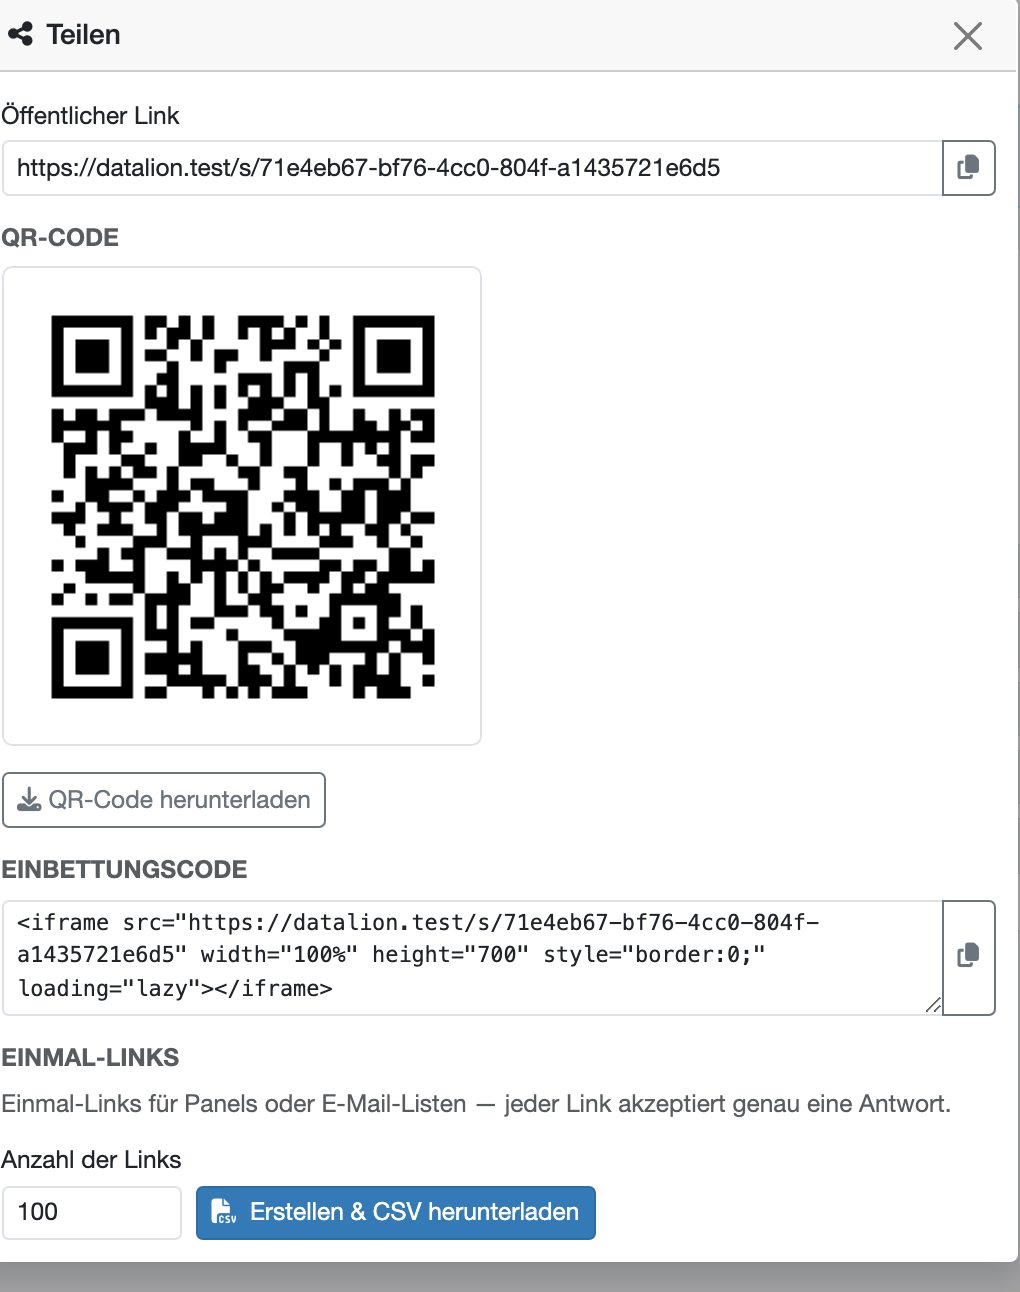
Housing providers have an advantage few sectors share: you already write to your customers by post. Every published survey has a public link with a downloadable QR code — printed on the letter, in the tenant magazine or posted in the stairwell. Tenants answer on their own phone, no app and no login.
To keep it to one response per household, generate one-time links and download them as CSV — up to 1,000 per request. Each link works exactly once and contains no personal data. Whether you keep a record of which link went to which address is your call; for an anonymous survey you deliberately do not.
- QR code as PNG straight from the share dialog
- One-time links as CSV, up to 1,000 per request
- No IP address and no contact details stored with a response
- Embeddable as an iframe in your tenant portal
The estate becomes an analysis dimension — without asking for it
Append a parameter per estate to the survey link — for example ?estate=northroad. The value is stored as its own variable with every response and is immediately available in the dashboard as a filter and comparison dimension. One QR code per estate, one shared dataset, and the question "where exactly?" is answered without giving up anonymity.
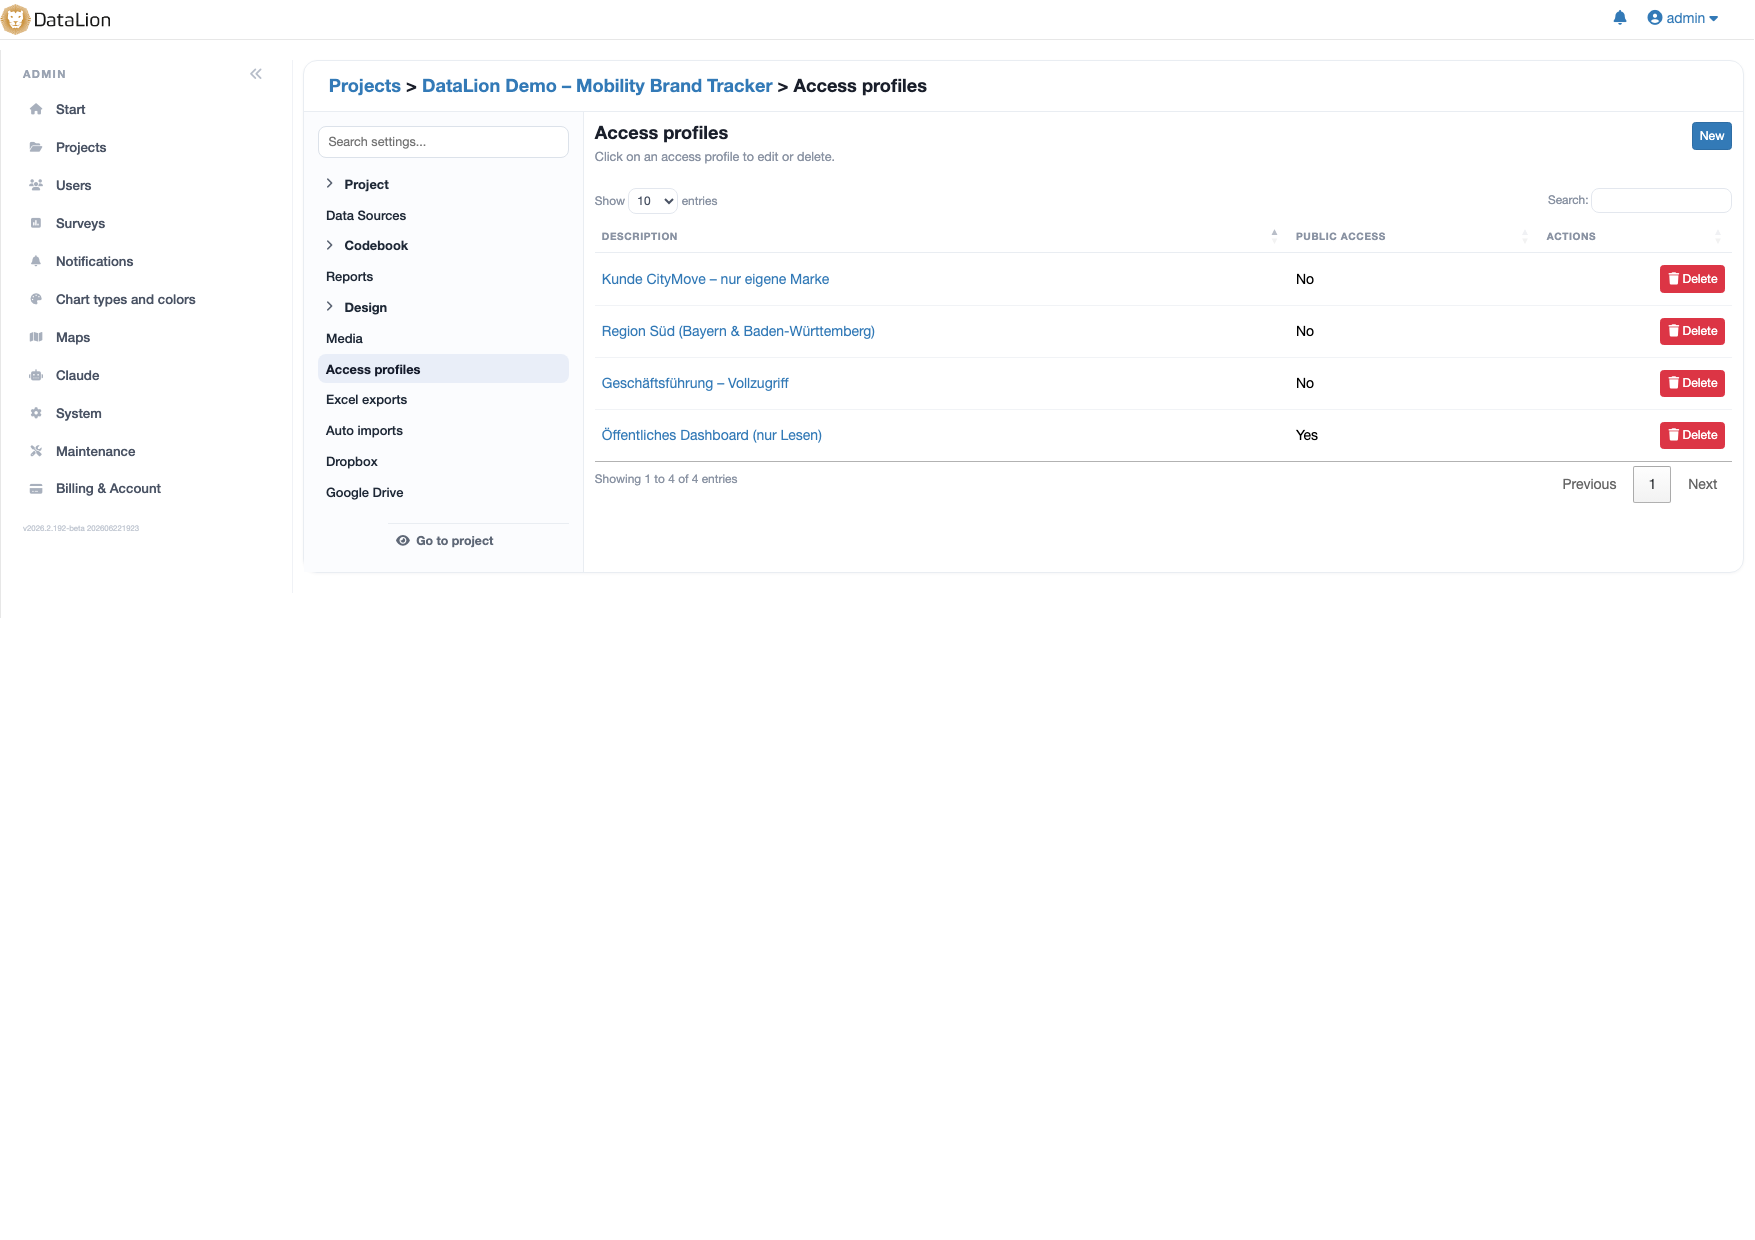
Access profiles give each regional or block manager only their own pre-filtered slice, while head office compares every estate side by side — with crosstabs and significance tests when the difference has to hold up. For small units you can set a minimum case count below which no figures are shown.
- One QR code per estate, one shared dataset
- Access profiles with a hard-wired filter per estate
- Crosstabs and significance tests instead of gut feel
- Minimum case counts protect small estates from inference
AI codes the open comments — against your topic list
"What should we improve first on your estate?" is the most productive question in the whole survey and the one most often left unread. DataLion codes open answers by topic and sentiment using AI and writes both back into the dataset as new variables — real measures in the codebook, not a summary in a text box.
What matters is that you can give the AI your own topic list — the action categories from your last wave, for instance. It then codes against exactly that scheme instead of inventing fresh categories each time, and the waves stay comparable. Because topic and sentiment are ordinary variables, you can cross-tabulate them afterwards: which theme do long-term tenants raise, which the recent arrivals, which one particular estate? The derived measures carry an "(AI-classified)" suffix, so a report always shows what came from the machine.
- Three new variables per text question: topic, sentiment and sentiment score
- Supply your own topic list — waves stay comparable
- Topic and sentiment cross-tabulate like any other variable
- Derived measures are labelled "(AI-classified)"
From dashboard to board pack
One click turns any dashboard into an editable PowerPoint file in your organisation’s layout, plus Excel tab books and PDF. The board report stops being its own project and becomes an export — and when a question comes back from the room, the answer is a filter click rather than a new commission.
For a members’ meeting or tenant newsletter you can share a dashboard as a link that viewers open without an account. And because the questionnaire is kept as a template, the next wave is built identically: same variables, direct comparison, with significance tests where you want them.
- Editable PowerPoint in your own layout, Excel tab books, PDF
- Share dashboards as a link — no account needed to view
- Waves built identically and directly comparable
Four questionnaires for the housing sector’s survey calendar
-
Tenant survey (housing satisfaction)
The big one: home, neighbourhood, service, community and recommendation — built so every block yields its own analysis dimension.
View template → -
Cooperative member survey
Not the flat but the membership: identification, participation, information channels and willingness to get involved.
View template → -
Post-repair feedback
Continuous measurement after every contractor visit: fixed on the first visit, punctuality, tidiness and the effort asked of the tenant.
View template → -
Modernisation consultation
The survey before the diggers: how informed people feel, concrete worries, priorities among the works and support needed during construction.
View template →
Charts that fit
The analyses you actually need
DataLion ships over 40 chart types. For a tenant survey, three of them carry the work — here they are, captured from a real example survey with 1,170 responses.
-
multistack
Stacked scale profiles
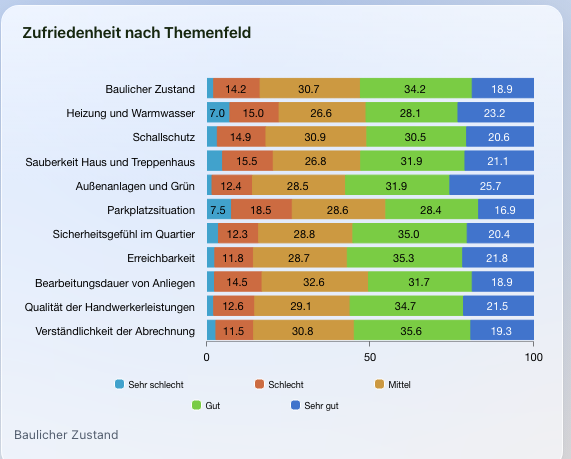
Eleven rating aspects in one picture, each as its full 1-to-5 distribution. A mean bar would hide the fact that on "parking" a quarter of tenants rate not merely average but poor — and it is exactly that tail that decides whether a measure is urgent.
-
b-bar
Topics from open comments
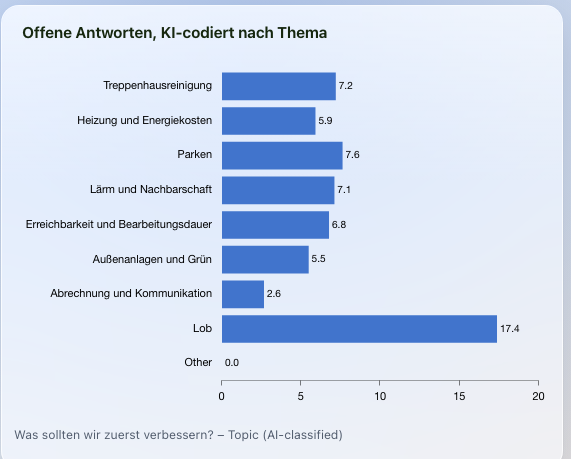
The AI-coded topic variable as an ordinary bar chart. Because the topic is a real codebook variable, you can cross-tabulate it by estate and tenure afterwards — "nobody reads this anyway" becomes a ranking you can base an investment decision on.
-
b-bar
Sentiment split
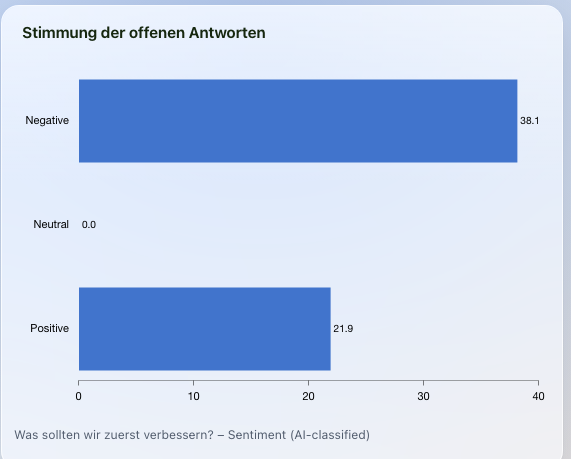
The sentiment of those same open comments — in this example based on all respondents, not only those who wrote something. Most useful as a time series across waves: the topic ranking shifts slowly, while sentiment reacts far faster to a refurbishment or a change of estate manager.
See DataLion with your own data
Start free with your own raw data. Or book a personal demo of the path to a finished dashboard.
What users say about DataLion
- via G2
The embedding function allows us to generate insights of our data for our audience and customers by far less than half of the usual time needed before.
Verified user · Leisure, Travel & Tourism - via G2
User-friendliness, especially for market research topics. Structured backend with many customization options.
Verified user · Market Research - via G2
The contacts at DataLion are very committed. If you have problems, you can count on help. DataLion reacts quickly to requests for new functions.
Robert Q. · Managing Director - via G2
Very professional company, attentive to the customer needs, provider of a great software and service.
Generoso M. · CRM Analyst, Automotive

We now work much more efficiently, giving us more time to take care of the derivations and insights from the data for the customers.
The relevant features in detail
Questions housing providers ask
Does DataLion satisfy the Regulator of Social Housing’s Tenant Satisfaction Measures requirements?
Many of our tenants prefer to answer on paper. Does DataLion support that?
Can we apply the AI coding to older survey data that we import?
Do we get an alert when a very poor rating comes in?
Some of our tenants do not speak the local language. Can we survey multilingually?
We work with a consultancy. Does DataLion fit alongside that or replace it?
Analyse your next tenant survey yourself
Create a workspace, start from the ready-made tenant survey template and see on the test dataset what per-estate analysis looks like.