
Sector: hospitals, rehabilitation & care
The patient survey that reaches the ward
The annual report from the agency says hospital B scores 3.9. It does not say which ward drags the score down. DataLion collects patient, referrer and relatives surveys and analyses them, per hospital, per department, per ward, with AI coding of the open comments.
Free to start · no credit card · hosted in Germany
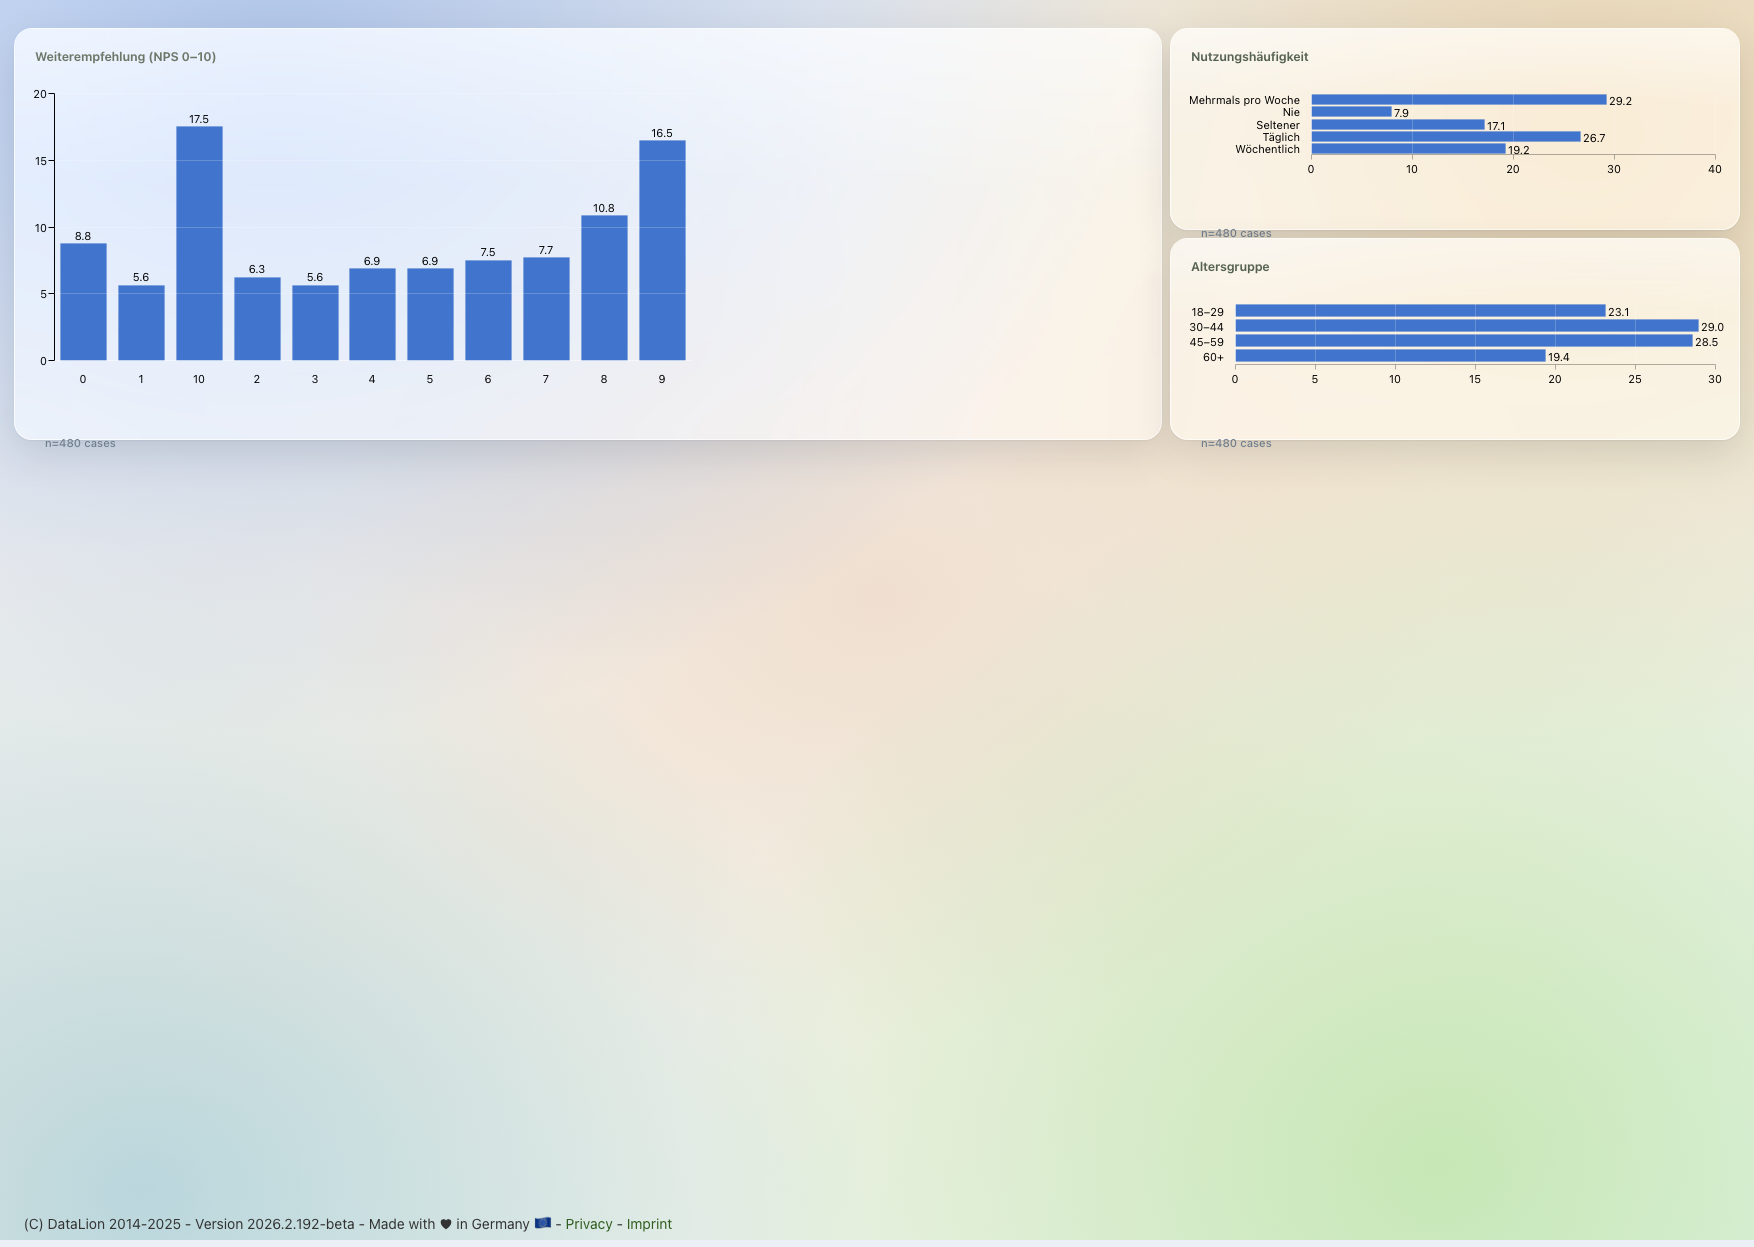
DataLion is a survey and analysis platform for hospitals, hospital groups and care providers: patients answer via a QR code on the discharge folder, referrers and relatives via invitation, and the results flow into a dashboard each department sees pre-filtered. AI codes open comments by topic and sentiment. Collection is anonymous, the DPIA documents for health surveys sit in the Trust Center, and hosting is in Germany.
- 🇩🇪 Made in Munich
- GDPR-compliant
- DPA included
- Hosted in Germany
- 🌐 Interface in EN, DE, FR, ES, IT & NL
Trusted by research institutes, brands & insights teams






- 50+ interactive chart types
- 20+ statistical methods
- SPSS · Excel · CSV import without data loss
- ISO 27001 certified data centers (Germany)
Where patient surveys break down in practice
- The survey satisfies the quality-management duty and nothing else: one PDF per hospital, once a year, and "what does that look like on ward 4b?" costs a new quote from the agency.
- The overall mean smooths over exactly the ward where the problem sits. Among 40 wards, one at 2.8 disappears in the average.
- The open comments are the most useful part of the questionnaire and nobody reads them, because 6,000 comments a year do not get hand-coded.
- Referrers and relatives, who decide admissions and reputation, are not surveyed at all, because every extra survey would be a new project with the agency.
A QR code on the discharge folder, an invitation to the practice
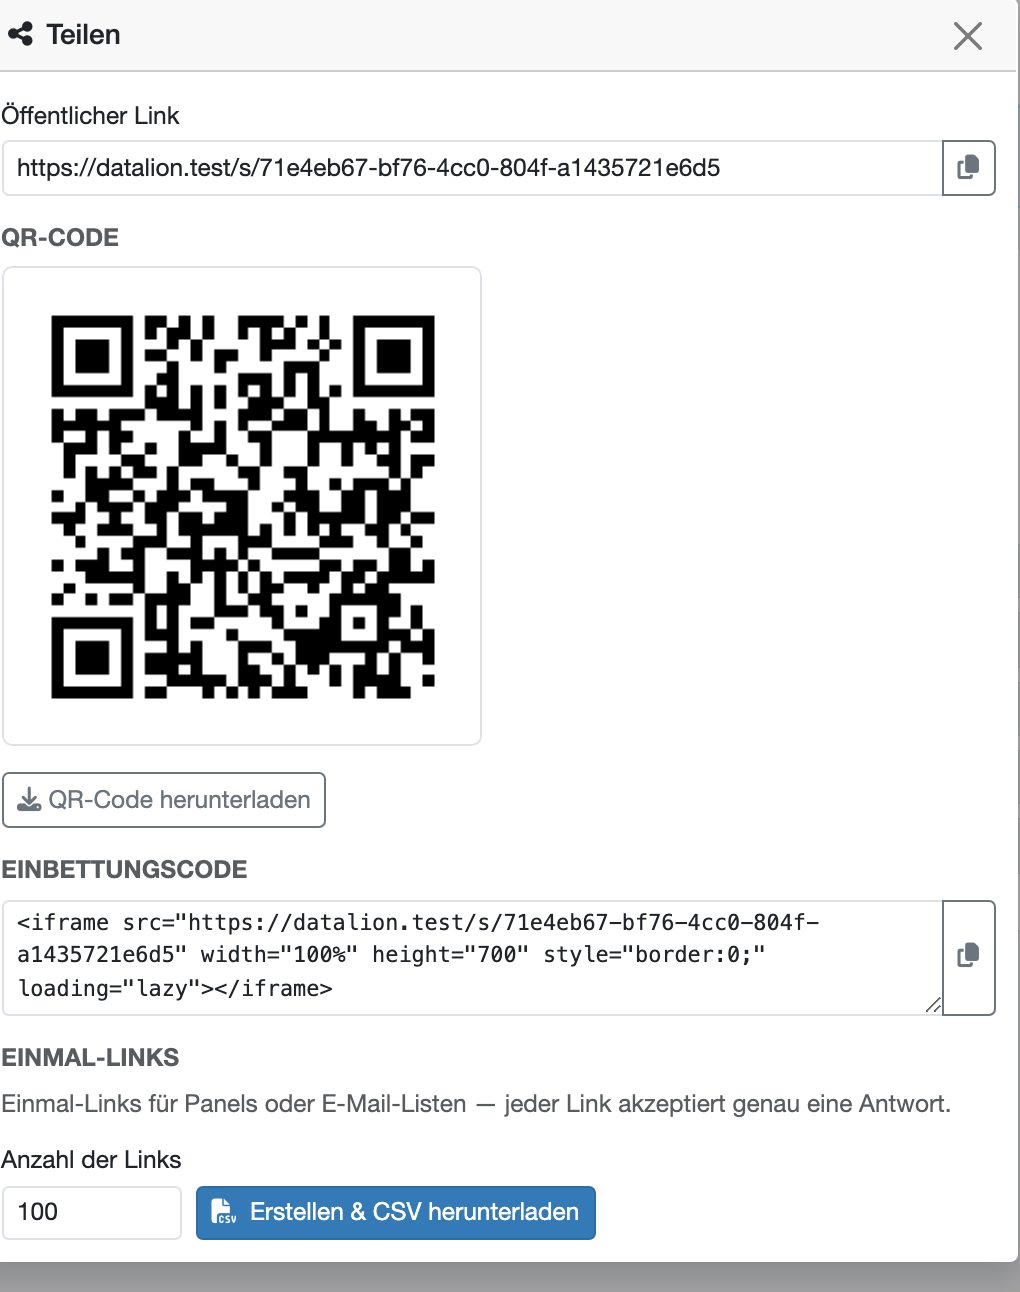
Every published survey has a public link with a downloadable QR code. It goes on the discharge folder, on the poster in the waiting area or in the closing email of a rehabilitation stay. Patients answer on their own phone, with no app and no login, and the questionnaire controls appear automatically in six languages.
You reach referrers and relatives differently: through DataLion's fieldwork module. Upload a contact list, send invitations and reminders in the hospital's layout and watch the delivery status. The answers still stay anonymous, because DataLion stores no IP address or contact details with any response and does not link it to the invitation list.
- QR code as PNG straight from the share dialog
- Invitations, reminders and opt-outs from the fieldwork module
- No IP address and no contact details stored with a response
- Questionnaire interface in DE, EN, FR, NL, IT and ES
Hospital, department and ward become analysis dimensions
Append a parameter per ward to the survey link, for example ?site=north&ward=4b. The value is stored as its own variable with every response and is immediately available in the dashboard as a filter and comparison dimension. One QR code per ward, one shared dataset, and the ward question is answered without appearing in the questionnaire.
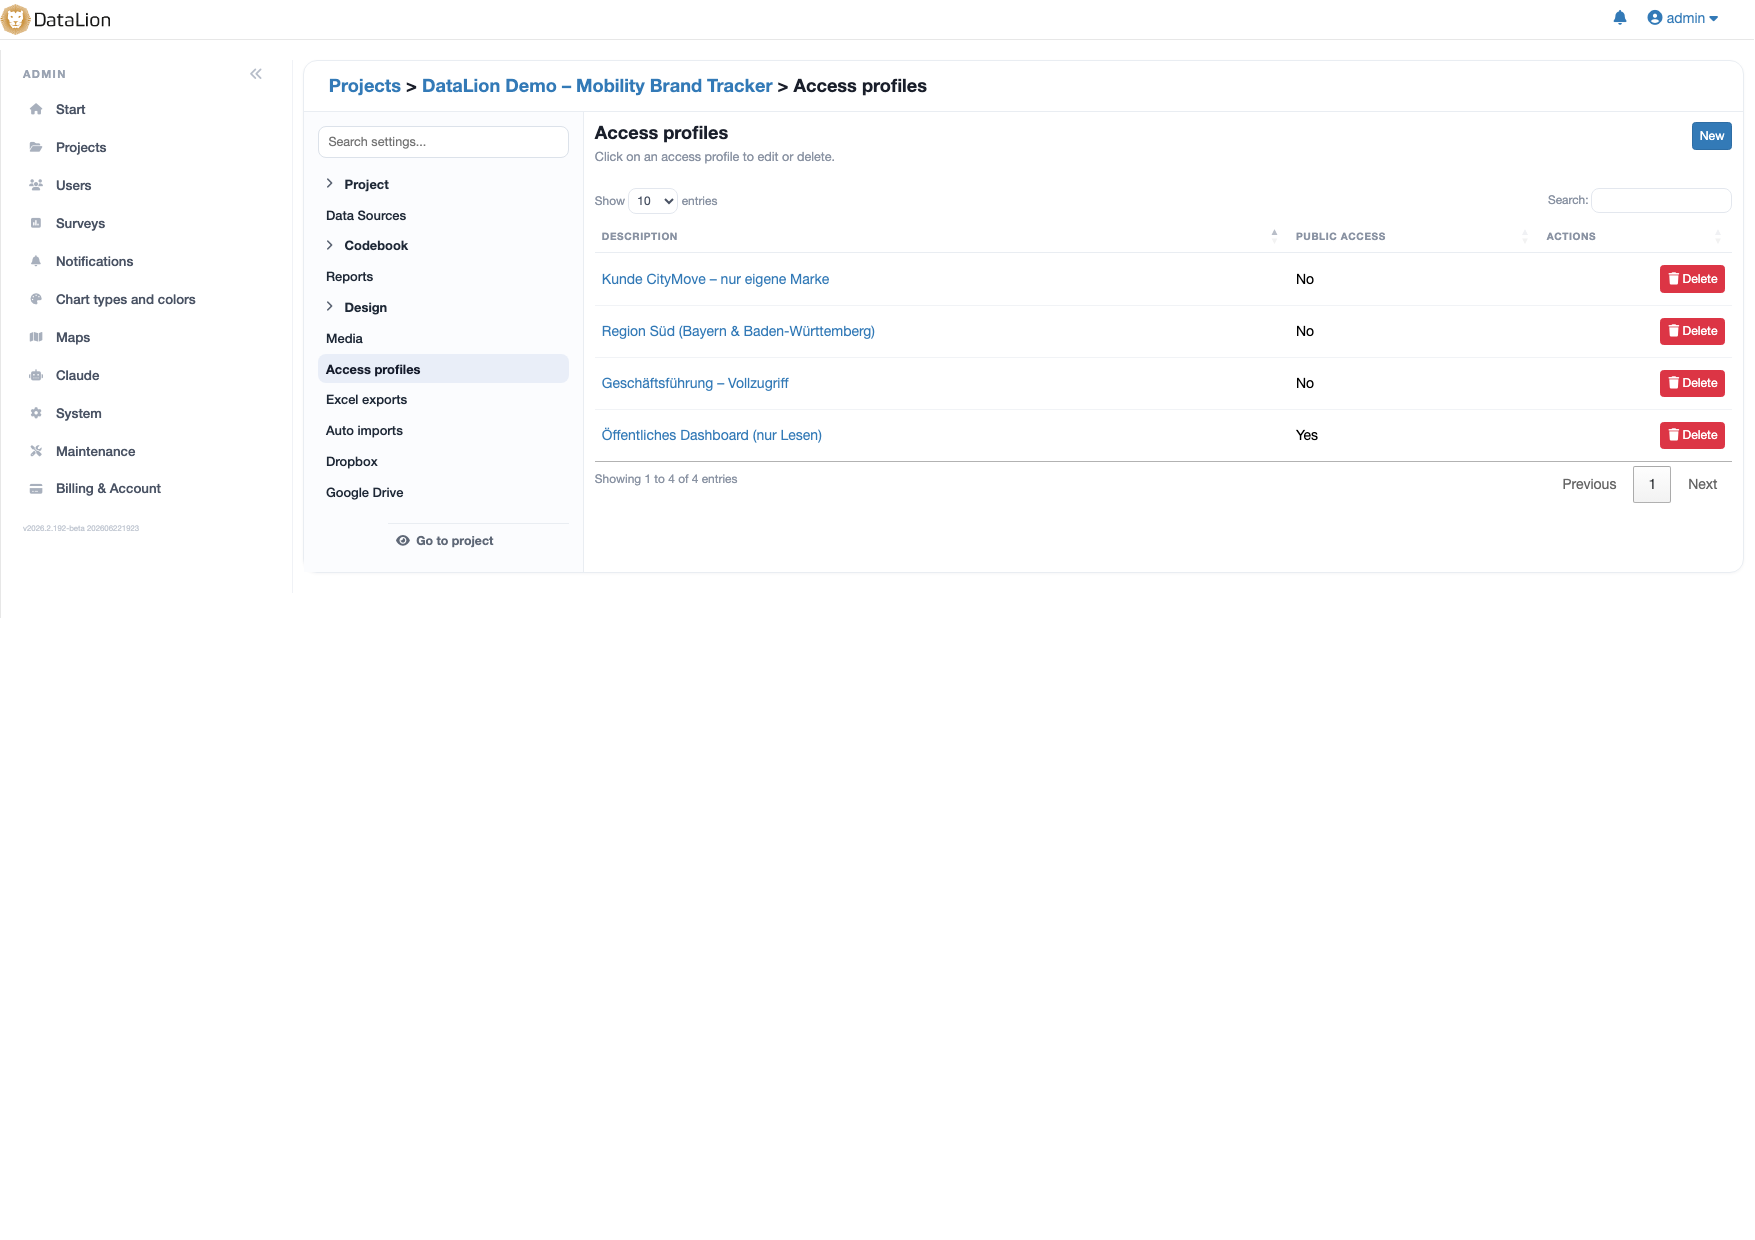
Access profiles give each chief physician and each head of nursing only their own pre-filtered slice. Group management compares every hospital side by side, with crosstabs and significance tests when the difference has to hold up. For small wards you set a minimum case count; below it nothing is shown.
- One QR code per ward, one shared dataset
- Access profiles with a hard-wired filter per department
- Crosstabs and significance tests instead of gut feel
- Minimum case counts protect small wards from inference
Health data needs more than a DPA
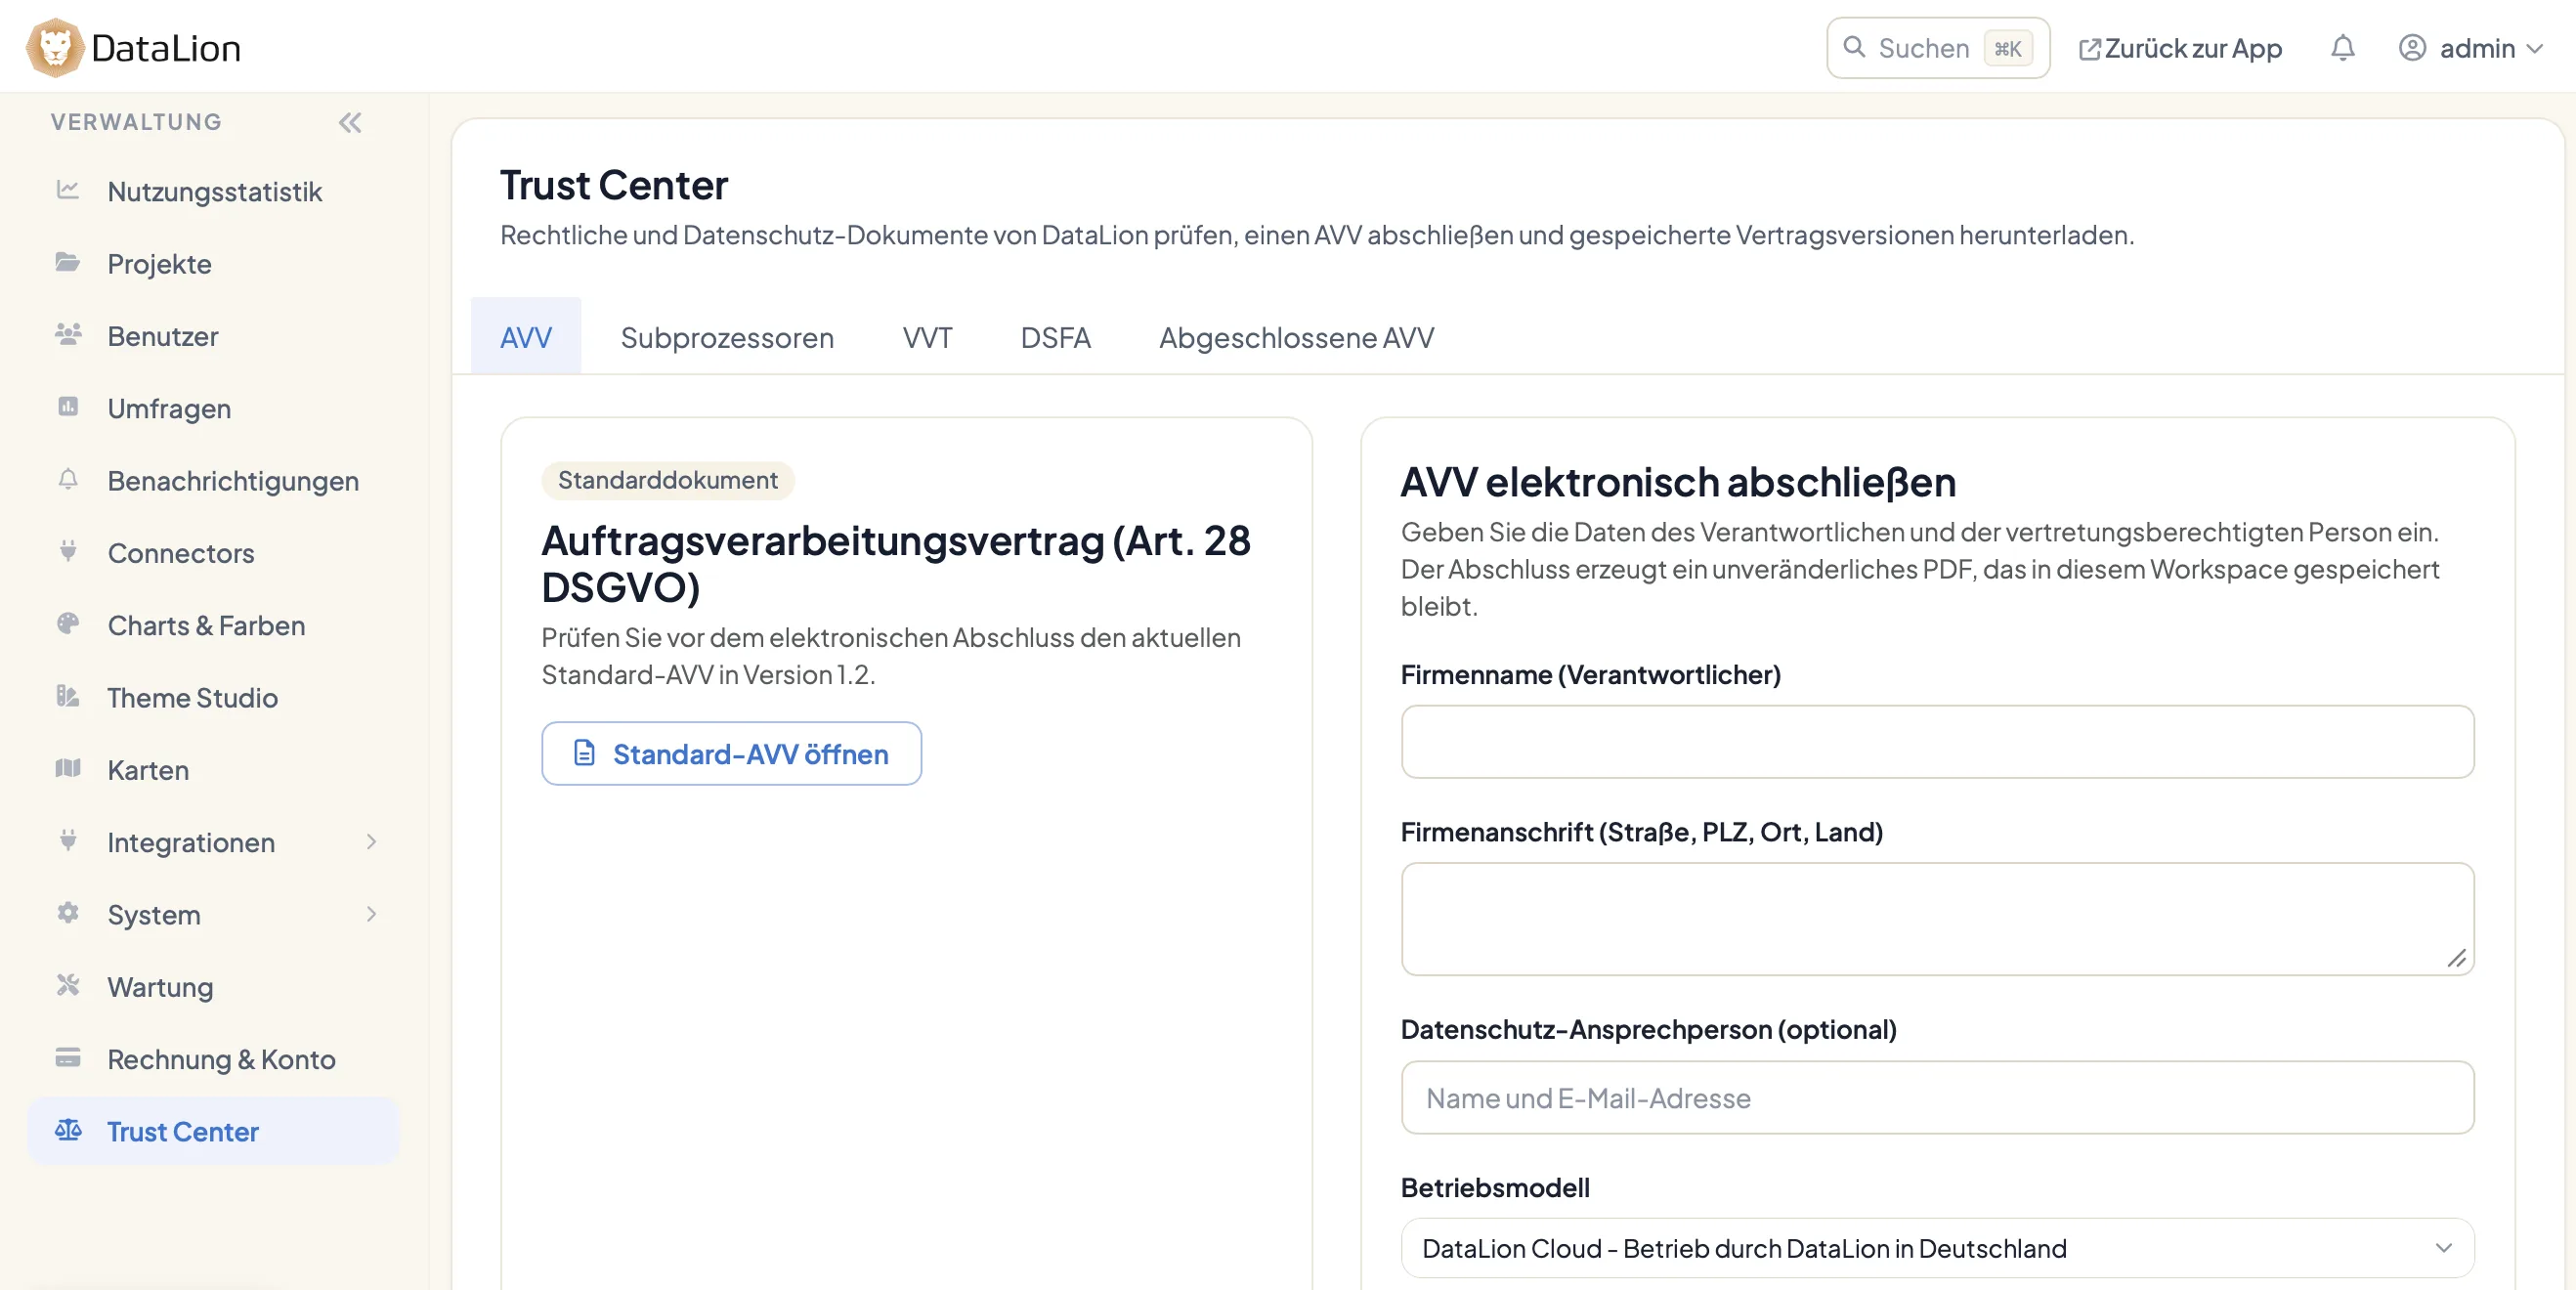
A patient survey processes health data under Article 9 GDPR, and your data protection officer will want to see the data protection impact assessment. DataLion's Trust Center holds the data processing agreement, the list of sub-processors, the records of processing activities and the DPIA documents for employee and health surveys, which you can extend with your own details. You sign the DPA electronically and keep it as an immutable PDF.
Collection is anonymous by design. Personal data only arises when you add a contact question with consent to the questionnaire, for example for a callback from complaints management. Hosting is in ISO 27001-certified data centres in Germany, and the AI features run by default through a German gateway that does not store requests.
- DPA, sub-processors, records of processing and DPIA in the Trust Center
- DPIA templates specifically for health and employee surveys
- Anonymous answers, contact details only with a consent question
- Hosted in Germany, AI gateway without retention
AI codes the open comments against your topic list
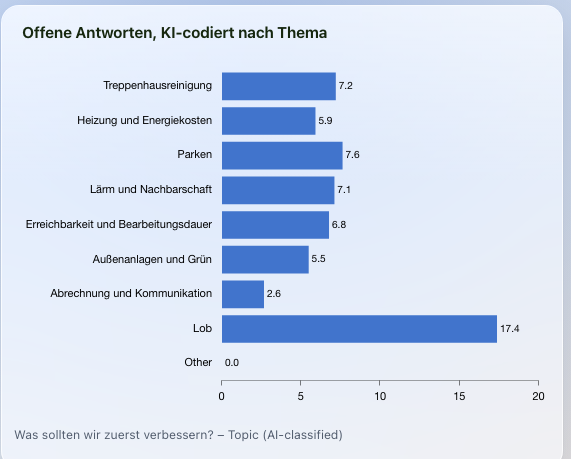
"What could we have done better?" is the question that helps ward managers most and gets analysed least. DataLion codes open answers by topic and sentiment using AI and writes both back into the dataset as new variables, real measures in the codebook. Give the AI your complaints catalogue as the topic list and it codes against exactly that scheme, so waves stay comparable.
Because topic and sentiment are ordinary variables, you can cross-tabulate them: which theme does surgery raise, which geriatrics, which only the south site? "Nobody reads this anyway" becomes a ranking per ward. The derived measures carry an "(AI-classified)" suffix, so the quality report always shows what came from the machine.
- Three new variables per text question: topic, sentiment and sentiment score
- Your own topic list, for example the hospital's complaints catalogue
- Topic and sentiment cross-tabulate by ward and department
- Derived measures labelled "(AI-classified)"
From dashboard to quality report and chief physicians' meeting
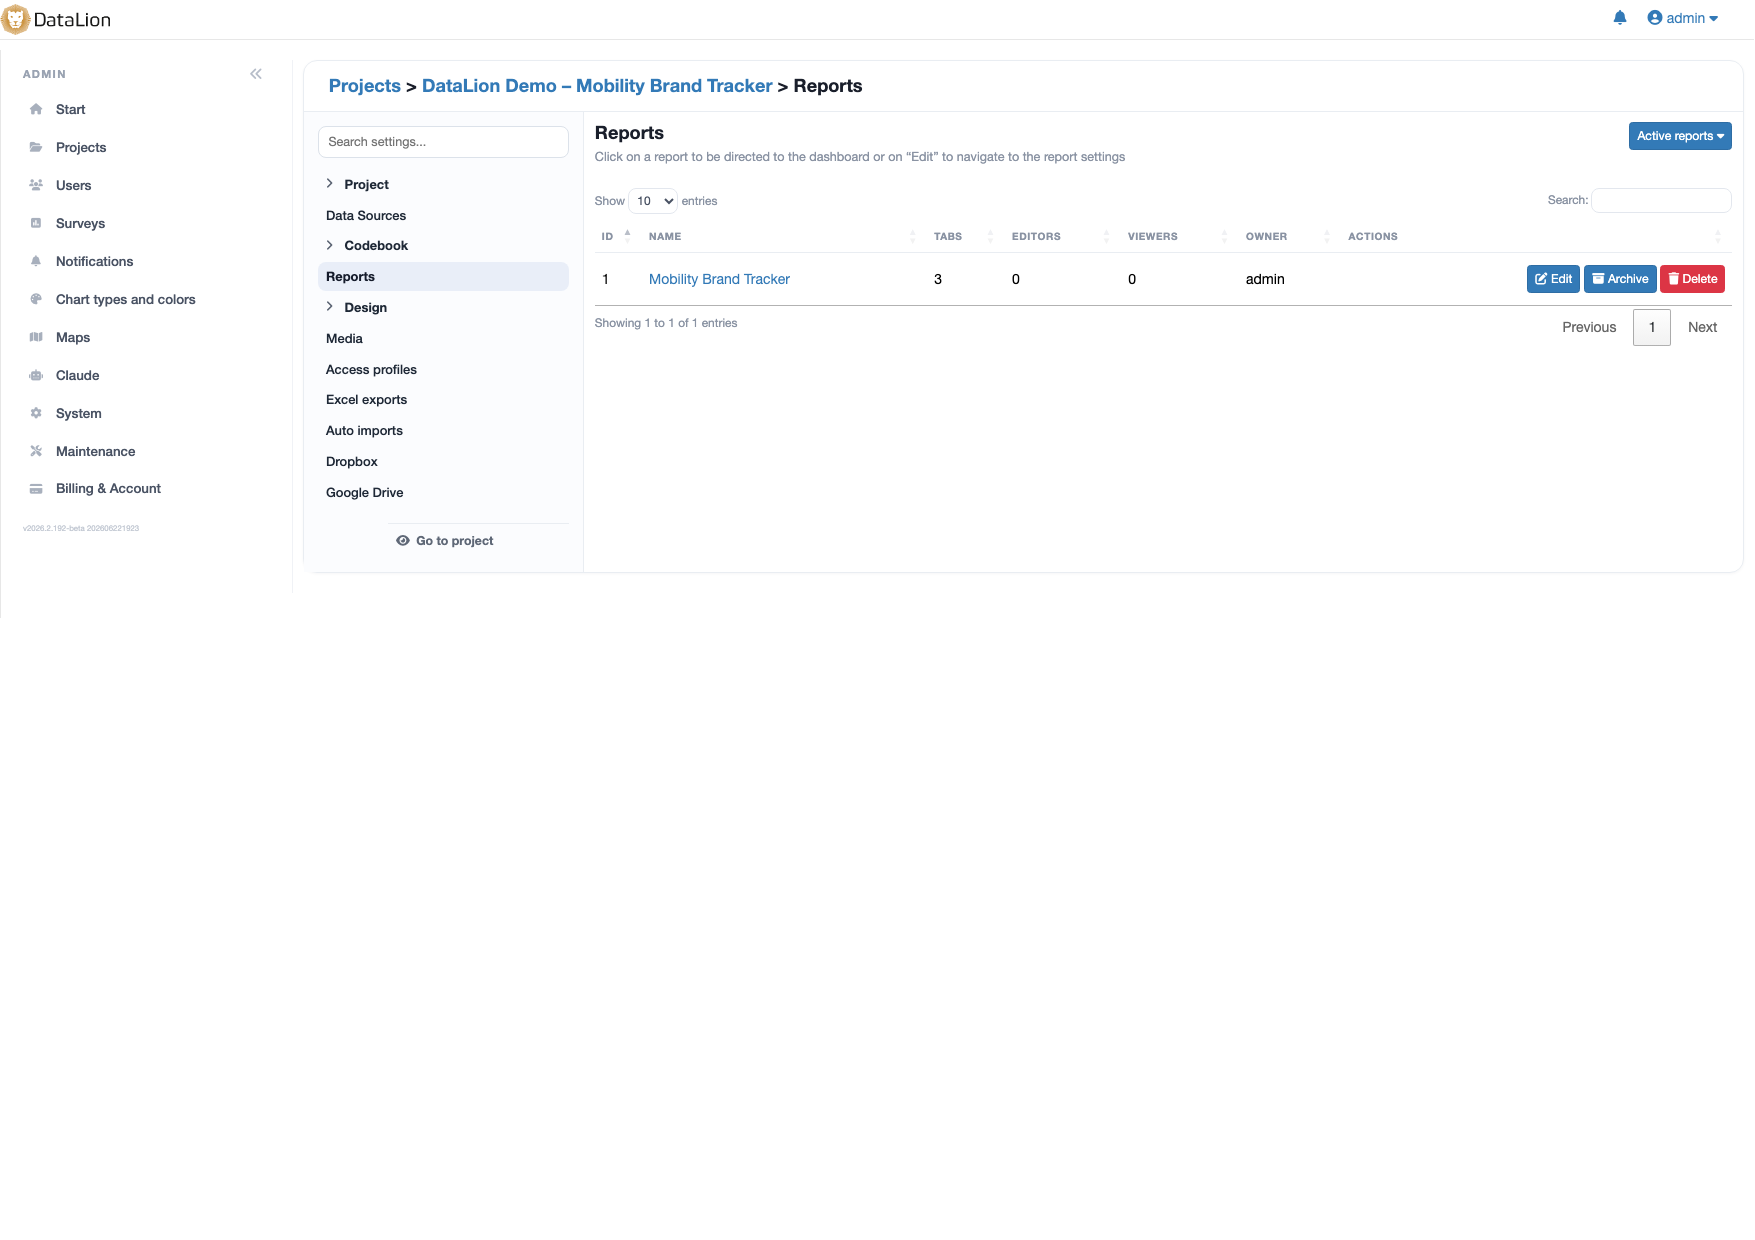
One click turns any dashboard into an editable PowerPoint file in the hospital's layout, plus Excel tab books and PDF. The report for the quality meeting becomes an export, and the follow-up question from the room becomes a filter click. For the supervisory board or the operator you share a dashboard as a link that viewers open without an account.
Because the questionnaire is kept as a template, the next wave is built identically: same variables, direct comparison, with significance tests where you want them. And because the referrer, relatives and staff surveys run on the same platform, the end of the year gives you a picture of the hospital that shows all four perspectives side by side.
- Editable PowerPoint in your own layout, Excel tab books, PDF
- Share dashboards as a link, no account needed to view
- Waves built identically and directly comparable
- Patients, referrers, relatives and staff on one platform
Five questionnaires for a hospital's survey calendar
-
Patient experience (PREM)
The experience during treatment, not its medical outcome: information, involvement, respect, coordination. Short enough for discharge.
View template → -
Patient satisfaction
The classic satisfaction survey: admission, medical and nursing care, accommodation, meals, discharge and recommendation.
View template → -
Referring physician survey
The referring practices: reachability, discharge letter, discharge management, with importance and satisfaction separated so the gaps show.
View template → -
Care home relatives survey
The families' view in residential care: care, information on changes, involvement in care planning, trust.
View template → -
Psychosocial risk assessment
The mandatory German workplace survey for nursing and medical staff, analysable per ward, with a printable questionnaire PDF.
View template →
Charts that fit
The analyses you actually need
DataLion ships over 40 chart types. For a patient survey, three of them carry the work, because they answer the question "where exactly?".
-
heatmap
Heatmap crosstab per ward
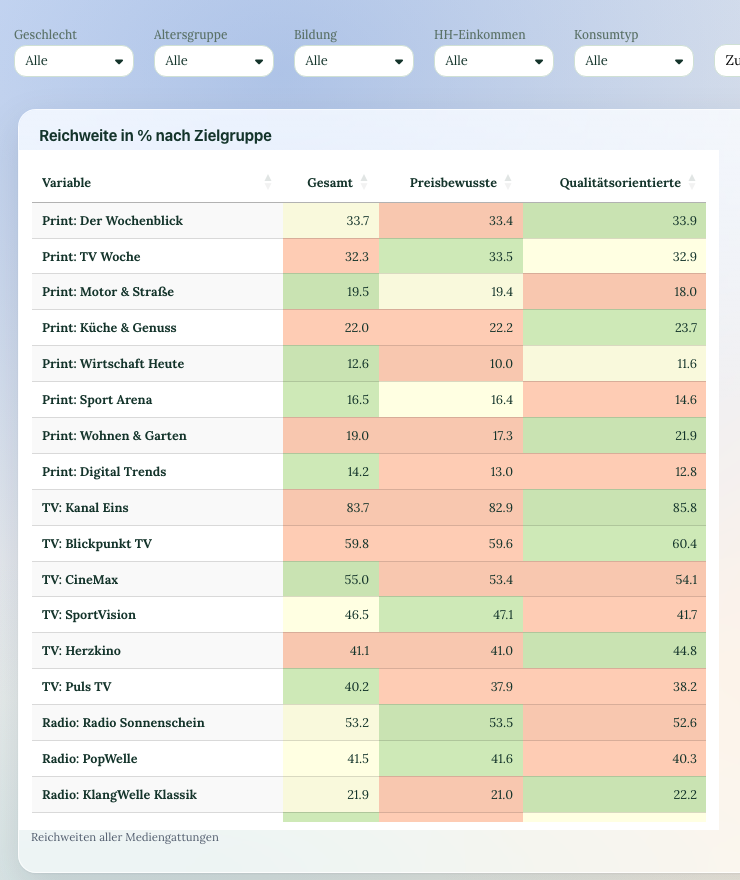
Rating aspects against wards, every cell shaded by value. Among 40 wards the one at 2.8 disappears in the mean; in the heatmap it is the red cell the eye finds first.
-
table
Crosstab with significance markers
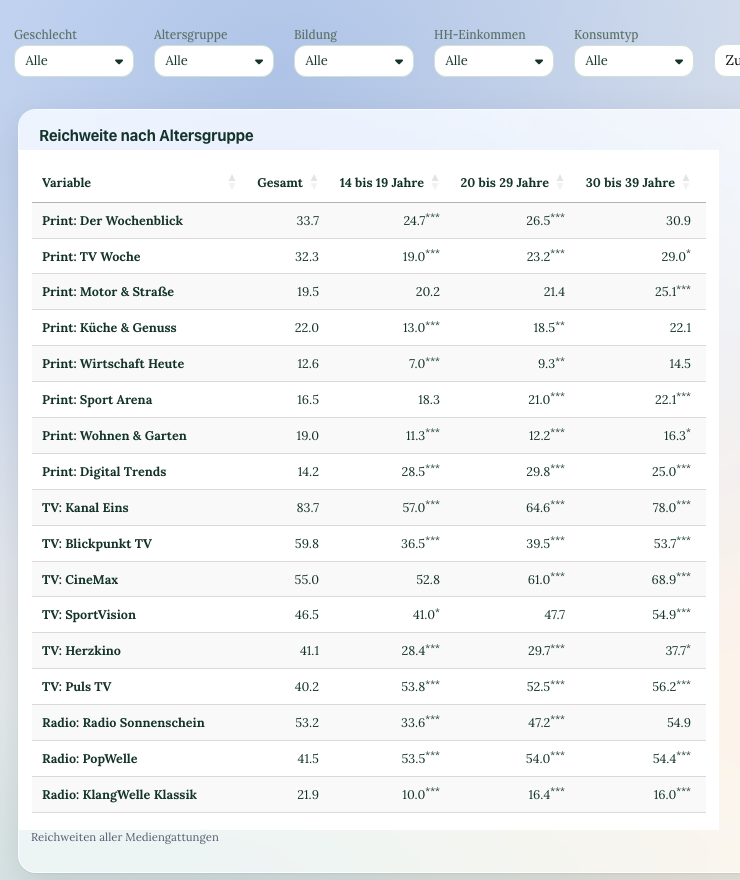
Whether the south site really scores worse than the north site or the difference is chance at 60 responses is decided by the significance test, not by the chief physicians' meeting. The stars in the table say so up front.
-
nps
Patient NPS with promoters and detractors
Recommendation as a score with the three shares next to it, filterable by department. The detractor share per ward is the number complaints management looks at weekly.
See DataLion with your own data
Start free with your own raw data. Or book a personal demo of the path to a finished dashboard.
What users say about DataLion
- via G2
The embedding function allows us to generate insights of our data for our audience and customers by far less than half of the usual time needed before.
Verified user · Leisure, Travel & Tourism - via G2
User-friendliness, especially for market research topics. Structured backend with many customization options.
Verified user · Market Research - via G2
The contacts at DataLion are very committed. If you have problems, you can count on help. DataLion reacts quickly to requests for new functions.
Robert Q. · Managing Director - via G2
Very professional company, attentive to the customer needs, provider of a great software and service.
Generoso M. · CRM Analyst, Automotive

We now work much more efficiently, giving us more time to take care of the derivations and insights from the data for the customers.
The relevant features in detail
Guides for hospitals & care
Questions hospitals and care providers ask
Does a survey run on DataLion satisfy the German G-BA quality-management guideline?
Many of our patients are older and prefer to answer on paper.
Do we get a comparison with other hospitals?
How do we protect small wards from inference about individual patients?
Can we use validated instruments such as the WHO-5 or PHQ-4?
What does it cost for a hospital group with five sites?
Analyse your next patient survey yourself
Create a workspace, start from the patient survey template and see on the test dataset what per-ward analysis looks like.