
Analysis & statistics
Ask your dashboard — in plain words
A chat panel next to your charts: you ask "Which tools do men and women use differently?", DataLion computes the weighted crosstab, and the AI explains the result — with the base, a citation and significance.
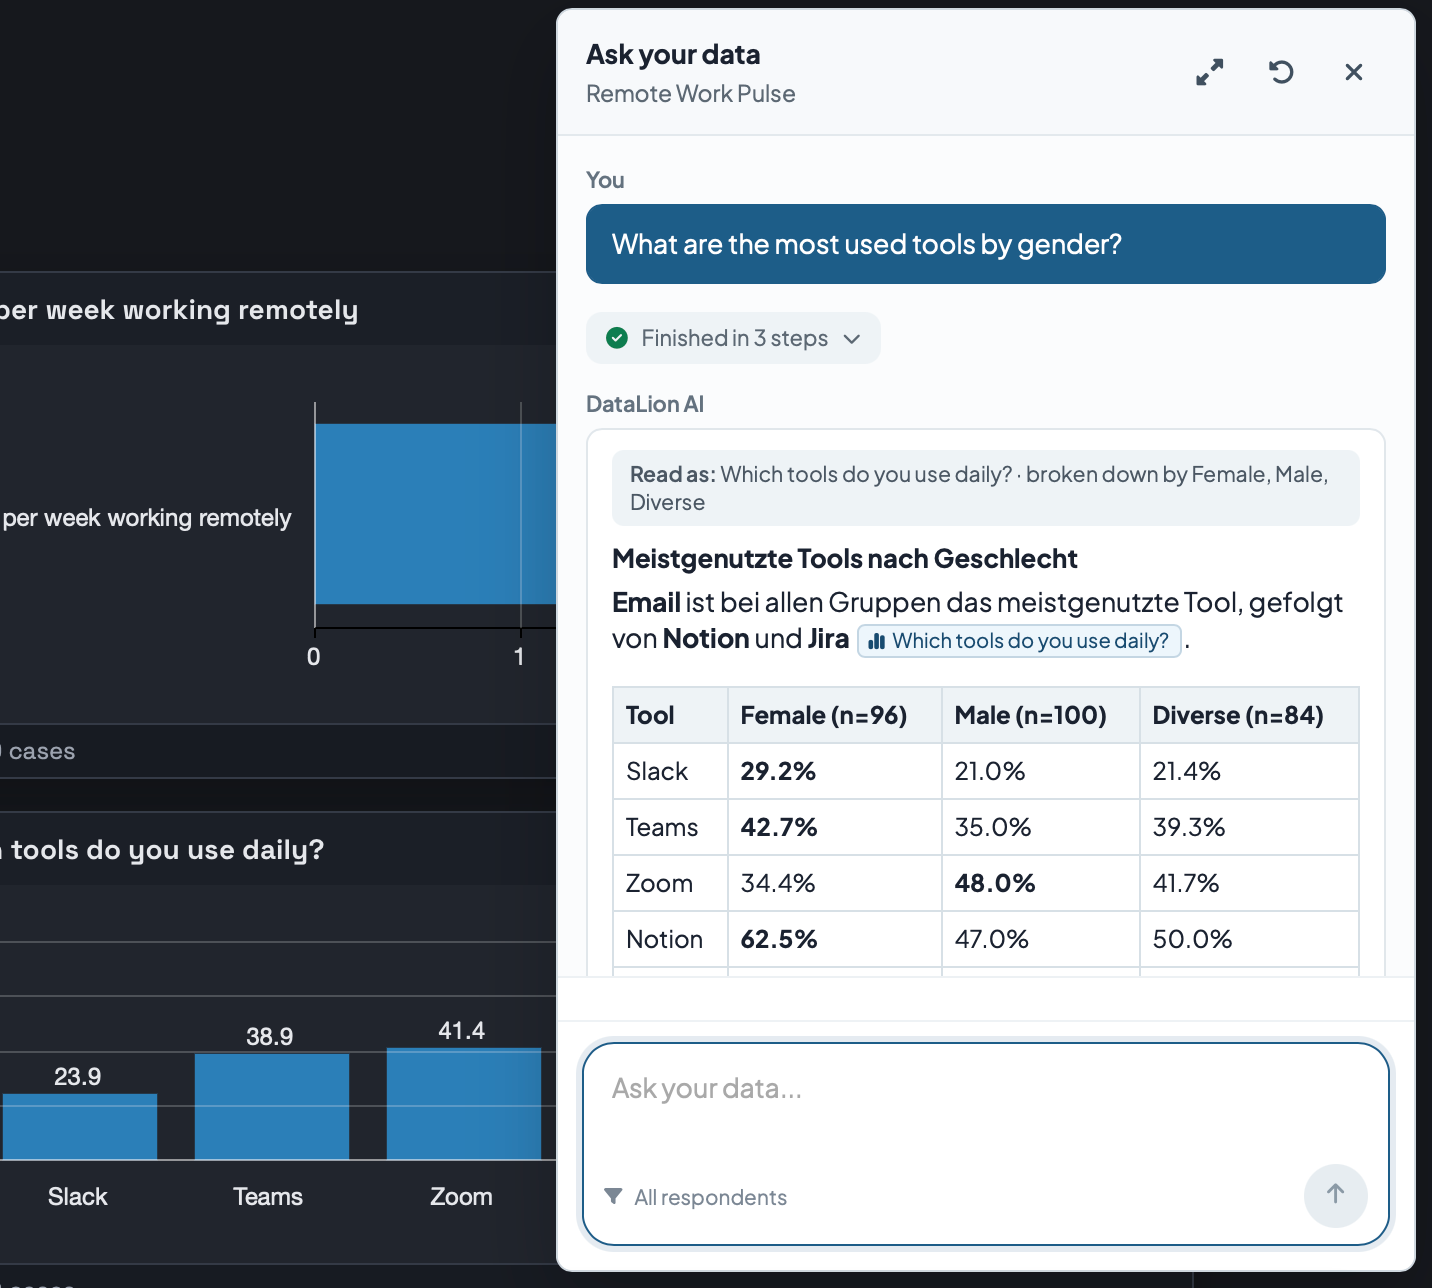
"Ask your data" lets you question your dashboard in plain language. The AI finds the matching variables in the codebook and has DataLion's own chart and statistics engine compute the numbers — weighted, with the active filters and the correct base. Notable group differences are tested by DataLion itself with a z-test and reported with their confidence level.
- 🇩🇪 Made in Munich
- GDPR-compliant
- DPA included
- Hosted in Germany
- 🌐 Interface in EN, DE, FR, ES, IT & NL
Trusted by research institutes, brands & insights teams






- 50+ interactive chart types
- 20+ statistical methods
- SPSS · Excel · CSV import without data loss
- ISO 27001 certified data centers (Germany)
AI chats on survey data mostly guess
- A language model handed a table in its prompt invents numbers — and nobody notices until someone recalculates.
- Weighting, bases and filters fall away: the answer sounds right but describes a different population than the dashboard beside it.
- "Significant" becomes a figure of speech, because nobody checked whether the difference passes a test at all.
The AI finds the question, DataLion computes the answer
The decisive difference is the division of labour: the language model is handed no numbers at all. It searches your codebook for the matching variables and then requests a result table from DataLion — the same engine that draws your charts.
That means weighting, correct bases and the active dashboard filters apply automatically. Above the input box you always see which slice your question refers to: "All respondents" or the number of filters in force.
And the route is visible: the panel streams its intermediate steps live — which variables were searched, which table was fetched, which wave was compared.
- Variable lookup in the codebook instead of guessing from model memory
- Numbers come from DataLion’s chart and statistics engine
- Weighting, bases and active filters apply automatically
- Visible intermediate steps instead of a black box
Whether a difference is real is decided by the test, not the model
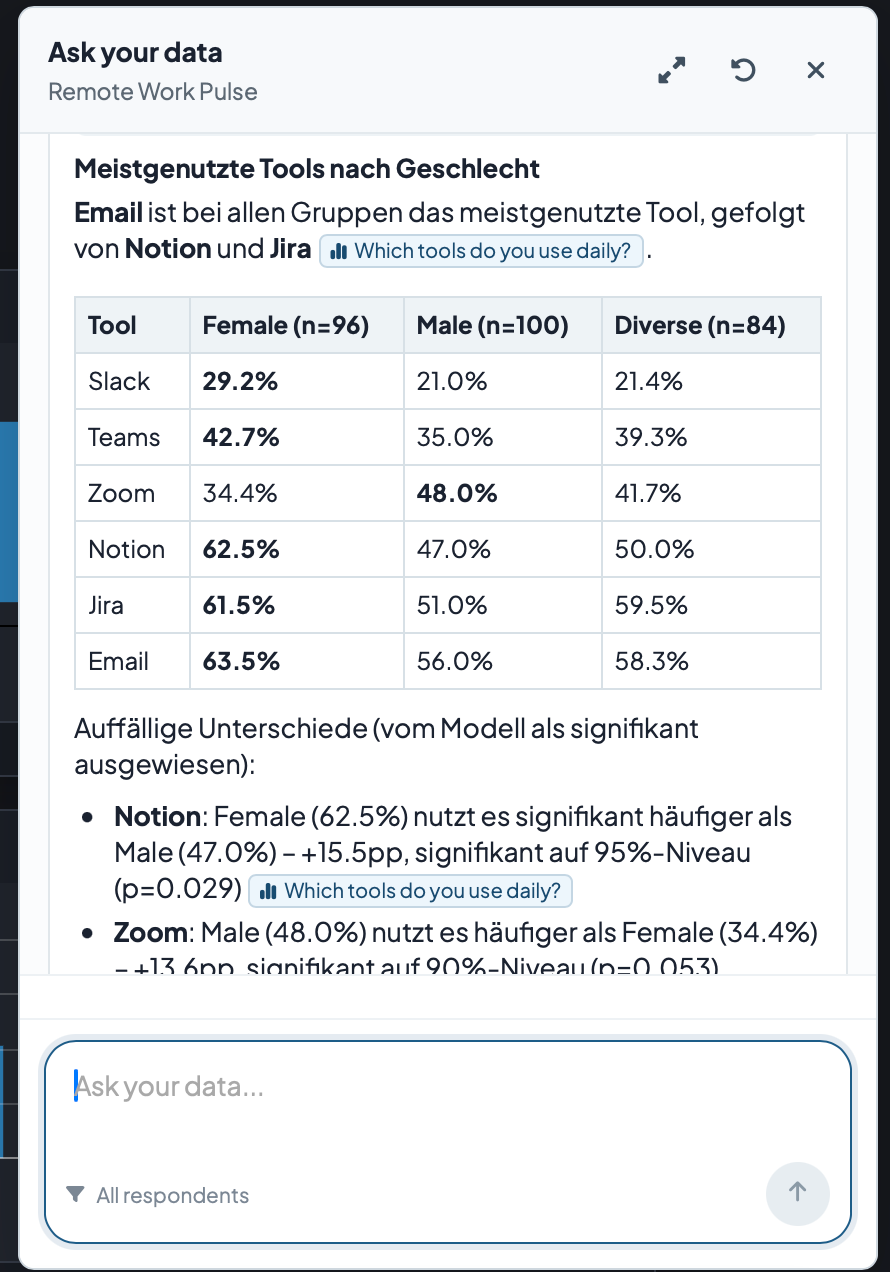
For every result table DataLion tests the columns pairwise against each other: a z-test for proportions, computed server-side, with a two-tailed p-value at 90 %, 95 % and 99 %. Groups below a minimum base are not tested at all.
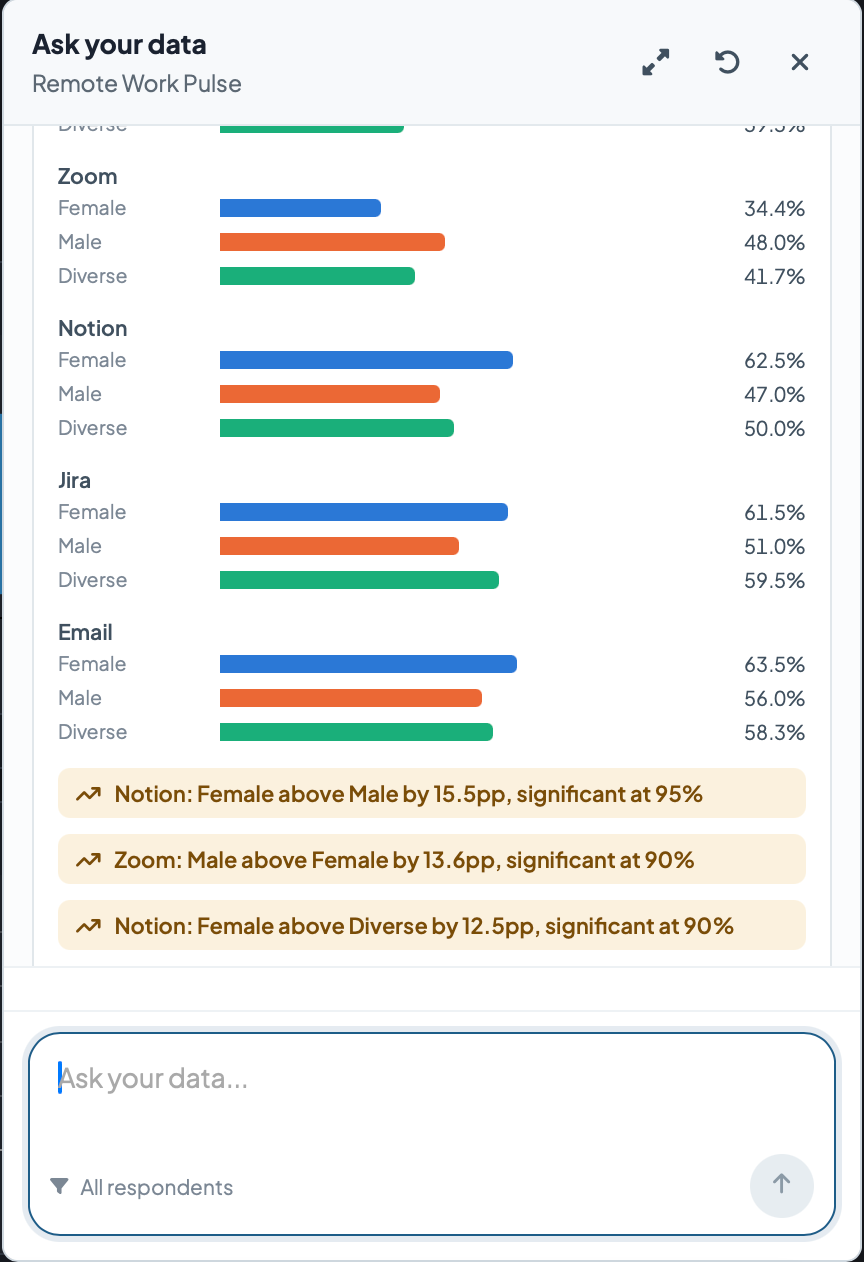
The most notable differences appear automatically as their own callouts under the answer — with direction, gap in percentage points and confidence level, for example "Notion: Female above Male by 15.5pp, significant at 95%".
The reverse case matters just as much: when a table cannot meaningfully be tested — because means rather than shares are being compared, say — the assistant says so instead of claiming significance. For how DataLion reports significance across the rest of the dashboard, see significance testing.
- z-test for proportions, computed server-side in DataLion
- 90 %, 95 % and 99 % levels with a p-value
- Minimum base: groups that are too small are not tested
- Tables that cannot be tested are named as such
Every number can be traced back
An answer you cannot check is worthless in reporting. So every answer opens with a "Read as" line that restates your question as the variable and breakdown actually analysed — you see immediately whether the AI understood you.
Then come the numbers, with case counts per column and a citation to the source chart: clicking it jumps to the matching widget on the dashboard and highlights it. "Show calculation" additionally reveals which variables, filters and bases were involved.
If a base is too thin to carry a statement, your project’s minimum case count kicks in: the assistant marks the result as directional only rather than selling it as a finding.
- "Read as" line: your question as the AI understood it
- Base n per column, right in the table
- Citation jumps to the chart on the dashboard
- Calculation receipt with variables, filters and bases
- Your project’s minimum case count is respected
The assistant answers questions — it changes nothing
The panel is deliberately read-only: it cannot create a chart, save a filter or rebuild a dashboard. If you want a closer look at a group, you get a suggestion to click — the filter applies only on your click.
Numbers are computed with your permissions and your access profile: the assistant runs inside your session, so the same row-level filters apply as on the dashboard. It has no access to individual respondents’ raw data — it only ever sees aggregated result tables.
The panel is open to logged-in users with view rights. It does not appear in public share links, embeds or exports.
- No write access: no charts, no filters, no dashboards
- Numbers computed with your permissions and access profile
- No access to individual respondents’ raw data
- Not in public links, embeds or exports
You choose the provider and the endpoint
"Ask your data" uses the same AI connection as the rest of the platform. You can point it at your own model, key and endpoint — see bring your own AI model — instead of being tied to one vendor.
The panel’s interface ships in six languages, and answers come back in the language of your question. Your project data stays in ISO 27001-certified data centers in Germany.
- Your own model, API key and endpoint
- Same AI configuration as sentiment analysis and AI translation
- Panel interface in six languages
- ISO 27001-certified hosting in Germany, GDPR-compliant
See DataLion with your own data
Start free with your own raw data. Or book a personal demo of the path to a finished dashboard.
What users say about DataLion
- via G2
The embedding function allows us to generate insights of our data for our audience and customers by far less than half of the usual time needed before.
Verified user · Leisure, Travel & Tourism - via G2
User-friendliness, especially for market research topics. Structured backend with many customization options.
Verified user · Market Research - via G2
The contacts at DataLion are very committed. If you have problems, you can count on help. DataLion reacts quickly to requests for new functions.
Robert Q. · Managing Director - via G2
Very professional company, attentive to the customer needs, provider of a great software and service.
Generoso M. · CRM Analyst, Automotive

We now work much more efficiently, giving us more time to take care of the derivations and insights from the data for the customers.
Analysis, evidence and AI
Common questions about Ask your data
Does the AI make numbers up?
Do my dashboard filters apply to questions too?
Who decides whether a difference is significant?
Does the AI see my respondents’ raw data?
Can the assistant build charts or dashboards?
Do roles and access profiles apply?
Which language model is behind it?
Let your dashboard answer
Try DataLion free and ask your first question — or get a demo of how the AI proves significance instead of claiming it.