Use case: tracking studies
Update tracking studies automatically
The codebook defines variables, nets and formulas once. DataLion imports and recodes new waves automatically. Timelines support smoothing, wave-over-wave significance and consistent weighting. ISO 27001-certified hosting, GDPR-compliant, made in Munich.
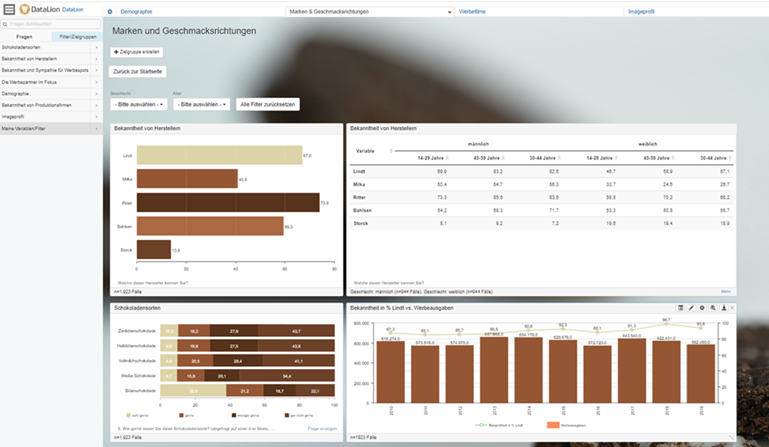
In DataLion, the codebook defines variables, value labels, net rows and formulas once. New waves are imported and recoded automatically. This keeps the analysis consistent across waves. Timelines can be smoothed with SMA/EMA. Wave-over-wave differences are tested at 80–99%. Weighting stays consistent per subgroup.
- 🇩🇪 Made in Munich
- GDPR-compliant
- DPA included
- Hosted in Germany
- 🌐 Interface in EN, DE, FR & NL
Trusted by research institutes, brands & insights teams
- scheduled automatic wave import
- SMA/EMA/WMA smoothing & projection
- 80–99% wave-over-wave significance
- auto-recode consistent variables
Why tracking waves eat so much time
- Every wave is re-imported, recoded and the deck rebuilt by hand.
- Manual recoding introduces errors that only surface late.
- Changes get interpreted without testing for significance.
Defined once, computed every wave
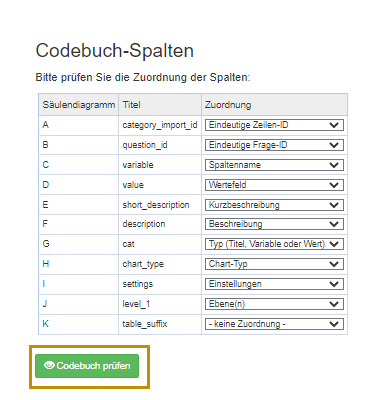
In the codebook, define variables, value labels, custom net rows and derived metrics as formulas. DataLion computes top and bottom boxes automatically for every scale question. This definition applies to every new wave. KPIs such as NPS or funnel conversion always follow the same logic.
New waves arrive through scheduled imports and are recoded automatically (multi-response to 0/1, recodes, nets). Manual recoding for each wave is not required.
- Codebook defines variables, nets & formulas once
- Scheduled imports for new waves
- Automatic recoding (recodeMax/recodeBinary)
- KPIs computed consistently wave after wave
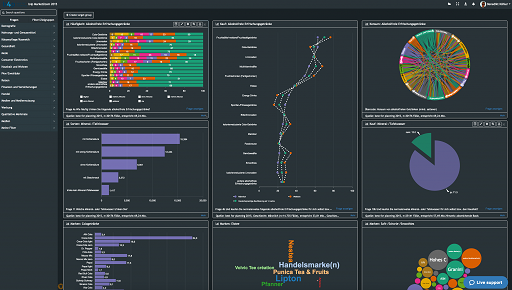
Timelines with SMA, WMA and EMA smoothing
Show the trend as a timeline. For smoothing, use a moving average (SMA) or an exponentially weighted average (EMA) with a freely chosen window.
For projections, use SMA, WMA and EMA plus moving sums. This presents trends, sampling noise and outliers separately.
- SMA/EMA smoothing with a freely chosen window
- Projection via SMA, WMA and EMA
- Moving sums for cumulative trends
- Trend vs. noise cleanly separated
Real change or chance?
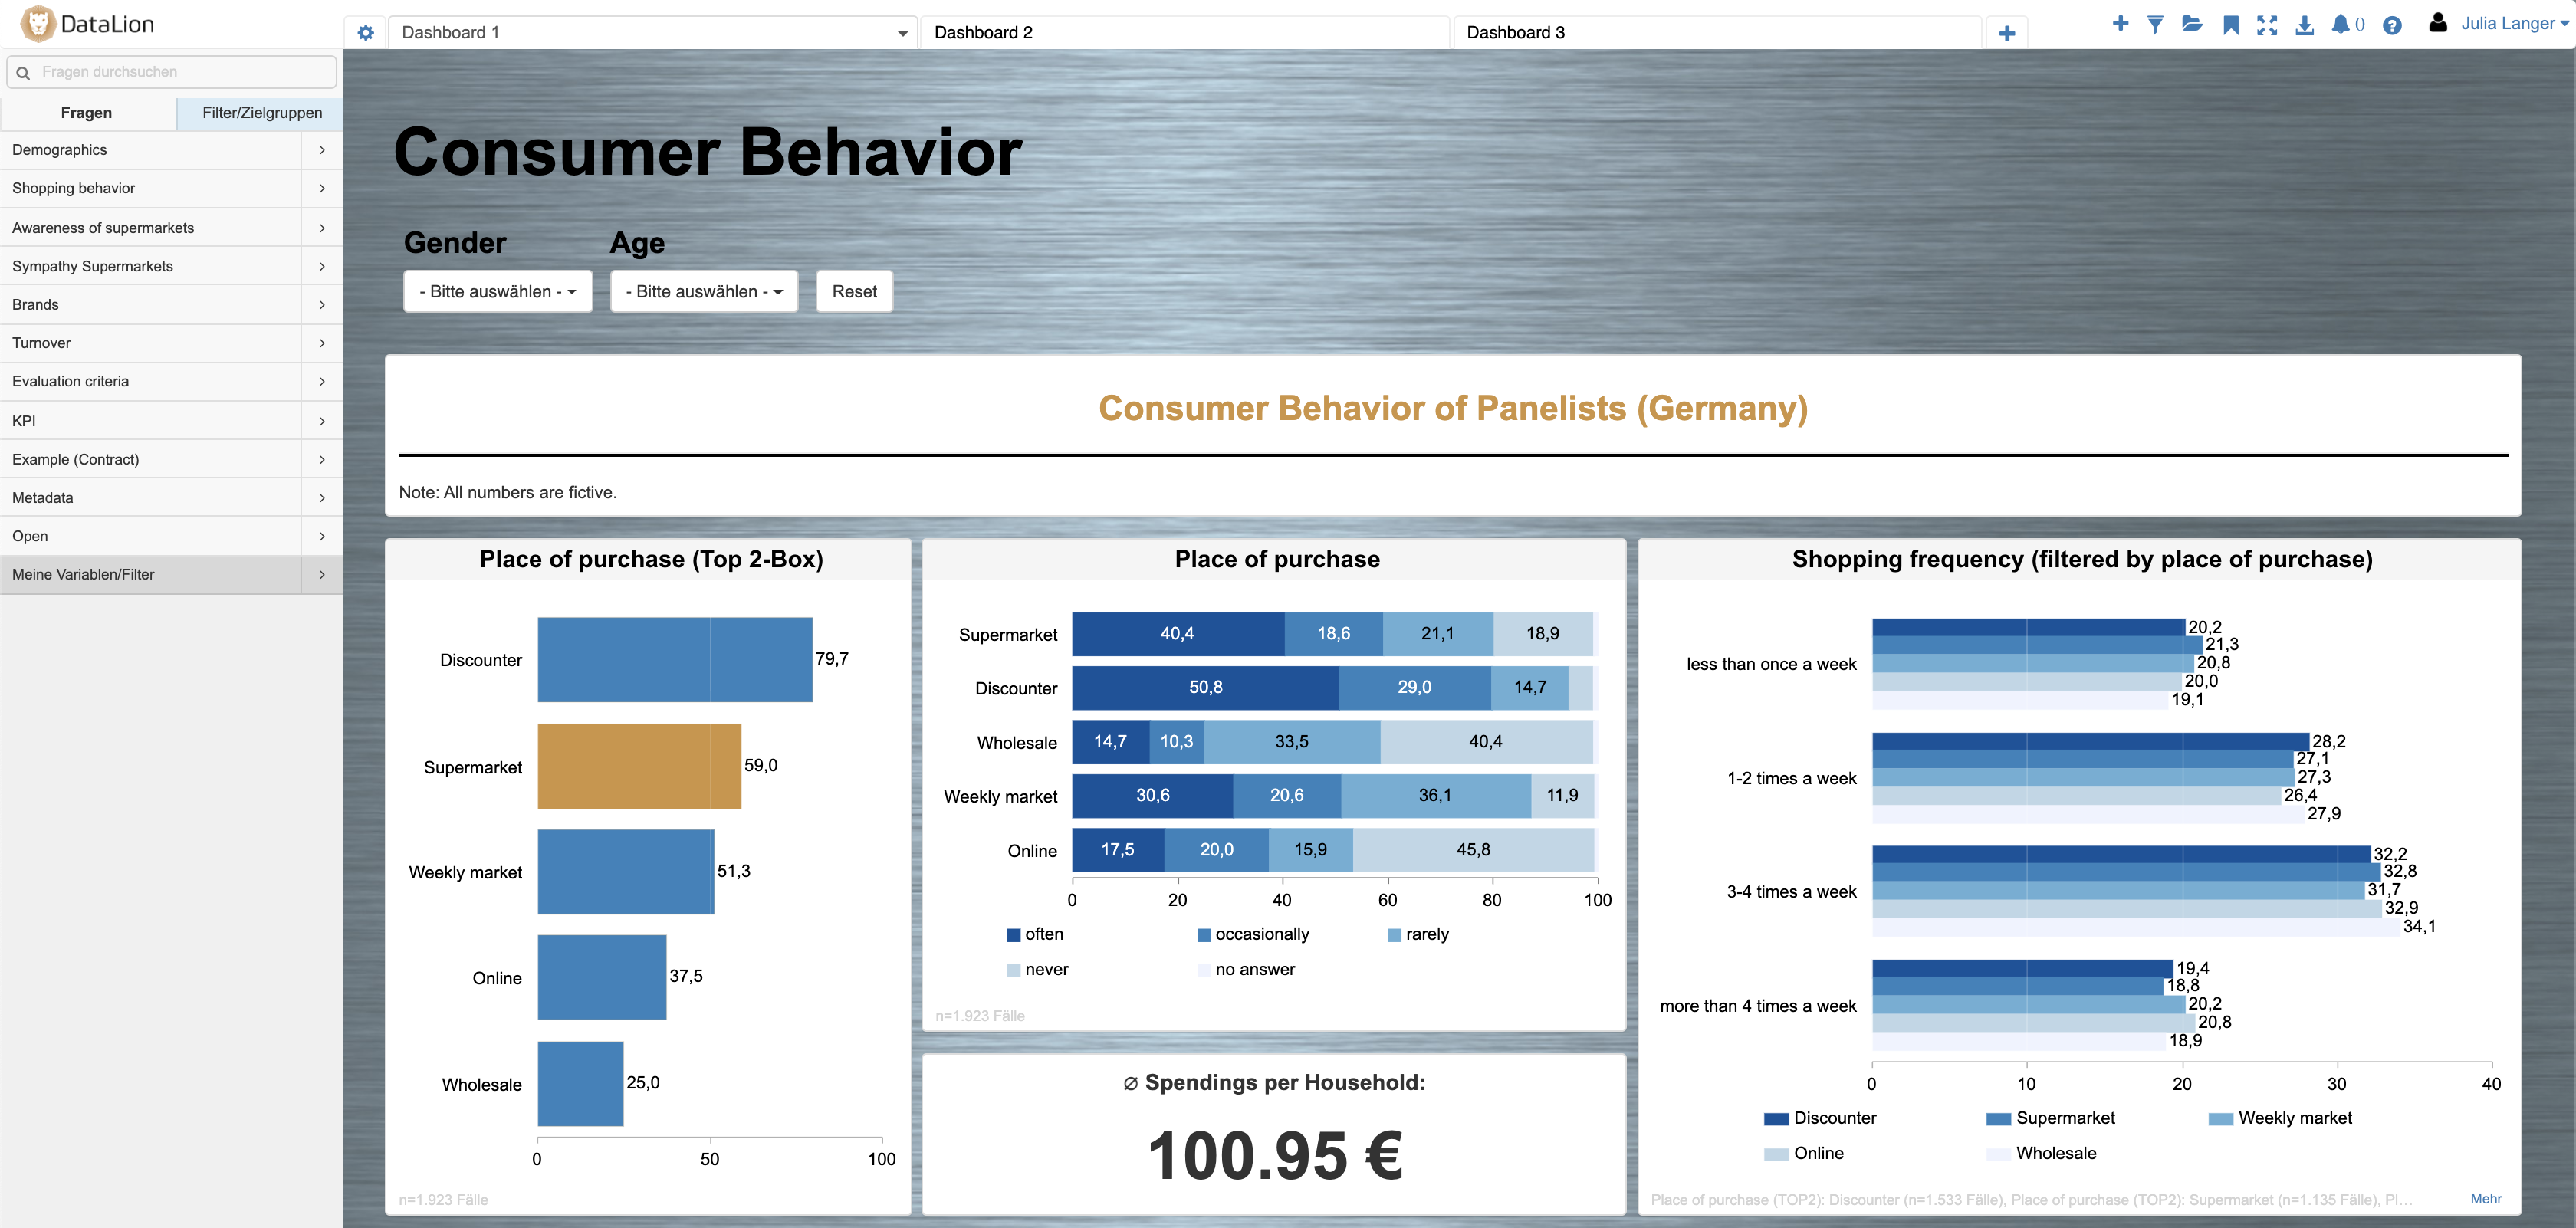
DataLion checks right in the table whether an increase is statistically reliable. Wave-over-wave and segment differences are tested at 80%, 90%, 95% and 99% via z, chi² or t-test and shown as stars or letters.
Nested tables keep the analysis consistent even across many waves and subgroups.
- Wave-over-wave and segment significance
- z, chi² and t-test, pairwise and complement
- Confidence at 80/90/95/99%
- Nested tables, consistent across waves
Weighting in every wave
To keep waves comparable, you weight to your sample frame. Weighting is recalculated automatically on every filter change, so each subgroup is correctly weighted in every wave.
Weights come from the dataset, from a separate table, or are computed in DataLion to a target distribution — more on data preparation.
- Weighting consistent per subgroup and wave
- Recalculated on filter change
- Weights from dataset, table or computed
- Weighted bases per question
Brand, NPS and KPI tracking
The same engine carries any recurring study type: brand tracking with funnel and image, NPS tracking over time, or a continuous customer and KPI tracker.
The only difference is the metrics in the codebook — the mechanics of auto-import, smoothing, significance and weighting stay the same.
- Brand tracking: funnel & image over time
- NPS tracking: score and drivers wave after wave
- Customer and KPI tracking for portals
- Multi-client ready for institutes and agencies
What you can build with DataLion
See DataLion with your own data
Start free with your own raw data. Or book a personal demo of the path to a finished dashboard.
What users say about DataLion
- via G2
Very professional company, attentive to the customer needs, provider of a great software and service.
Generoso M. · CRM Analyst, Automotive - via G2
The contacts at DataLion are very committed. If you have problems, you can count on help. DataLion reacts quickly to requests for new functions.
Robert Q. · Managing Director - via G2
User-friendliness, especially for market research topics. Structured backend with many customization options.
Verified user · Market Research - via G2
The embedding function allows us to generate insights of our data for our audience and customers by far less than half of the usual time needed before.
Verified user · Leisure, Travel & Tourism

We now work much more efficiently, giving us more time to take care of the derivations and insights from the data for the customers.
The platform in detail
Go deeper
Common questions about tracking studies
How does a tracking study stay consistent across waves?
Which smoothing methods are available for the trend?
Is wave-over-wave change significance-tested?
Does weighting stay consistent across waves?
Is this suitable for institutes and agencies?
Ready to automate your tracking waves?
Try DataLion free with your own tracking study — codebook defined once, every wave automatic. Or book a personal demo.