Dashboard design
Build dashboards by drag & drop
Assemble complete dashboards block by block — no IT, no programming. Drag charts, text boxes and media onto a flexible grid, embed rich text and SQL, and save favourites to reuse them.
DataLion's drag-and-drop dashboard builder lets you assemble complete dashboards visually — with no IT and no programming. You drag charts, text boxes and media onto a flexible grid, embed rich text and SQL queries, and save recurring building blocks as favourites for reuse.
- 🇩🇪 Made in Munich
- GDPR-compliant
- DPA included
- Hosted in Germany
- 🌐 Interface in EN, DE, FR & NL
Trusted by research, insights & media teams
- 50+ interactive chart types
- 20+ statistical methods
- SPSS · Excel · CSV import without data loss
- ISO 27001 certified data centers (Germany)
Dashboards stall in the IT queue
- Every layout tweak goes through a ticket — and you wait days just to move a tile.
- Standard BI tools demand data models and code before the first chart even appears.
- Logos, copy and context end up in PowerPoint because the dashboard cannot carry them.
Drag building blocks instead of writing code
You build your dashboard by drag & drop: drag charts, tables, filters, text boxes and media onto a flexible grid, move them into place and resize them to fit. No IT, no programming.
From the first empty tab to a finished management dashboard, everything stays in the browser — what you add appears instantly, exactly as your users will see it.
- Place charts, tables and filters freely
- Move and resize tiles with the mouse
- A flexible grid keeps the blocks tidy
- Live preview — what you build is visible at once
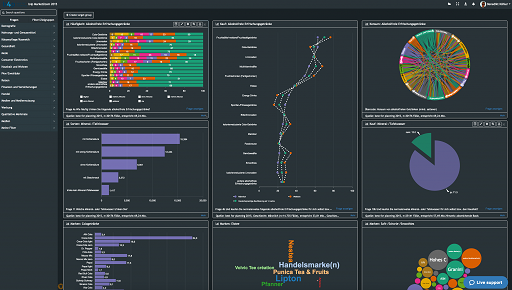
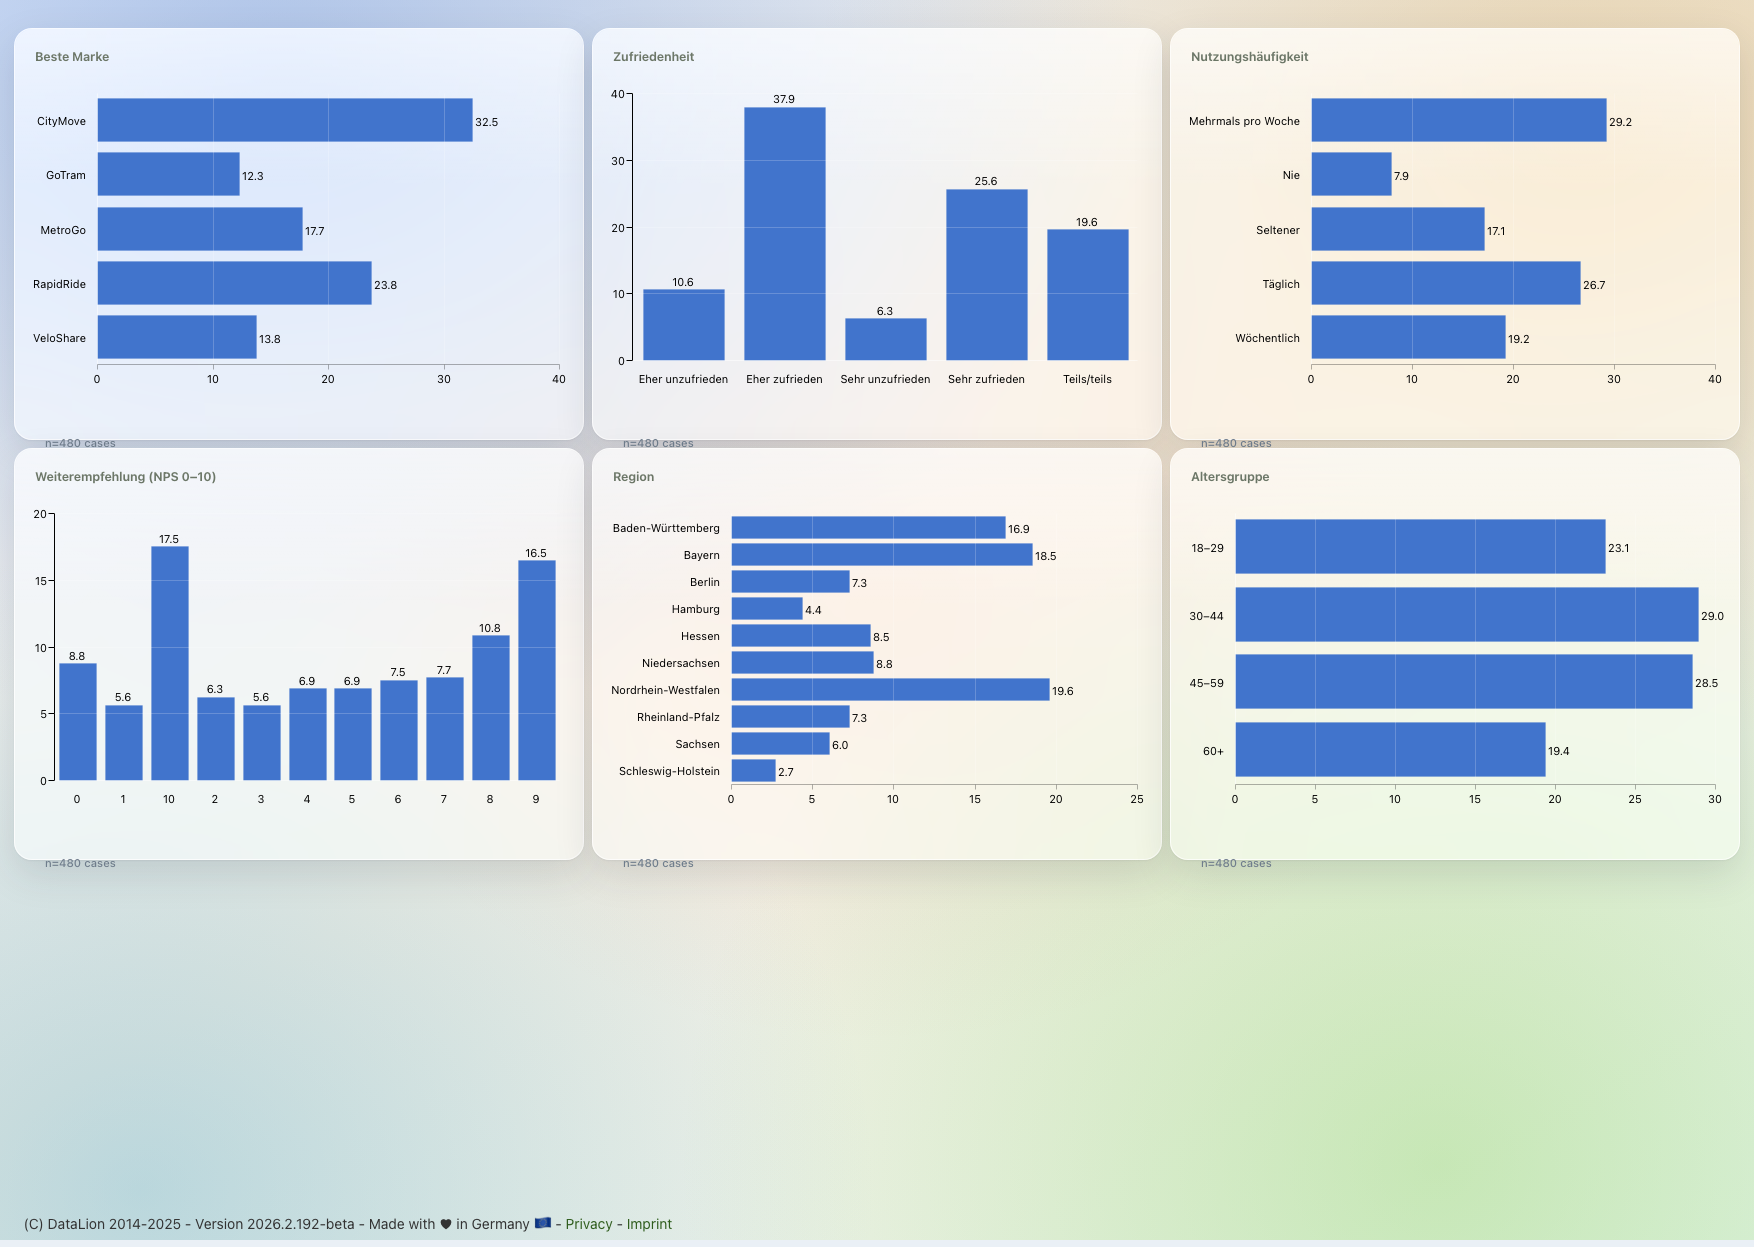
Every visualization right in the builder
Reach 50+ interactive chart types straight from the builder — from bars, lines and donut to heatmap, chord and network charts, word clouds and maps.
Pick the right type, assign the question and arrange the chart freely. Save recurring chart types, filter settings and entire dashboards as favourites and reuse them in your next project with a single click.
- 50+ interactive chart types, no add-on module
- Pick a chart type, assign a question, done
- Save chart types and filter settings as favourites
- Reuse whole dashboards as a template
Text boxes with rich text — and SQL
Explain, annotate and structure your dashboard with text boxes. The rich-text (WYSIWYG) editor offers formatting, lists and embedded media — and for power users the source-code view adds fine control via CSS, HTML and JS.
Best of all: you can embed SQL queries directly in a text box. That lets you show live metrics as running text — e.g. "{{= AVG(satisfaction)}} points on average" — inside the dashboard, always current to the filter selection.
- WYSIWYG editor with formatting and lists
- Embed SQL queries directly in a text box
- Source-code view for CSS, HTML and JS
- Live metrics as running text in the dashboard
Embed logos, images and media
Upload media once to your project, then drag it into the dashboard: logos, images and icons for your brand, plus audio, video and PDF for richer stories.
DataLion handles the common formats — jpg, jpeg, png, gif and svg for images, mp3, mp4 and webm for multimedia, PDF for documents, and your own fonts (otf, woff, woff2, ttf, eot). Your dashboard becomes a showcase in your corporate design.
- Place images, logos and icons freely
- Embed audio, video and PDF
- Image formats jpg, jpeg, png, gif, svg
- Custom fonts for a CI-compliant layout
From builder to a shared report
A dashboard built in the builder is never static: your users filter live and drill down into the detail. With interactive filters and design & themes it becomes a tool anyone can operate themselves.
Who can see and edit the dashboard is governed by roles & permissions. Then you export the same content as natively editable PowerPoint, Excel or PDF — without copy-and-paste.
See DataLion with your own data
Start a free trial or book a personal demo — from raw data to a finished dashboard.
What users say about DataLion
- via G2
Very professional company, attentive to the customer needs, provider of a great software and service.
Generoso M. · CRM Analyst, Automotive - via G2
The contacts at DataLion are very committed. If you have problems, you can count on help. DataLion reacts quickly to requests for new functions.
Robert Q. · Managing Director - via G2
User-friendliness, especially for market research topics. Structured backend with many customization options.
Verified user · Market Research - via G2
The embedding function allows us to generate insights of our data for our audience and customers by far less than half of the usual time needed before.
Verified user · Leisure, Travel & Tourism

We now work much more efficiently, giving us more time to take care of the derivations and insights from the data for the customers.
More dashboard features
Guides in the help center
Common questions about the dashboard builder
Do I need coding skills to build a dashboard?
Can I add my own copy and explanations?
Can I embed live metrics in the text?
Which media can I load into a dashboard?
Can I reuse a dashboard I have built?
Build your first dashboard by drag & drop
Try DataLion free and drag your first chart onto the grid — or get a demo of how quickly a complete dashboard comes together.