Use case: brand tracking
Brand tracking with funnel, significance & drivers
Render the brand funnel as net rows. Test waves and competitors for significance, smooth the trend and use driver analysis to check which image dimensions move preference. ISO 27001-certified hosting, GDPR-compliant, made in Munich.
DataLion renders the brand funnel as net/top-box rows, from aided and unaided awareness to preference and loyalty. It tests wave and segment differences at confidence levels from 80% to 99%. You can smooth the trend with SMA/EMA. Image batteries feed a relative-importance analysis on the R engine. Data is weighted to your sample frame.
- 🇩🇪 Made in Munich
- GDPR-compliant
- DPA included
- Hosted in Germany
- 🌐 Interface in EN, DE, FR & NL
Trusted by research institutes, brands & insights teams
- aided + unaided awareness measured
- 80–99% significance levels
- SMA / EMA trend smoothing
- weighting to your sample frame
Why brand tracking loses its punch
- Every wave is rebuilt from scratch in SPSS, Excel and PowerPoint — error-prone and slow.
- Changes get celebrated without testing whether they are significant.
- Image gets measured but is never distilled into clear drivers of preference.
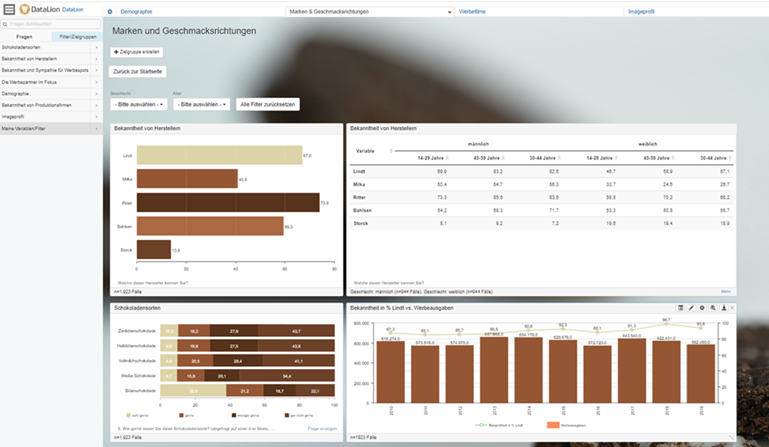
The funnel as net and top-box rows
DataLion renders each funnel stage as a net/top-box row: unaided and aided awareness, consideration, usage, preference and loyalty. You also see percentages by row, column or base and conversion between stages.
Place several brands side by side as subcolumns. Your brand and the competition then sit in one table and follow the same logic in every wave.
- Unaided & aided awareness reported separately
- Funnel conversion via top-box/net rows
- Competitors as side-by-side subcolumns
- Percent by row, column and base
Every wave and segment, tested
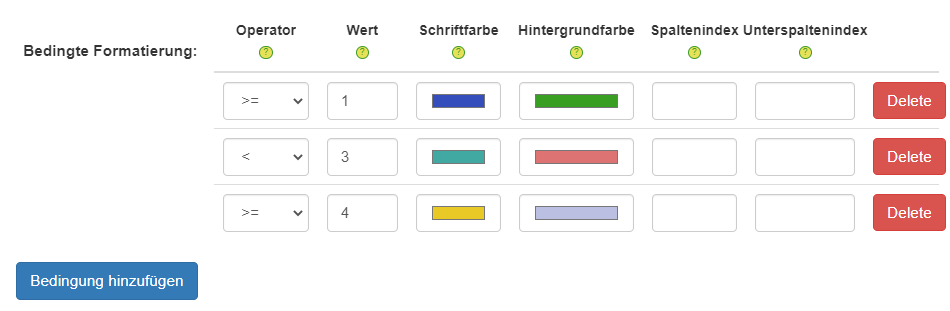
DataLion checks right in the table whether a gain is statistically reliable. Differences between waves, brands or audiences are tested at 80%, 90%, 95% and 99% and shown as stars or letters.
Behind the scenes run the z-test and chi² test (pairwise and complement, with an optional Yates correction) — the procedures that make brand tracking defensible.
- Wave, brand and segment differences tested
- Confidence at 80/90/95/99%, stars or letters
- z-test and chi² test, pairwise and complement
- Optional Yates correction
Automatic wave import with smoothing
Set the tracking up once. New waves are imported and recoded automatically, so variables stay consistent across every wave. This removes a common source of error in manual tracking.
Show the trend as a timeline and smooth it with SMA or EMA at a freely chosen window, to separate sampling noise from the real brand trend.
- Automatic import and recoding of new waves
- Variables consistent across all waves
- Timelines with SMA/EMA smoothing
- More on tracking studies
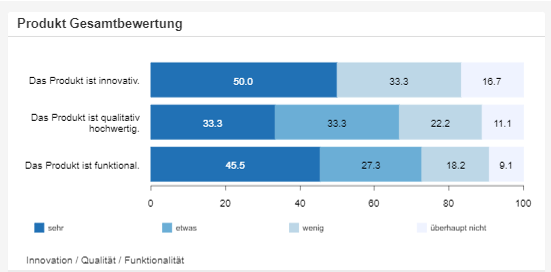
Distill image batteries into drivers
Measure brand image through matrix/Likert batteries and show it as a polarity profile, heatmap or stacked chart — per brand and segment.
With relative-importance analysis on the R engine you find which image dimensions most strongly drive preference and advocacy — the basis for clear brand decisions.
- Image via matrix/Likert batteries
- Polarity profiles, heatmaps, stacked charts
- Relative importance: which dimensions drive preference
- Complemented by regressions on R
Weighted to your sample frame
Brand tracking needs a representative sample. In DataLion you weight to your sample frame. The weights come from the dataset, from a separate weights table (via a join), or are computed in DataLion for a target distribution.
Weighting is recalculated automatically when filters change, so every subgroup stays correctly weighted.
- Weights from the dataset, a separate table or computed
- Several weight variables per project
- Recalculated on filter change
- Weighted bases per question and category
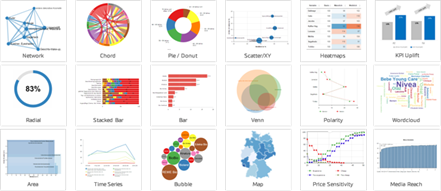
What you can build with DataLion
See DataLion with your own data
Start free with your own raw data. Or book a personal demo of the path to a finished dashboard.
What users say about DataLion
- via G2
Very professional company, attentive to the customer needs, provider of a great software and service.
Generoso M. · CRM Analyst, Automotive - via G2
The contacts at DataLion are very committed. If you have problems, you can count on help. DataLion reacts quickly to requests for new functions.
Robert Q. · Managing Director - via G2
User-friendliness, especially for market research topics. Structured backend with many customization options.
Verified user · Market Research - via G2
The embedding function allows us to generate insights of our data for our audience and customers by far less than half of the usual time needed before.
Verified user · Leisure, Travel & Tourism

We now work much more efficiently, giving us more time to take care of the derivations and insights from the data for the customers.
The platform in detail
Go deeper
Common questions about brand tracking
How does DataLion render the brand funnel?
Are wave and competitor differences significance-tested?
How does tracking across waves work?
Can I see which image dimensions drive preference?
Can I weight to my sample frame?
Ready for defensible brand tracking?
Try DataLion free with your own brand study — from the funnel through significance to driver analysis. Or book a personal demo.