
Solution for market research
The end-to-end platform for market research
Surveys, preparation, statistics, interactive dashboards and native PowerPoint reports run in one software. Built by market researchers for market researchers. ISO 27001-certified hosting, GDPR-compliant, made in Munich.
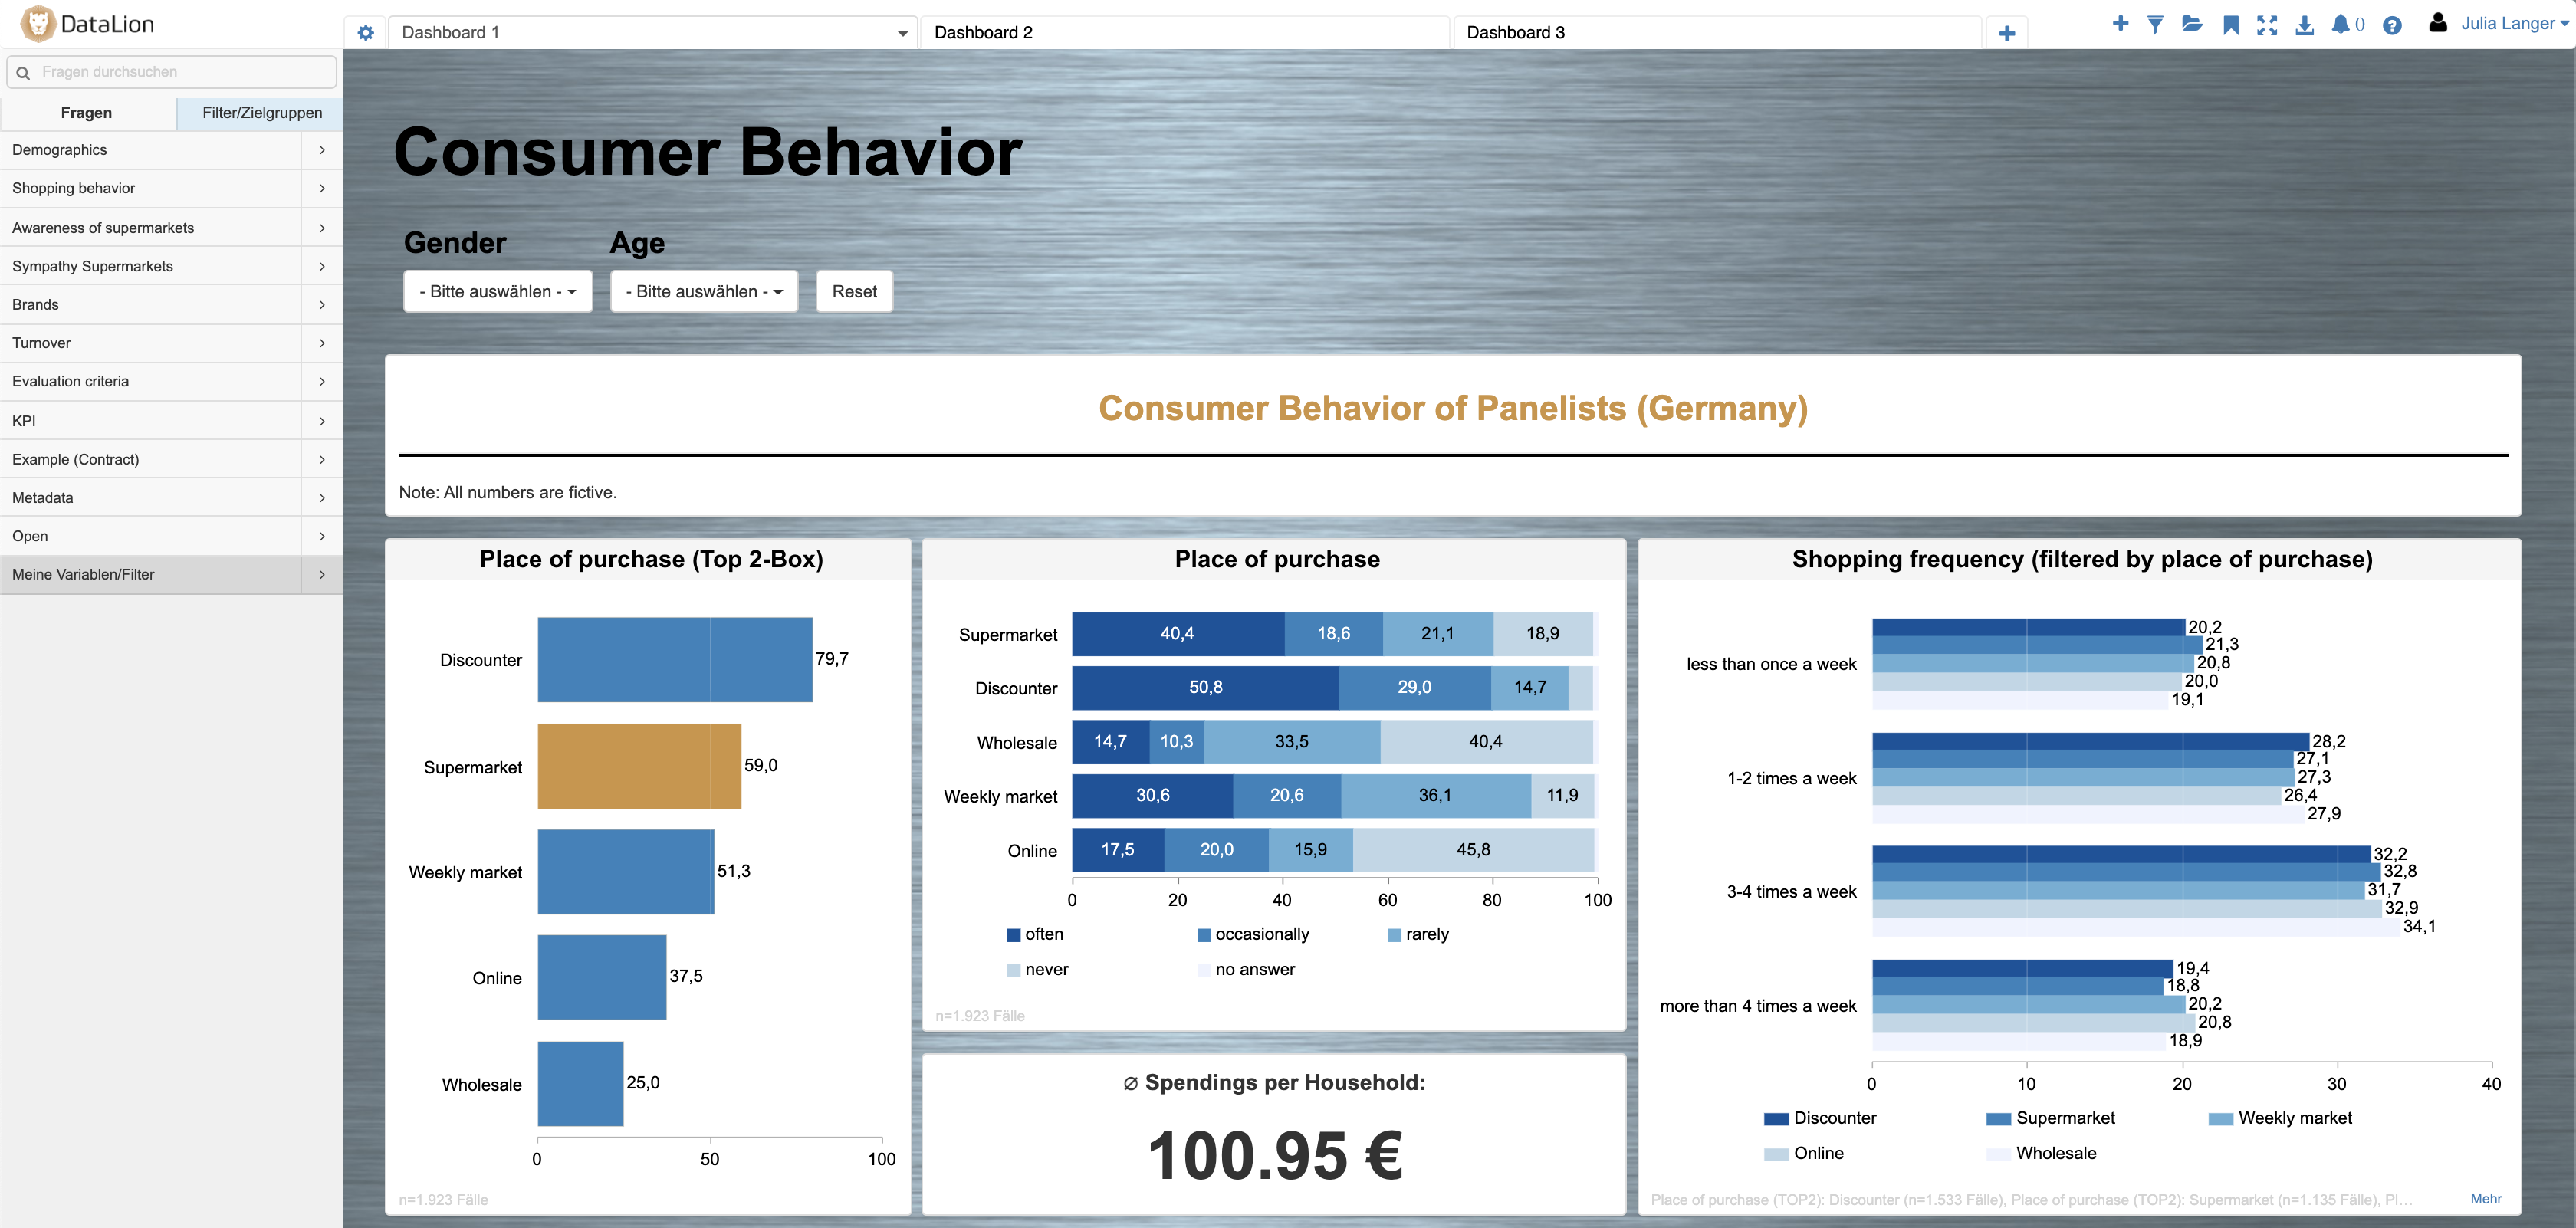
DataLion is a web-based market research platform made in Munich. It covers surveys, data preparation, statistics, interactive dashboards and automated reports. Market researchers built it around their own workflows. The platform includes 50+ chart types and native PowerPoint export. DataLion is GDPR-compliant and runs in ISO 27001-certified data centers.
- 🇩🇪 Made in Munich
- GDPR-compliant
- DPA included
- Hosted in Germany
- 🌐 Interface in EN, DE, FR, ES, IT & NL
Trusted by research institutes, brands & insights teams






- 50+ interactive chart types
- 20+ statistical methods
- SPSS · Excel · CSV import without data loss
- ISO 27001 certified data centers (Germany)
The market research reporting bottleneck
- Data lives in four tools — survey platform, SPSS, Excel, PowerPoint — and every wave means re-exporting and rebuilding.
- Clients want to explore the data themselves, but all you can send is a static PDF.
- Tracking studies eat days of manual chart-building that should go into insight.
From survey to report without switching tools
Many market research projects spread collection, preparation, charts and presentation across four tools. DataLion brings these steps together in one platform. Each step builds on the previous one, with no export and no media break.
The workflow has the following steps. Each has its own page with the full detail:
- Survey software: questionnaires with 32 question types plus description blocks — answers become analysis-ready variables automatically.
- Data import & integration: SPSS incl. labels, CSV, Excel, ASCII and databases.
- Data preparation: weight, clean, recode — directly on the dataset.
- Analysis & statistics: 20+ procedures on an R engine incl. significance tests.
- Dashboard software: interactive dashboards and reports in one click.
Dashboards built by drag & drop
Assemble dashboards by drag & drop. Your internal and external clients filter live, open details through drill-downs and compare waves across flexible time series.
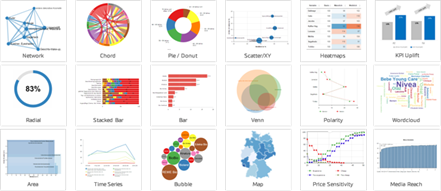
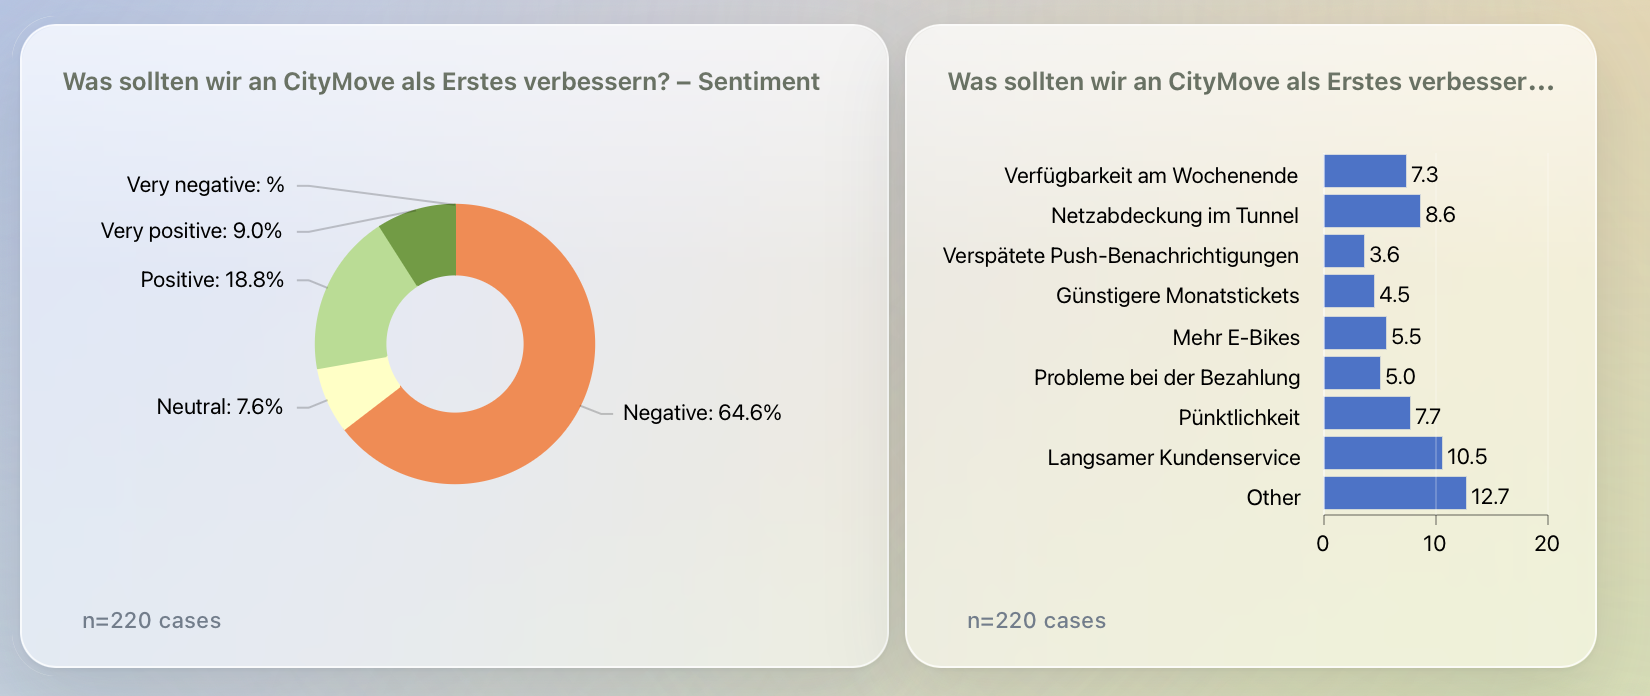
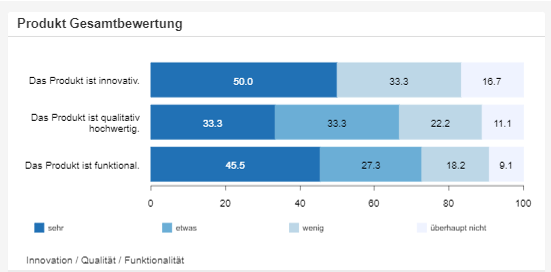
More than 50 interactive chart types cover standard charts and specialist research methods: bars, lines, donuts, network, chord and heatmap charts, plus MaxDiff, conjoint and price sensitivity.
- Dashboards by drag & drop, not programming
- Interactive filters & drill-downs in real time
- 50+ chart types incl. MaxDiff, conjoint & heatmaps
- For tracking, ad-hoc and panel data
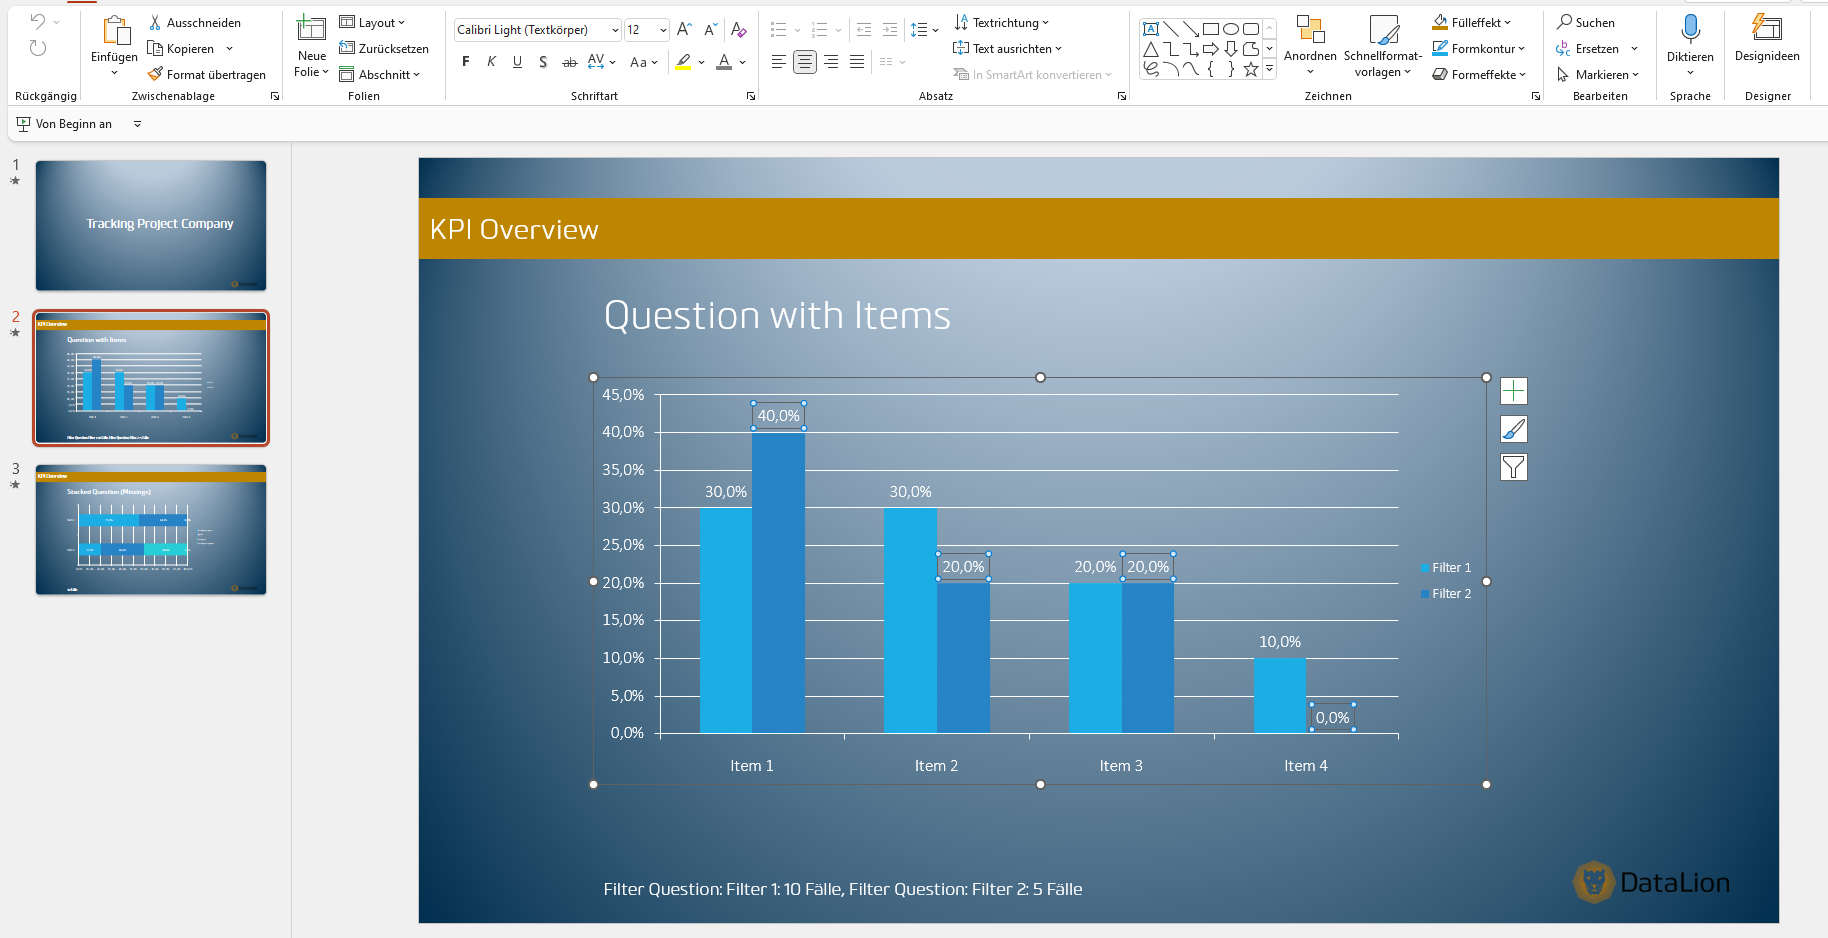
Native PowerPoint export in your CI
Export reports as natively editable PowerPoint with any number of slides. Charts are inserted as real PowerPoint diagrams. Your own PowerPoint master controls layout and design.
After setup, reports refresh as new data arrives. Continuous tracking studies can be imported and updated automatically, including variable recoding.
- Real PowerPoint diagrams with your own master
- Flexible Excel report books, PDF, CSV & JPEG
- Reports refresh automatically — wave after wave
- Embedded live dashboards for website & portal
Weighting, statistics & open-ended responses
Handle weighting, flexible bases, recoding and the AI-powered analysis of open-ended responses (sentiment & topics) directly in DataLion. You do not need SPSS or Excel for these steps.
For deeper analysis, 20+ statistical procedures run on an R engine. They include regression, driver analysis, ANOVA and significance tests at confidence levels from 80% to 99%.
- Weighting & flexible bases per question
- Recode and compute new variables
- Code open ends by sentiment & topic with AI
- Regression, driver analysis, ANOVA, significance tests
AI agents like Claude speed up research
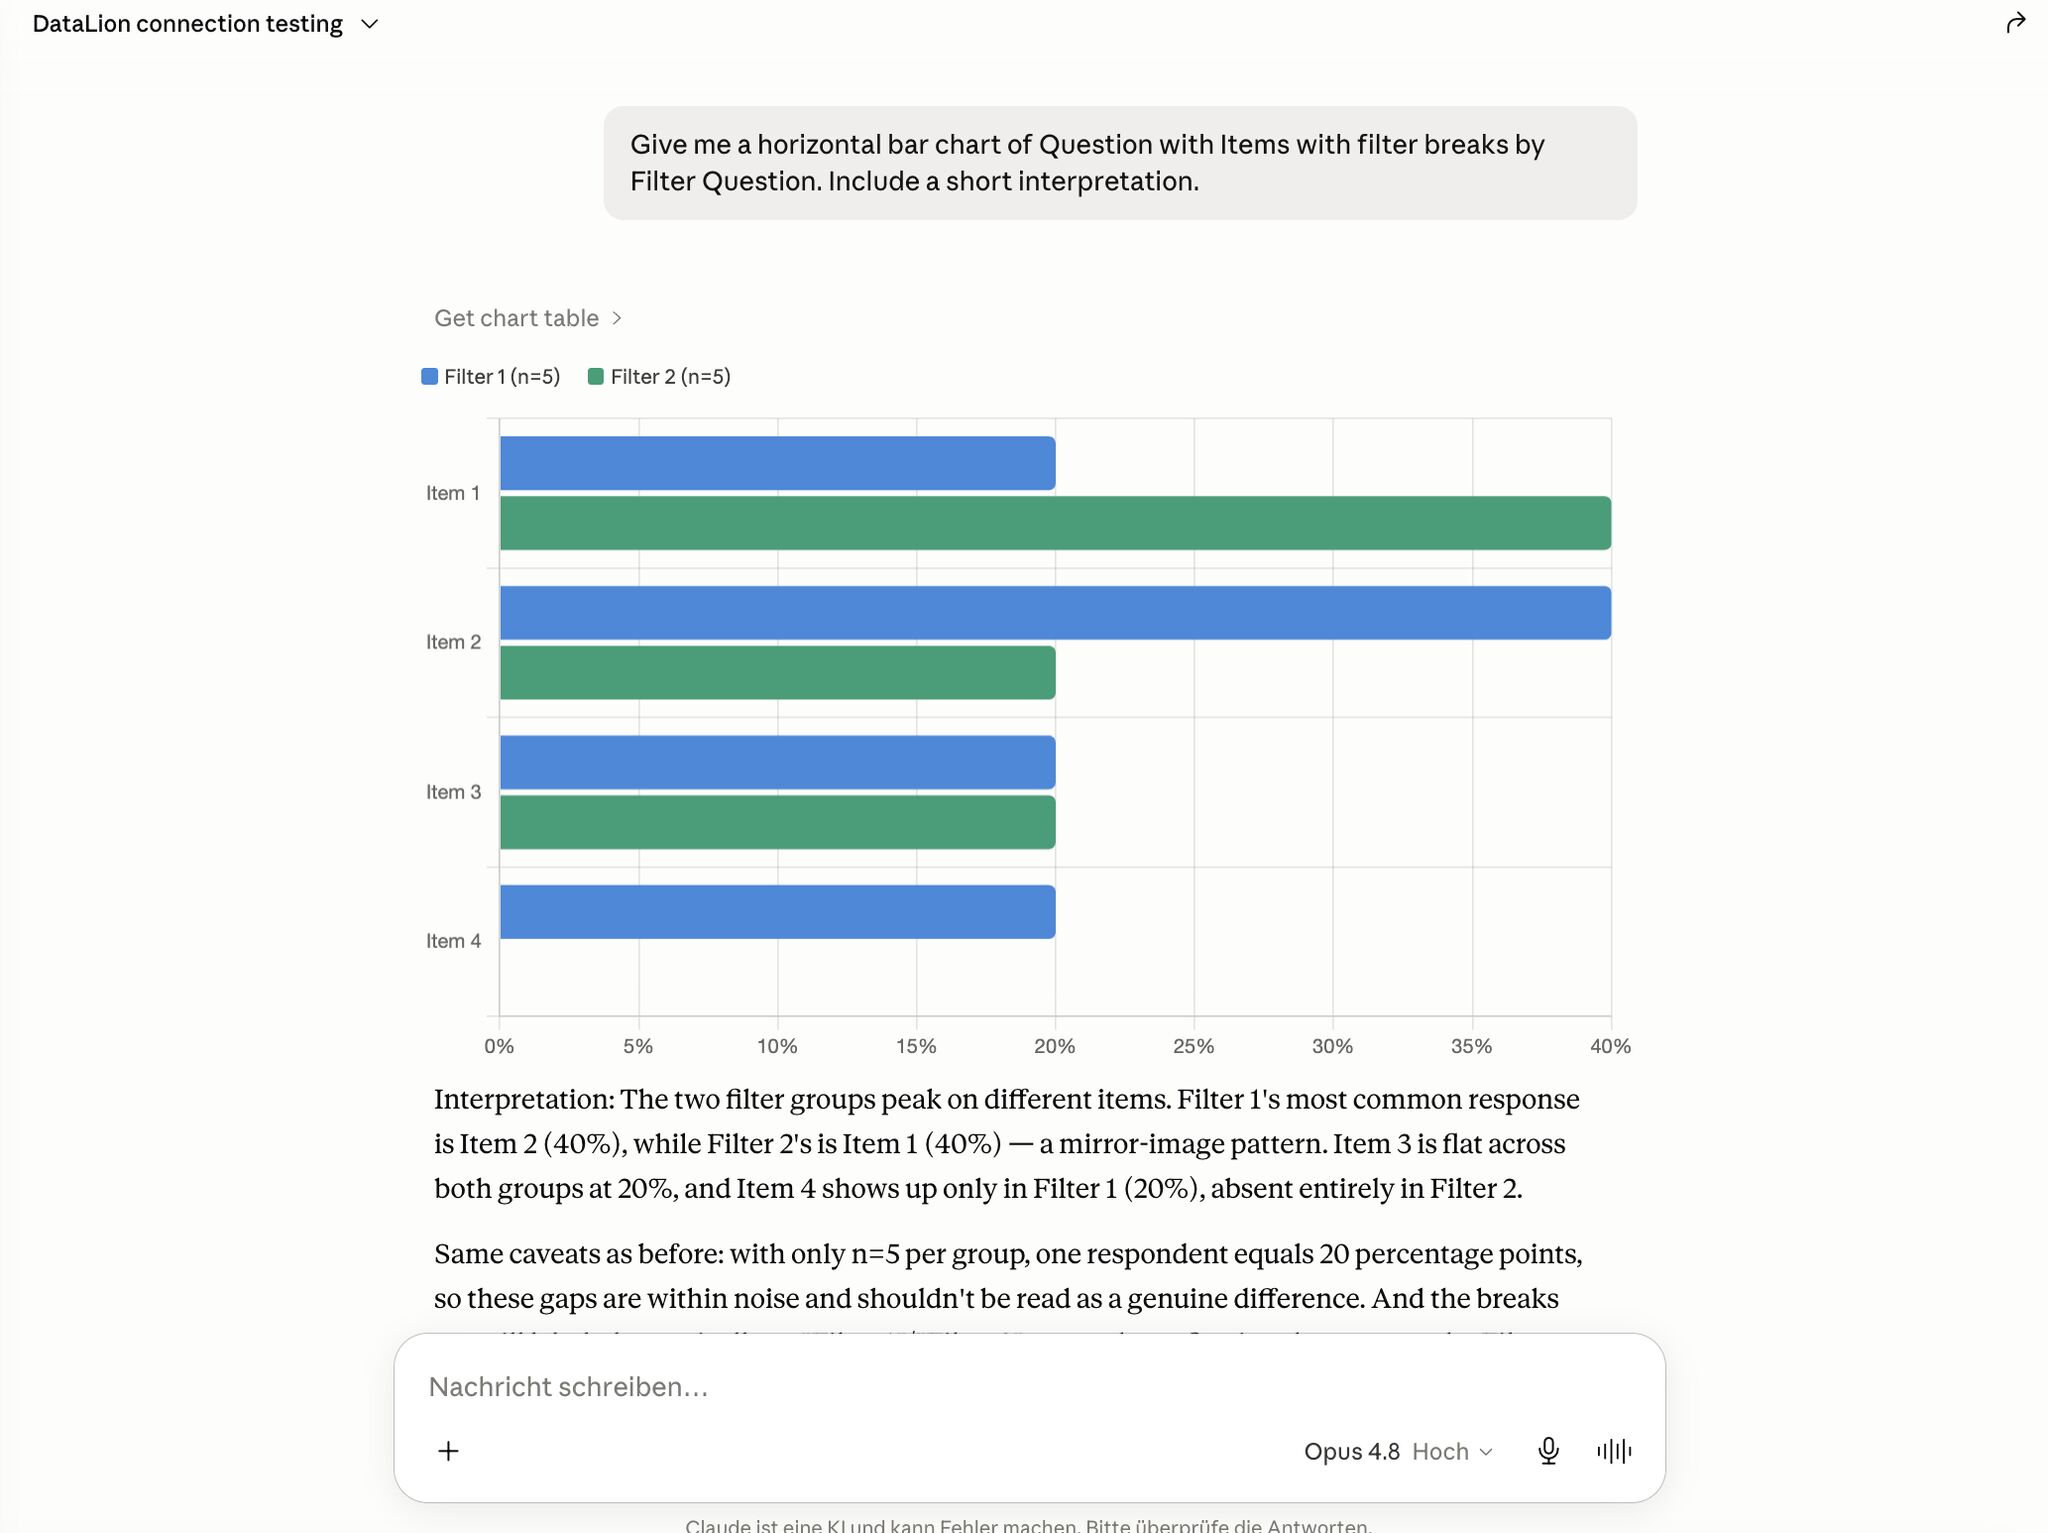
Through the Model Context Protocol (MCP), you connect DataLion to AI agents like Claude. In plain language, tell the agent to build dashboards, import data or create reports.
On import, AI-powered data recognition detects structures and metadata automatically and suggests matching codebook columns. Learn more on the AI market research page.
- MCP integration for Claude & other AI agents
- AI data recognition & automatic codebook mapping
- A new DataLion version every two weeks
Institutes, enterprises & agencies
DataLion supports market research institutes, in-house research teams and agencies. It is multi-client ready, adapts to your corporate design and controls rights and roles per team and client.
See it in practice in our Nielsen Sports customer success story. Your sensitive respondent data sits in ISO 27001-certified data centers in Germany. Operation is GDPR-compliant, a DPA is available and on-premise hosting is optional.
- Multi-client ready for agency & institute setups
- CI-compliant dashboards with themes, colors & CSS
- Rights & roles per user
- ISO 27001-certified hosting, GDPR, DPA included, on-premise available
What you can build with DataLion
See DataLion with your own data
Start free with your own raw data. Or book a personal demo of the path to a finished dashboard.
What users say about DataLion
- via G2
The embedding function allows us to generate insights of our data for our audience and customers by far less than half of the usual time needed before.
Verified user · Leisure, Travel & Tourism - via G2
User-friendliness, especially for market research topics. Structured backend with many customization options.
Verified user · Market Research - via G2
The contacts at DataLion are very committed. If you have problems, you can count on help. DataLion reacts quickly to requests for new functions.
Robert Q. · Managing Director - via G2
Very professional company, attentive to the customer needs, provider of a great software and service.
Generoso M. · CRM Analyst, Automotive

We now work much more efficiently, giving us more time to take care of the derivations and insights from the data for the customers.
The platform in detail
Common questions about the market research software
What makes DataLion an end-to-end market research platform?
Can I export reports natively to PowerPoint?
Is DataLion suitable for tracking studies?
Which data and formats can I import?
Which statistical procedures does DataLion offer?
Is DataLion GDPR-compliant and suitable for institutes?
Ready for market research in one platform?
Try DataLion free with your own data — from the survey to the finished dashboard. Or book a personal demo and see the platform live.