Trackers & timelines
Tracker dashboards that carry themselves forward
The codebook defines variables, nets and formulas once — each new wave imports and recodes automatically. Trends with real smoothing, wave-over-wave significance and a ready-made brand funnel tracker. ISO 27001-certified hosting, GDPR-compliant, made in Munich.
In a DataLion tracker dashboard the codebook defines variables, value labels, net rows and formulas once — and each new wave is imported and recoded automatically, so KPIs like NPS or funnel conversion stay consistent. The trend is shown with SMA/EMA smoothing, and wave-over-wave differences are tested at 80–99%.
- 🇩🇪 Made in Munich
- GDPR-compliant
- DPA included
- Hosted in Germany
- 🌐 Interface in EN, DE, FR & NL
Trusted by research, insights & media teams
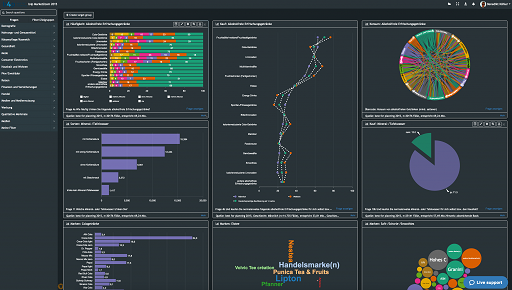
- 50+ interactive chart types
- 20+ statistical methods
- SPSS · Excel · CSV import without data loss
- ISO 27001 certified data centers (Germany)
Every wave costs the same manual work
- Every wave is re-imported, recoded and the dashboard rebuilt by hand.
- Manual recoding introduces errors that break comparability across waves.
- Changes get celebrated without testing whether they are even significant.
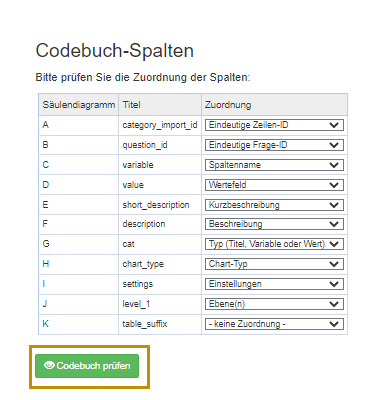
Defined once, computed every wave
In the codebook you define variables, value labels, net/top-box rows and derived metrics as formulas — once. That definition applies to every new wave, so KPIs like NPS or funnel conversion are computed consistently and automatically.
New waves come in via scheduled imports and are recoded automatically — multi-response to 0/1, recodes and nets. The most common source of error in tracking, recoding by hand each wave, is gone.
- Codebook defines variables, nets & formulas once
- Scheduled imports for new waves
- Automatic recoding (recodeMax/recodeBinary)
- KPIs computed consistently wave after wave
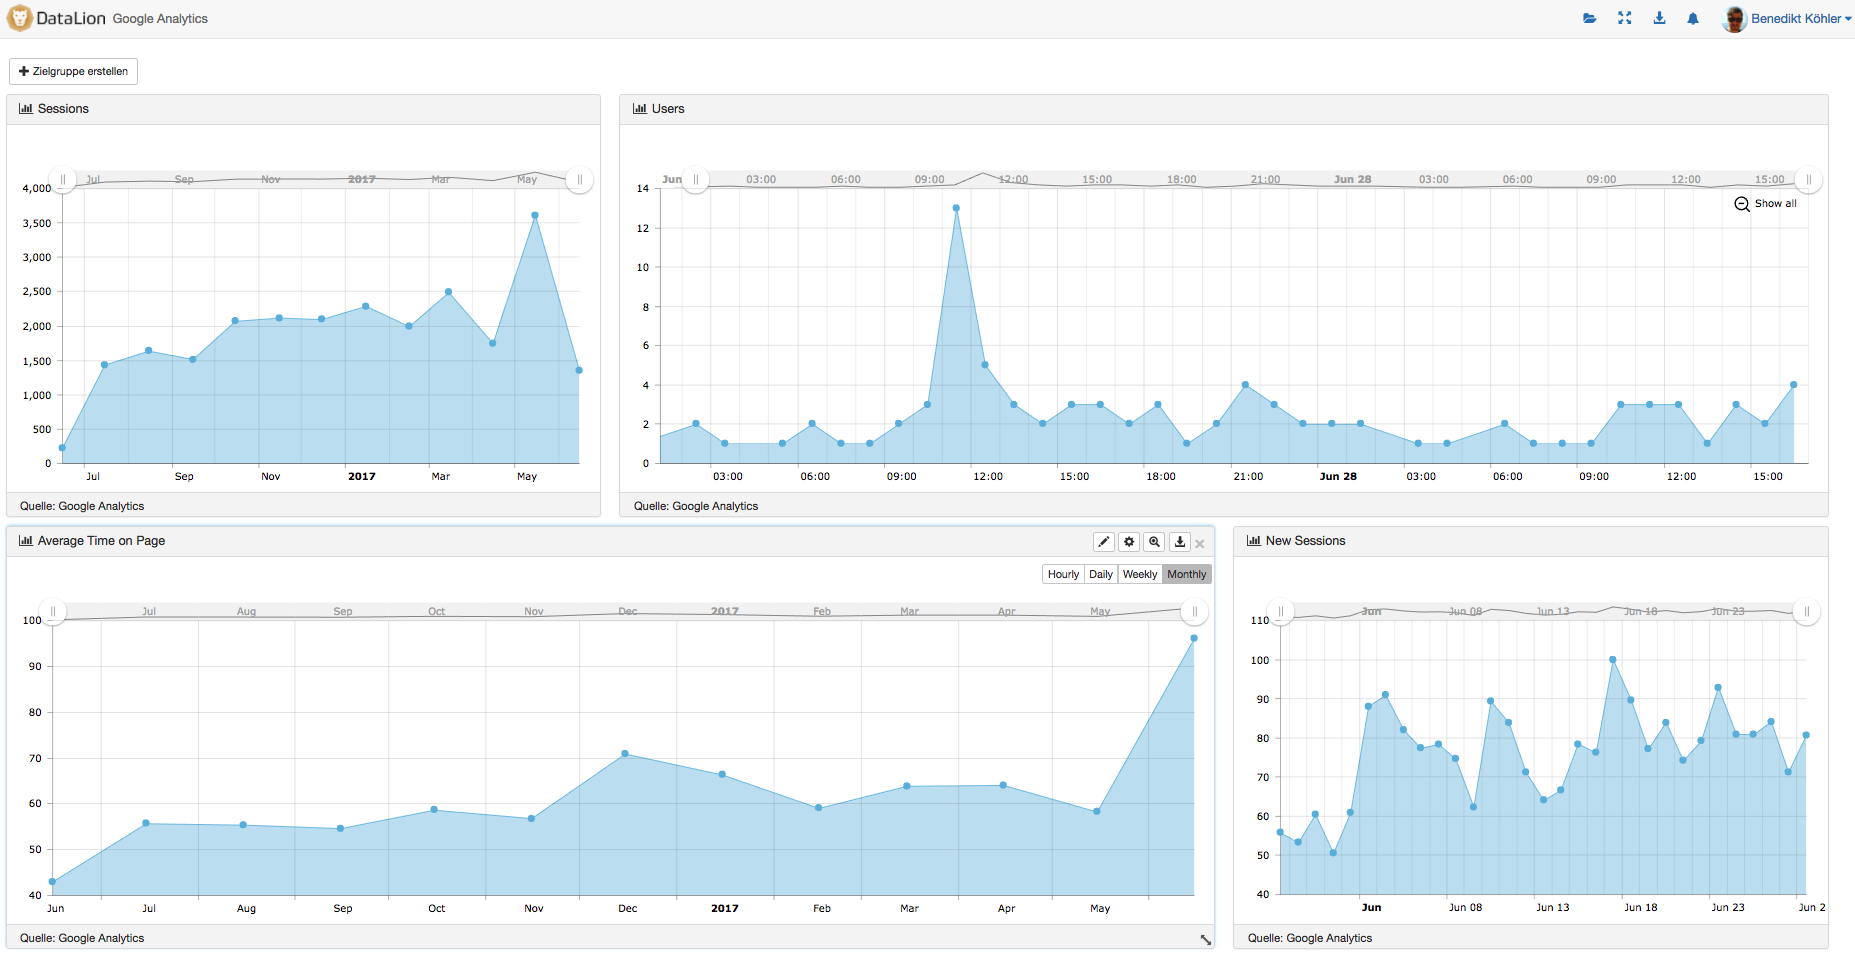
Timelines that separate signal from noise
Show the trend as a timeline and smooth it with a moving average (SMA) or an exponentially weighted average (EMA) — at a freely chosen window.
For projections, weighted and simple moving methods (SMA, WMA, EMA) and moving sums are available. So you separate the real trend from sampling noise and outliers — wave after wave.
- SMA/EMA smoothing with a freely chosen window
- Projection via SMA, WMA and EMA
- Moving sums for cumulative trends
- Trend vs. noise cleanly separated
Real change or chance?
Whether a metric really rose, DataLion checks right in the table: wave-over-wave and segment differences are tested at 80%, 90%, 95% and 99% via z, chi² or t-test and shown as stars or letters.
Nested tables keep the analysis consistent even across many waves and subgroups — and weighting is recalculated on every filter change, so each subgroup is correctly weighted in every wave.
- Wave-over-wave and segment significance
- z, chi² and t-test, pairwise and complement
- Confidence at 80/90/95/99%
- Weighting recalculated on filter change
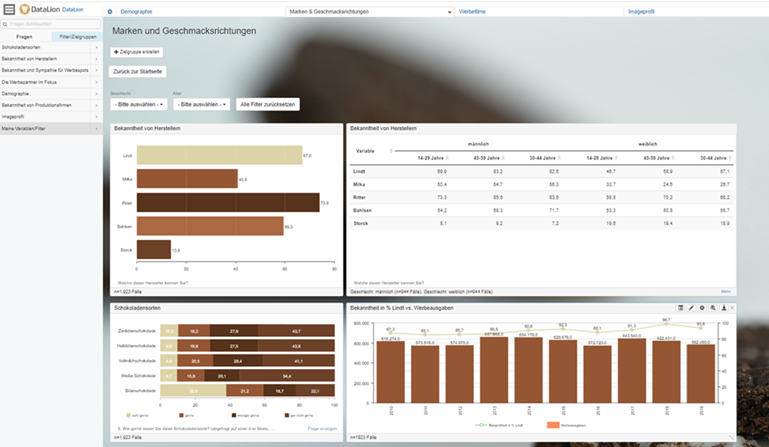
Brand funnel tracker from net rows
A classic use case is buildable straight away: the brand funnel tracker. Render unaided and aided awareness, consideration, usage, preference and loyalty as net/top-box rows and follow funnel conversion between the stages — wave after wave.
Several brands sit side by side as subcolumns. The full mechanics are covered on the tracking studies and brand tracking use-case pages.
- Aided & unaided awareness as net rows
- Funnel conversion via top-box/net rows
- Competitors as side-by-side subcolumns
- NPS or loyalty as a KPI in the same tracker
See DataLion with your own data
Start a free trial or book a personal demo — from raw data to a finished dashboard.
What users say about DataLion
- via G2
Very professional company, attentive to the customer needs, provider of a great software and service.
Generoso M. · CRM Analyst, Automotive - via G2
The contacts at DataLion are very committed. If you have problems, you can count on help. DataLion reacts quickly to requests for new functions.
Robert Q. · Managing Director - via G2
User-friendliness, especially for market research topics. Structured backend with many customization options.
Verified user · Market Research - via G2
The embedding function allows us to generate insights of our data for our audience and customers by far less than half of the usual time needed before.
Verified user · Leisure, Travel & Tourism

We now work much more efficiently, giving us more time to take care of the derivations and insights from the data for the customers.
More dashboard features
Guides in the help center
Common questions about tracker dashboards
How does a tracker dashboard stay consistent across waves?
Which smoothing is available for the trend?
Is wave-over-wave change significance-tested?
Can I build a brand funnel as a tracker?
Is this suitable for institutes and agencies?
Build your first self-advancing tracker
Try DataLion free with your own tracking study — codebook defined once, every wave automatic. Or book a personal demo.