Dashboard design
Interactive filters & drill-down in real time
Let your users play with the data: global filters, chart filters and benchmark dropdowns update in real time — with no reload. With drill-down they move from the overview into any detail.
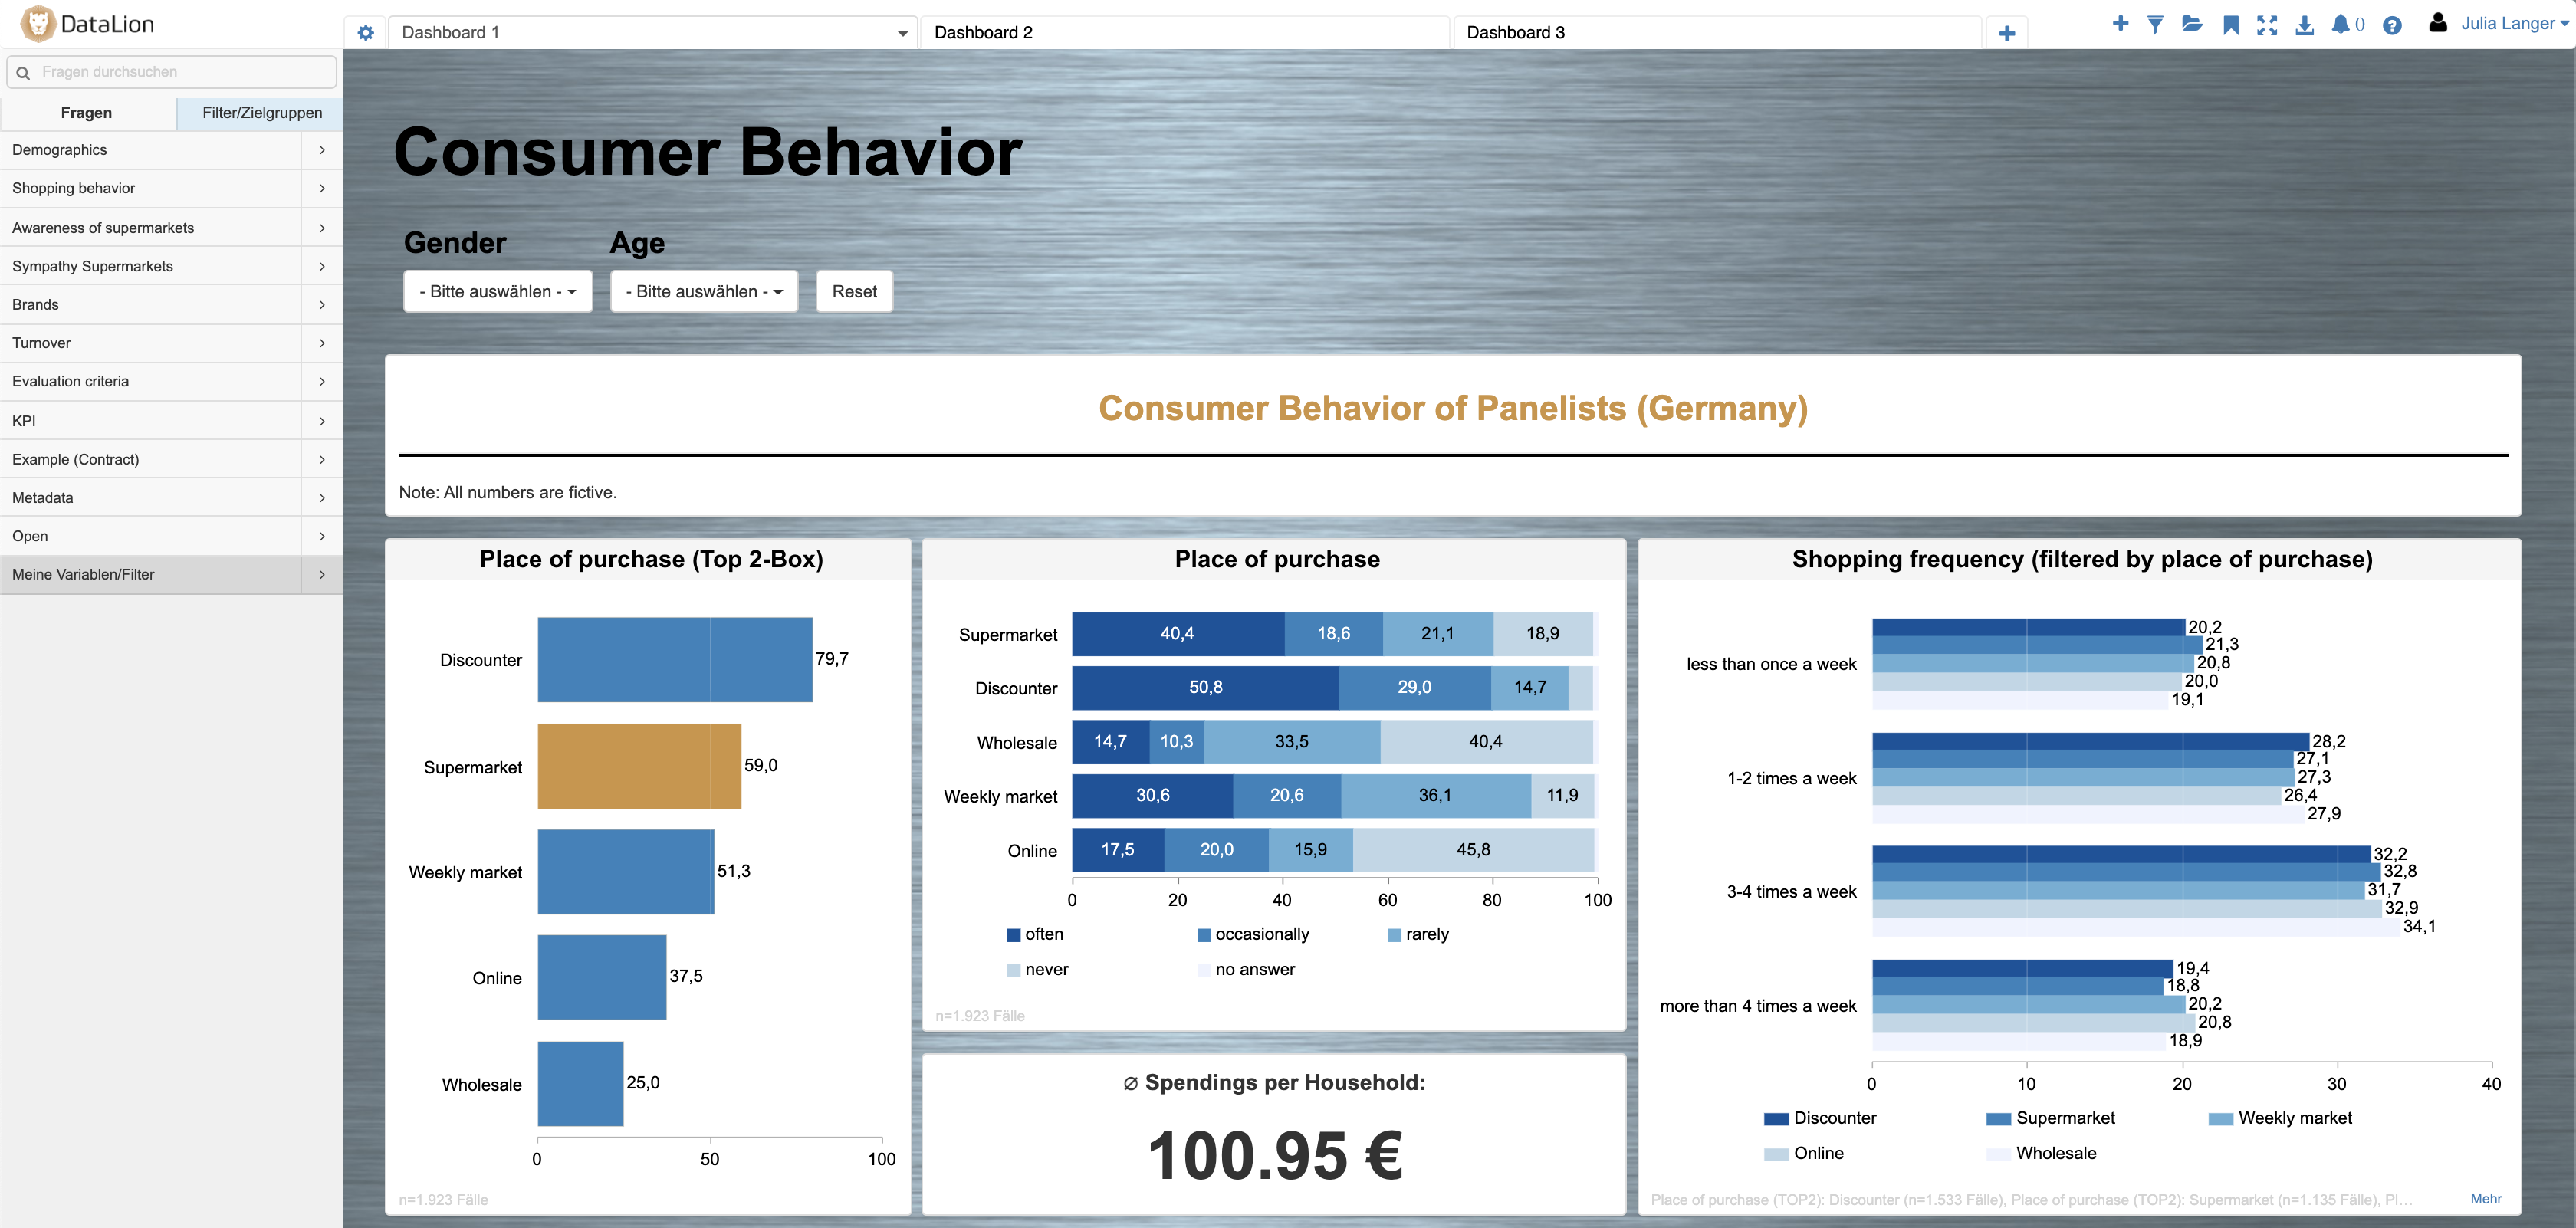
DataLion dashboards respond in real time: global filters, chart filters and benchmark dropdowns update every affected chart instantly — with no full-page reload. Benchmark filters render each selected value as its own column or row, and custom segments can be built and saved directly in the dashboard.
- 🇩🇪 Made in Munich
- GDPR-compliant
- DPA included
- Hosted in Germany
- 🌐 Interface in EN, DE, FR & NL
Trusted by research, insights & media teams
- 50+ interactive chart types
- 20+ statistical methods
- SPSS · Excel · CSV import without data loss
- ISO 27001 certified data centers (Germany)
Filters apply instantly — across the whole page
When a user sets a filter, the dashboard responds in real time: global filters, individual chart filters and benchmark dropdowns update every affected chart at once — without reloading the whole page.
By default a dynamic filter affects all charts on a dashboard. Need exceptions? Define them per chart — so a single diagram stays untouched while the rest filter along.
- Global filters for the whole dashboard
- Filters apply in real time, no page reload
- Per-chart filter menus and exceptions
- Optionally carry the selection across a report’s dashboards
Benchmark dropdowns: each group as its own column
A benchmark filter doesn't filter the data down — it sets it side by side: each selected value appears as its own column or row, one bar for "60+", one for "40–59", right next to each other.
Multi-select, by contrast, combines the values into one shared group via OR. So for each filter you decide whether your users segment, compare or build groups.
- Benchmark: each selection as a separate column/row
- Multi-select: values combined into one group via OR
- Single select: filter the data down to one value
- Cap the number of selectable options per filter
Define filters and segments yourself
In the filter editor you create filters by click and refine them via JSON. You build custom segments and target groups — such as "18–35" or "high-school diploma" — by combining values into new categories with AND/OR.
Self-built filters appear as their own dropdown to choose from, a reset button clears everything, and you set a default value per filter or — e.g. for "current year" — project-wide in the codebook, so every new wave fits automatically.
- Create filters by click, refine via JSON
- Custom segments via AND/OR into new categories
- Offer saved filters as their own dropdown
- Default values per filter or project-wide in the codebook
Drill-down — and self-explanatory dashboards
With drill-down your users click from the overall result down to a single group — without you building a separate dashboard for every question. That makes a dashboard self-explanatory: everyone finds their own answer.
Who can see and filter what is governed by roles & permissions and access profiles. It is all built in the drag-and-drop builder and styled with design & themes.
See DataLion with your own data
Start a free trial or book a personal demo — from raw data to a finished dashboard.
What users say about DataLion
- via G2
Very professional company, attentive to the customer needs, provider of a great software and service.
Generoso M. · CRM Analyst, Automotive - via G2
The contacts at DataLion are very committed. If you have problems, you can count on help. DataLion reacts quickly to requests for new functions.
Robert Q. · Managing Director - via G2
User-friendliness, especially for market research topics. Structured backend with many customization options.
Verified user · Market Research - via G2
The embedding function allows us to generate insights of our data for our audience and customers by far less than half of the usual time needed before.
Verified user · Leisure, Travel & Tourism

We now work much more efficiently, giving us more time to take care of the derivations and insights from the data for the customers.
More dashboard features
Common questions about filters & drill-down
Do dashboards reload when filtering?
What is the difference between benchmark and multi-select?
Can I build my own filters and audiences?
Does a filter always affect every chart?
Can I set default values for filters?
Make your dashboards interactive
Try DataLion free and build your first real-time filter — or get a demo of how benchmarks and drill-downs work.