Reports & sharing
Build reports that refresh themselves
Bundle multiple tabs and widgets into one report — and set it up just once. After that, dashboards and reports refresh automatically, wave after wave. Export as native PowerPoint, an Excel report book or PDF.
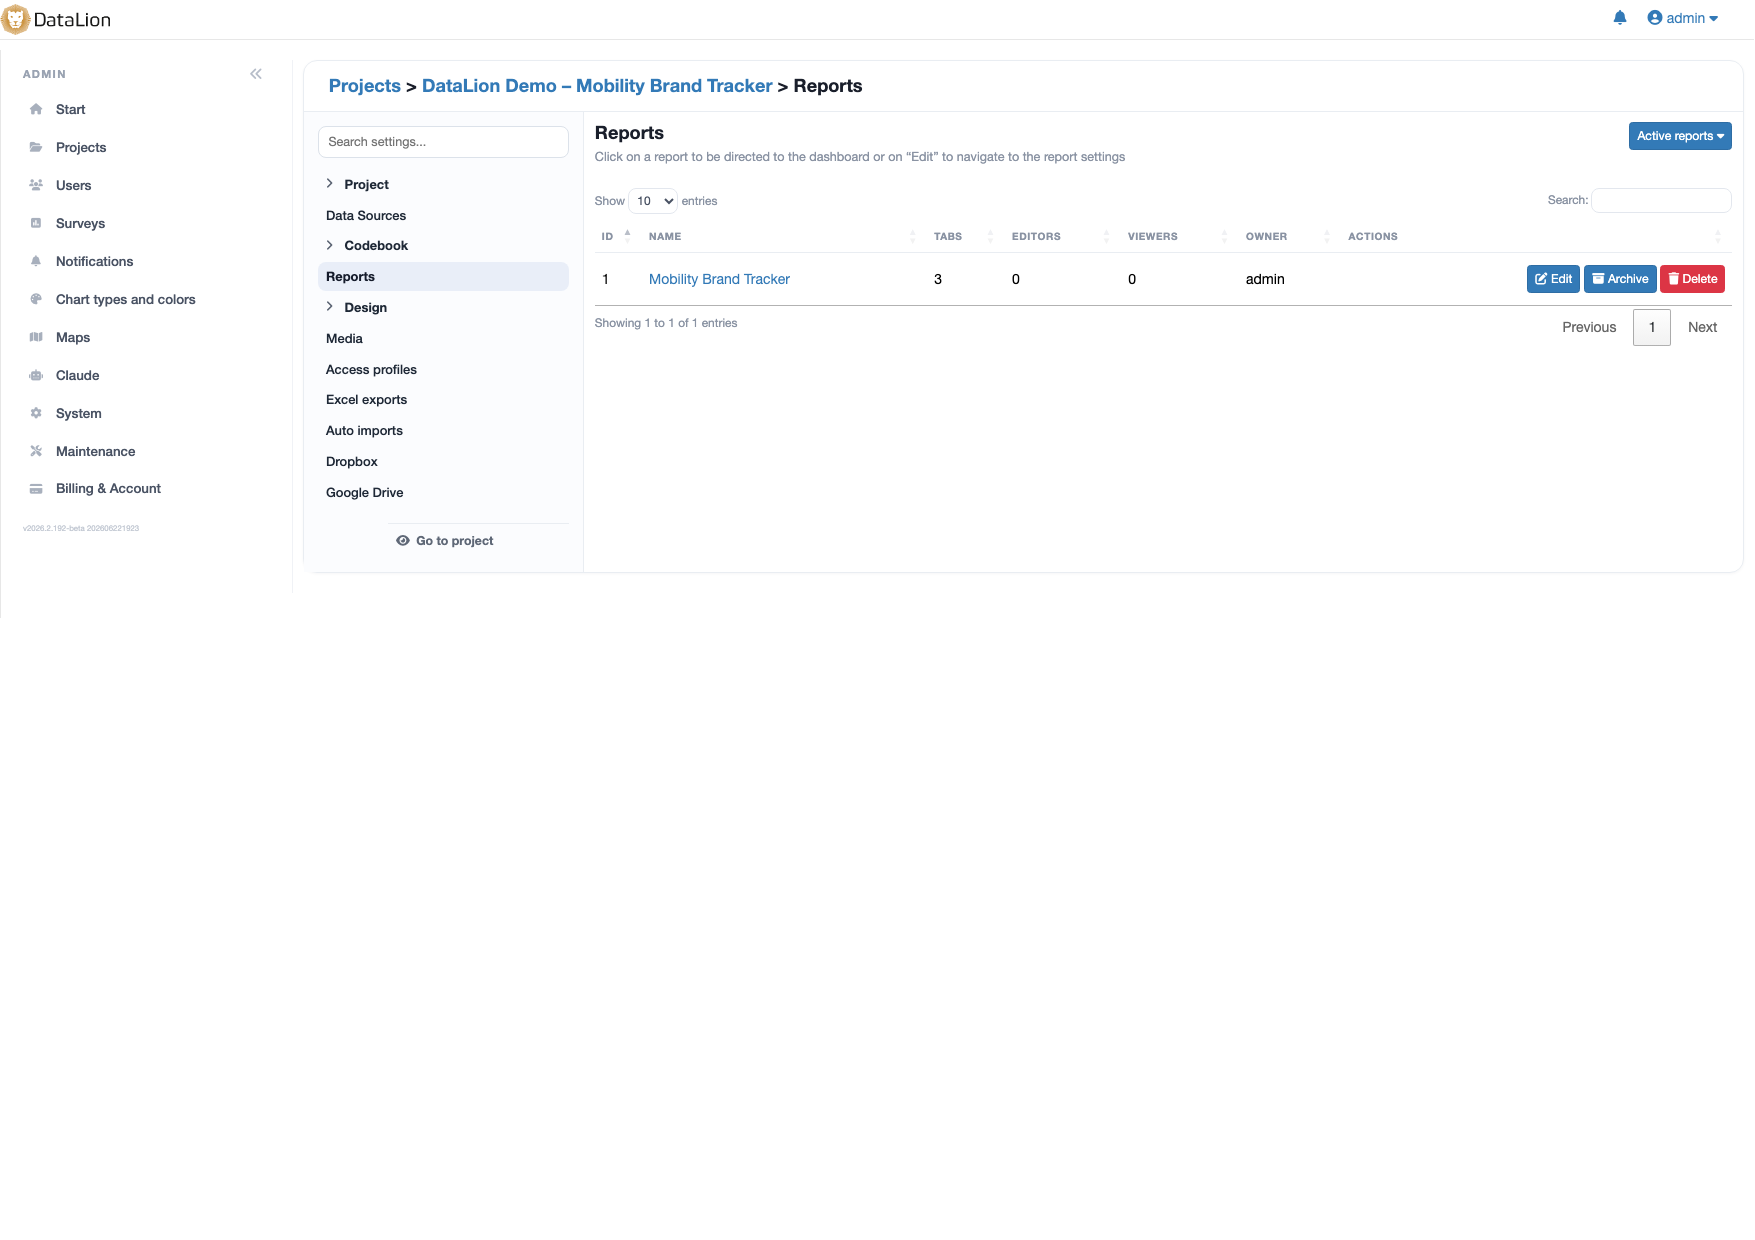
A report in DataLion bundles multiple tabs and widgets into one coherent report. Once set up, dashboards and reports refresh automatically — wave after wave. Reports can be created via AI over MCP and exported as native PowerPoint, an Excel report book or PDF.
- 🇩🇪 Made in Munich
- GDPR-compliant
- DPA included
- Hosted in Germany
- 🌐 Interface in EN, DE, FR & NL
Trusted by research, insights & media teams
- 50+ interactive chart types
- 20+ statistical methods
- SPSS · Excel · CSV import without data loss
- ISO 27001 certified data centers (Germany)
The same reporting by hand every wave
- Every new wave means rebuilding the same charts and pasting them into slides — hours nobody has.
- Individual analyses are scattered: a dashboard here, an Excel table there, a PowerPoint somewhere else.
- As soon as new data arrives, assembling the report starts all over again.
Bundle tabs and widgets into one report
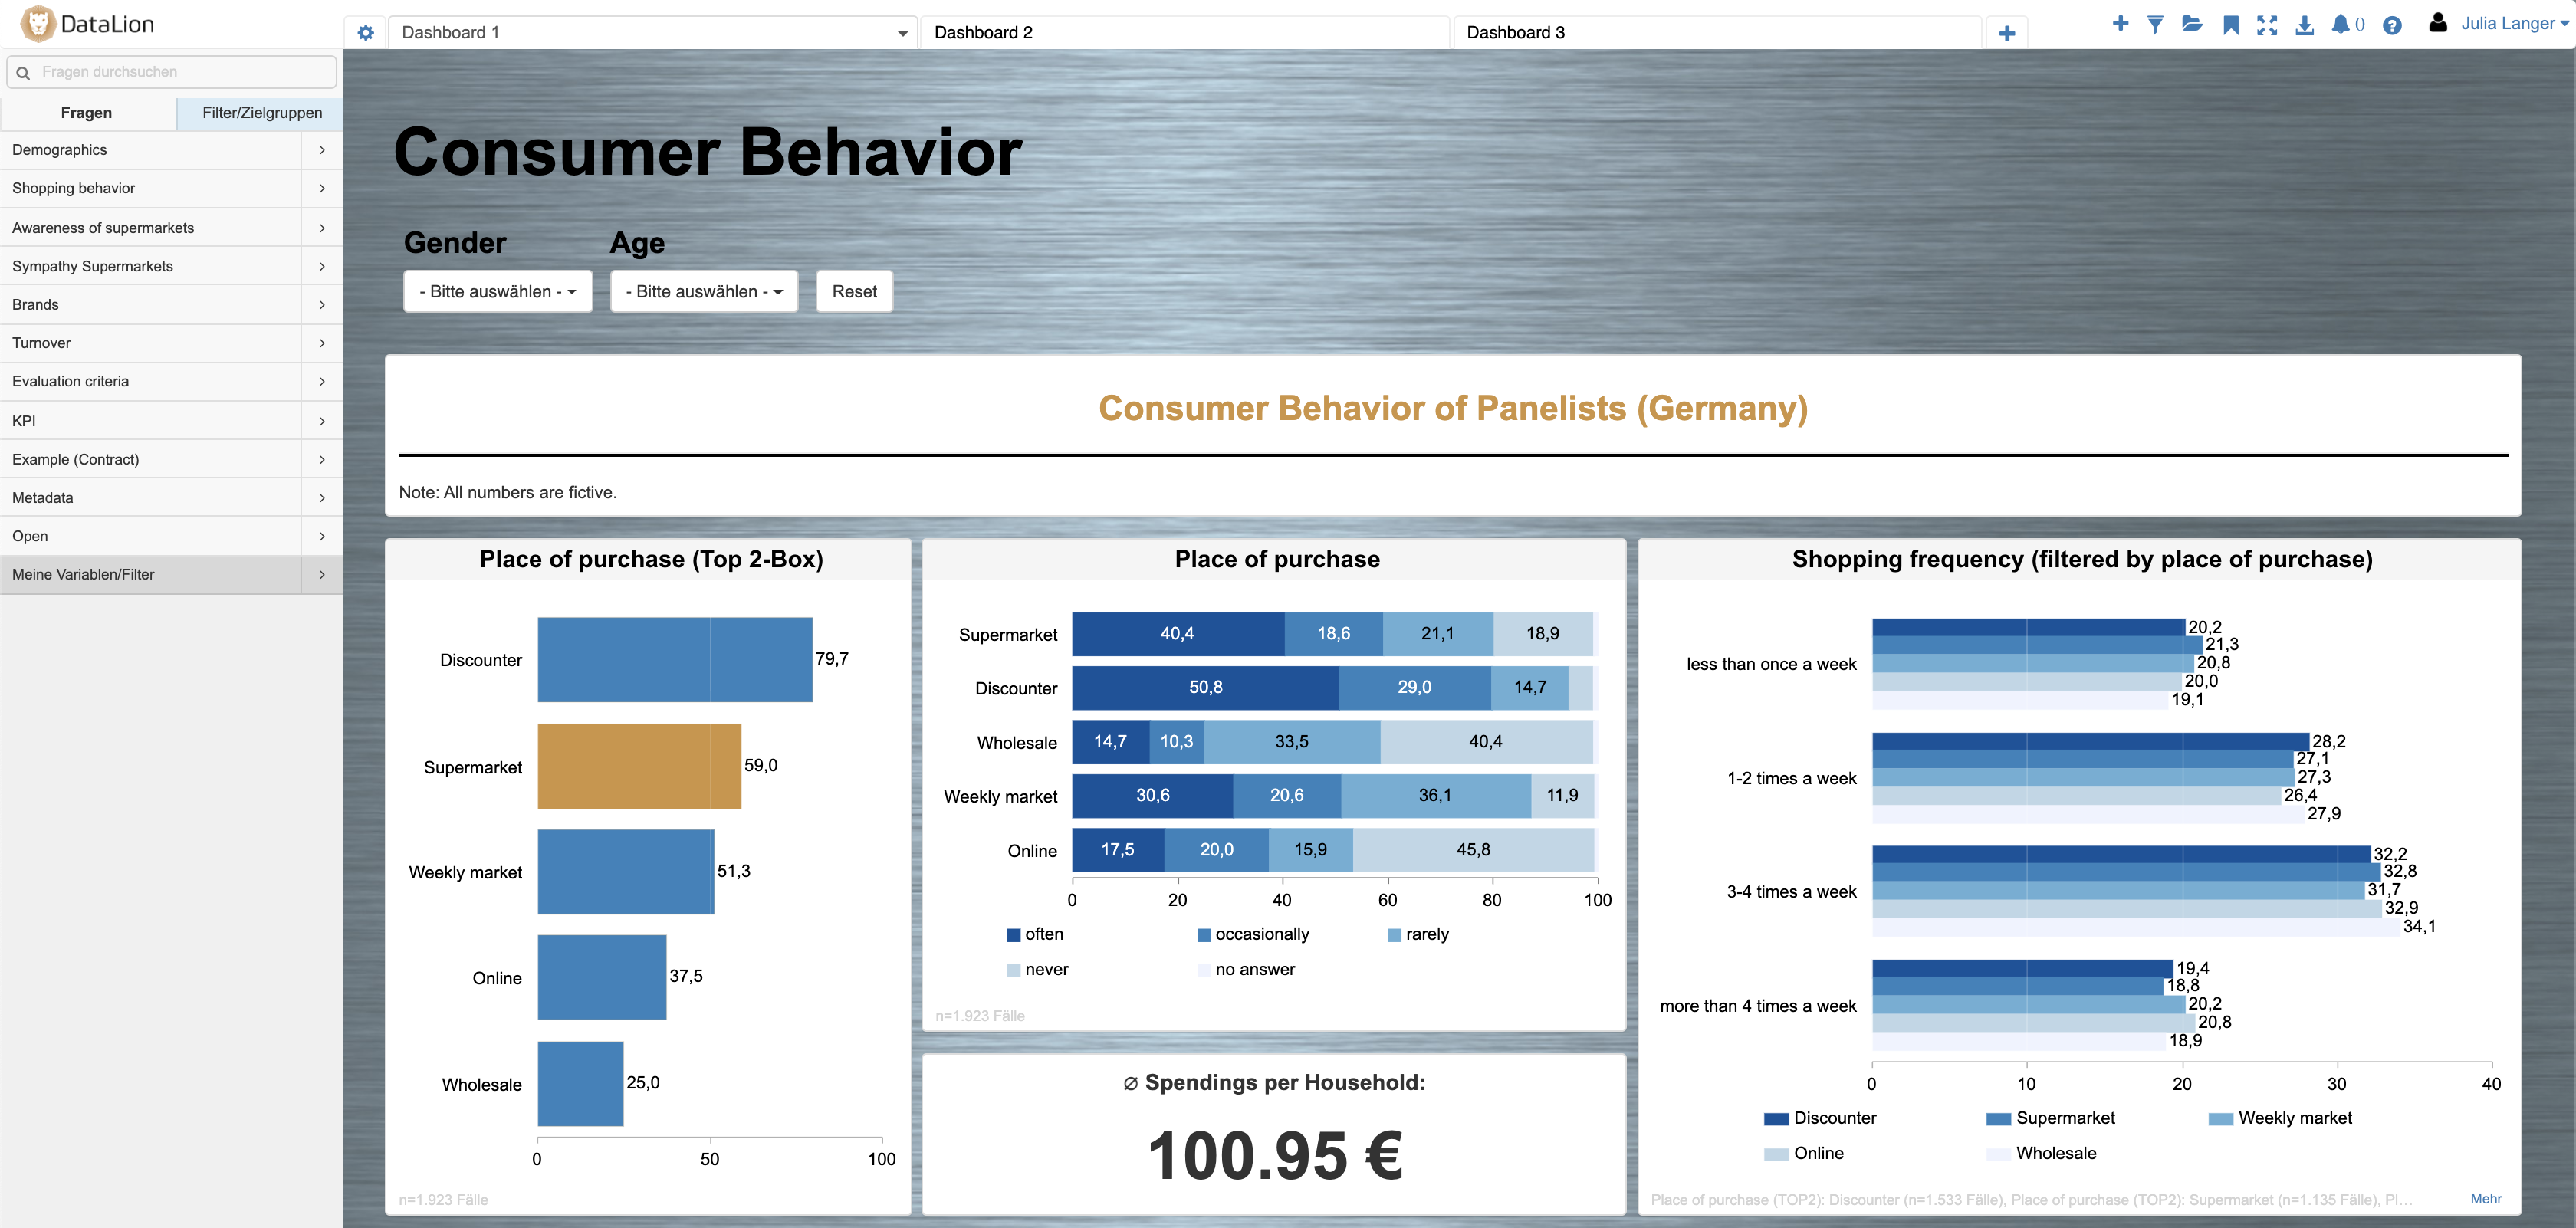
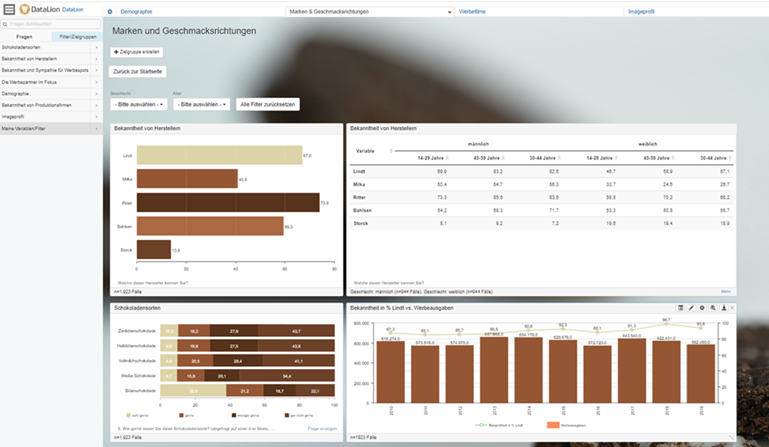
A report brings together what belongs together: multiple tabs for topics or audiences, and within each tab any number of widgets — charts, crosstabs and key figures.
Scattered analyses become one coherent report that you maintain and share as a whole — instead of separate files that quickly drift apart.
- Multiple tabs per report for topics and audiences
- Any number of widgets per tab — charts, crosstabs, KPIs
- 50+ chart types available right away
Dashboards and reports refresh automatically
The big difference: you set a report up once. When new data comes in, dashboards and reports refresh automatically — wave after wave, with no charts to rebuild.
For tracking studies this is the decisive lever: the report stays current while you focus on interpretation instead of copy-pasting.
- Build a report once, use it for good
- Automatic refresh with every new wave
- Ideal for recurring trackers
Create reports, tabs and widgets in conversation
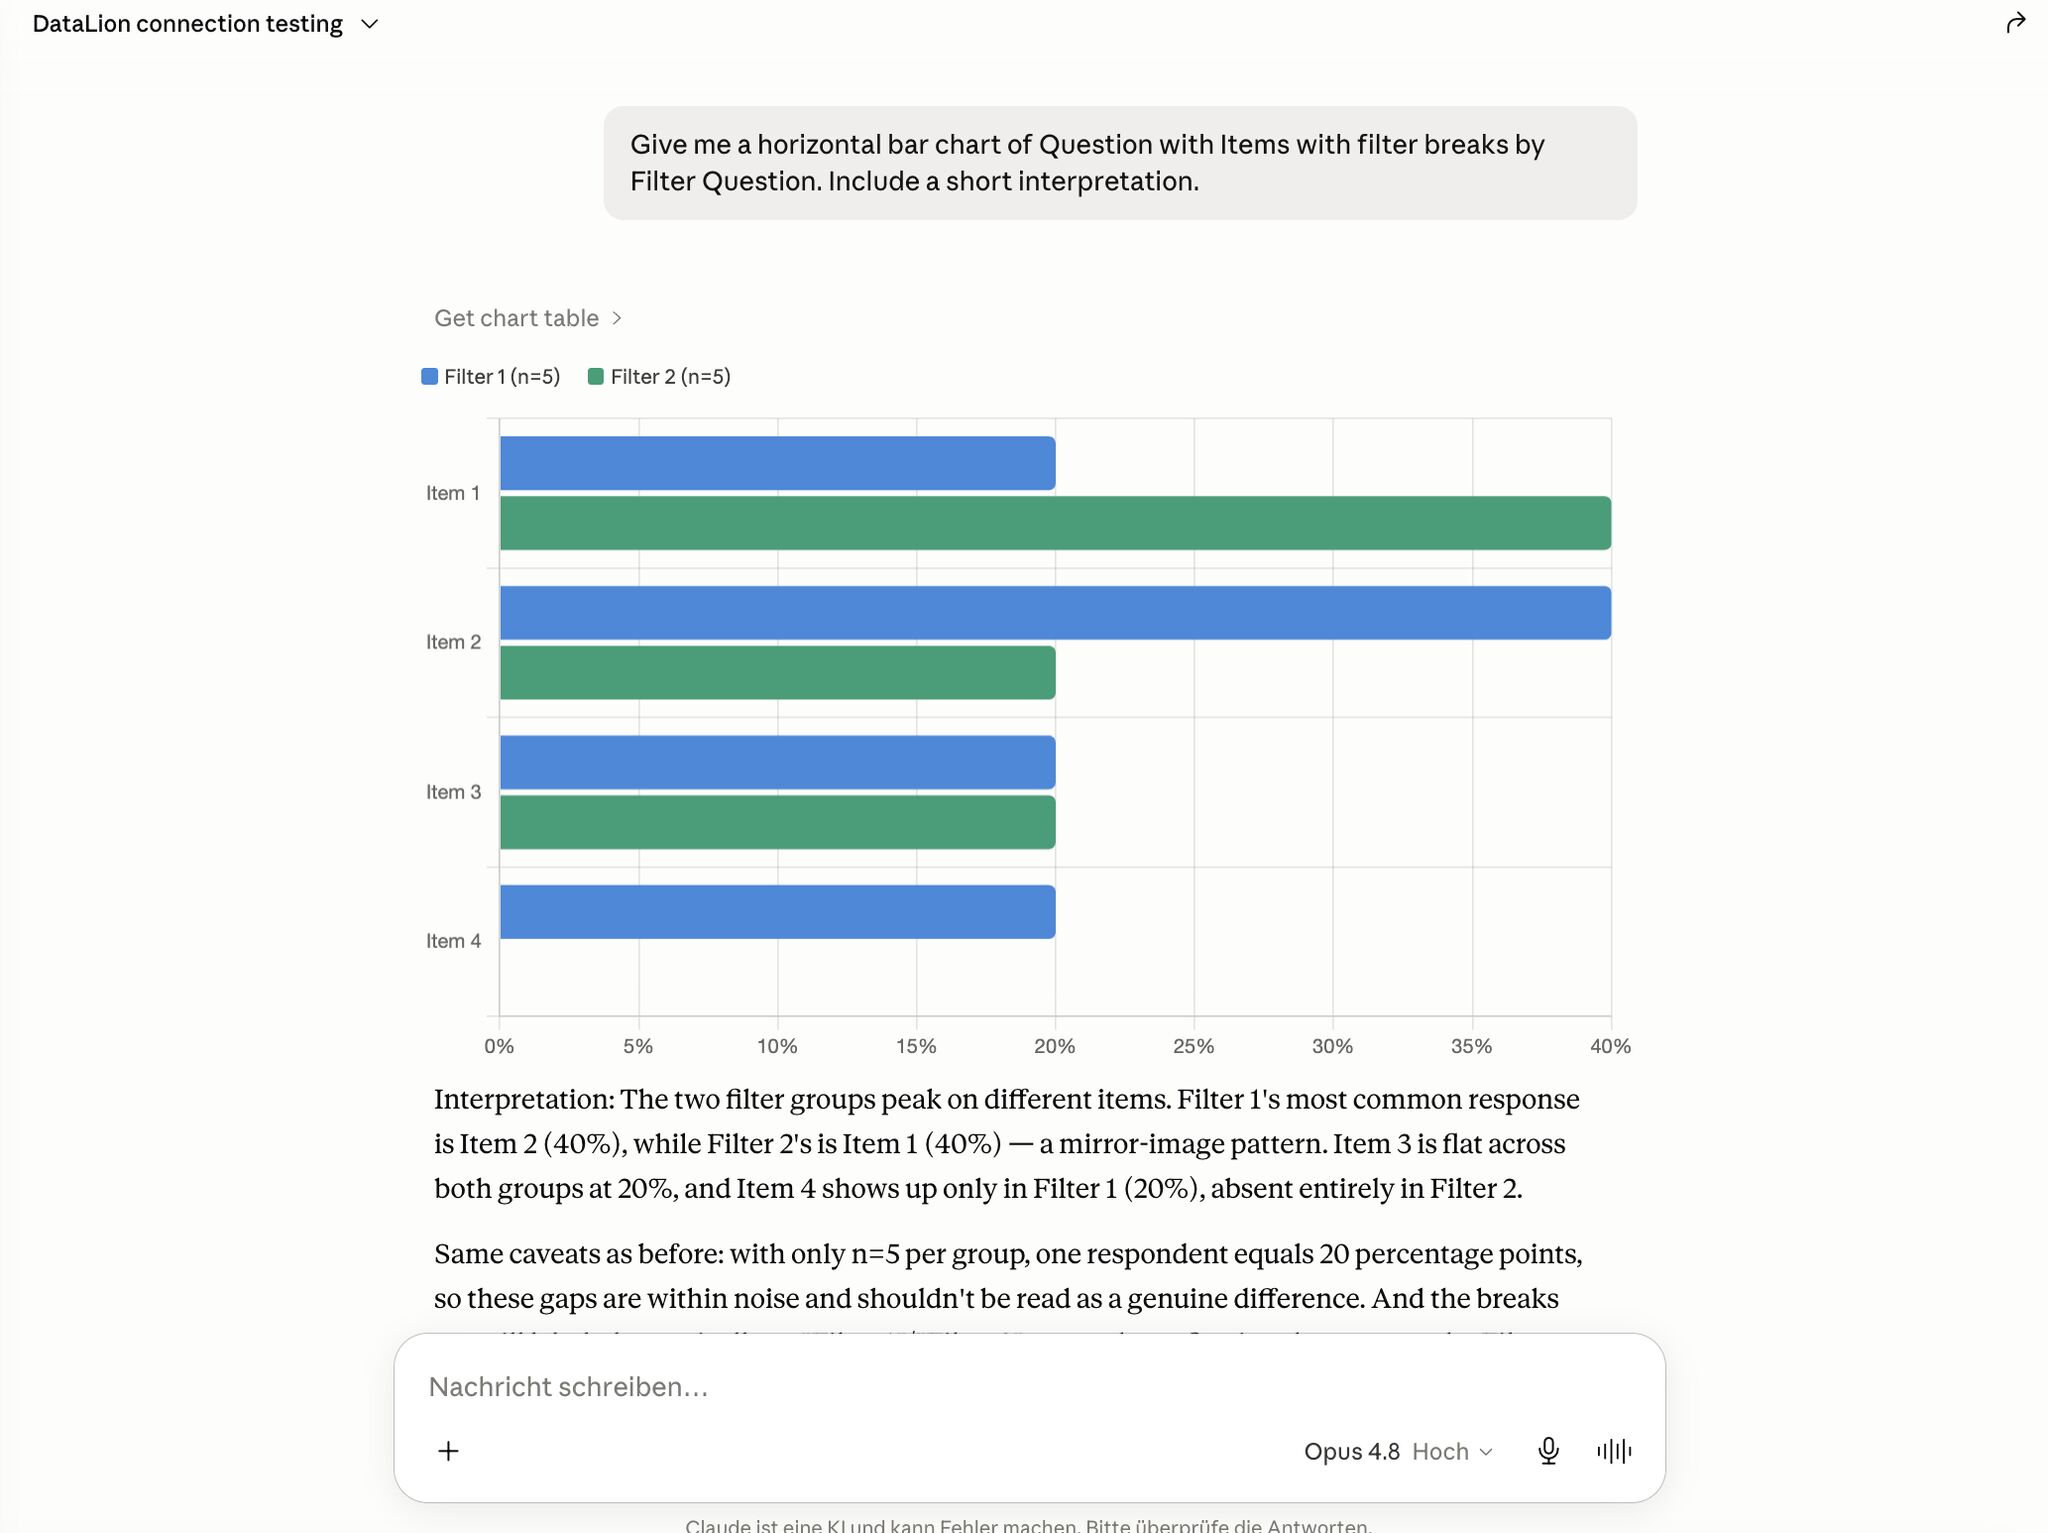
Reports can also be created and edited through the AI integration (MCP): an AI agent like Claude creates reports, adds tabs and inserts widgets — in plain language.
You describe the report you want and the AI builds the structure inside DataLion. Learn more on the AI market research page.
Export as PowerPoint, an Excel report book or PDF
Export a finished report in one click: as natively editable PowerPoint in your CI layout, as a flexible Excel report book with your own KPIs and bases, or as a PDF for handing over a study.
No copy-and-paste, no media break: whatever is in the report lands cleanly in the format you choose.
- Native, editable PowerPoint in your CI layout
- Flexible Excel report books with your own metrics
- PDF for handing over a study
See DataLion with your own data
Start a free trial or book a personal demo — from raw data to a finished dashboard.
What users say about DataLion
- via G2
Very professional company, attentive to the customer needs, provider of a great software and service.
Generoso M. · CRM Analyst, Automotive - via G2
The contacts at DataLion are very committed. If you have problems, you can count on help. DataLion reacts quickly to requests for new functions.
Robert Q. · Managing Director - via G2
User-friendliness, especially for market research topics. Structured backend with many customization options.
Verified user · Market Research - via G2
The embedding function allows us to generate insights of our data for our audience and customers by far less than half of the usual time needed before.
Verified user · Leisure, Travel & Tourism

We now work much more efficiently, giving us more time to take care of the derivations and insights from the data for the customers.
More on reports & sharing
Common questions about reports
What is a report in DataLion?
Do reports refresh automatically?
Can I create reports with AI?
Which formats can I export a report to?
Are reports suitable for tracking studies?
Build your first self-refreshing report
Try DataLion free — or get a demo of how tabs and widgets become a report that refreshes itself, wave after wave.