
In short: A Dealer Satisfaction Index (DSI) is a mean across the satisfaction aspects of the partnership, rescaled to 0 to 100 and comparable per wave, region and country. The number is simple; the decisions behind it are not: which aspects belong in it, whether they are weighted, how anonymity is preserved across the network, and how the index turns into an action per region. This article covers the template, the formula and the analysis. The questionnaire is available as a PDF and as an online template.
Straight to the template: download the questionnaire as PDF (A4, 10 questions, no sign-up) or open it as an online template.
Why dealers are surveyed, and why it rarely goes well
Dealers and service partners are customers who are also the sales force. Their dissatisfaction shows first in falling orders and in multi-brand outlets reallocating showroom space, long before a contract is terminated. Almost every manufacturer with a network therefore surveys once a year, usually through an agency that delivers a slide deck per region.
Two things get lost on the way. First, the level below the region: the deck says the south slips on parts supply, not which outlet. Second, time: by the time the report reaches regional managers in March, the November answers are six months old. Neither is a questionnaire problem; it is a dataset problem. The data sits with the agency and is delivered as a report rather than as something that can be filtered.
What belongs in the template
| Block | Questions | Purpose |
|---|---|---|
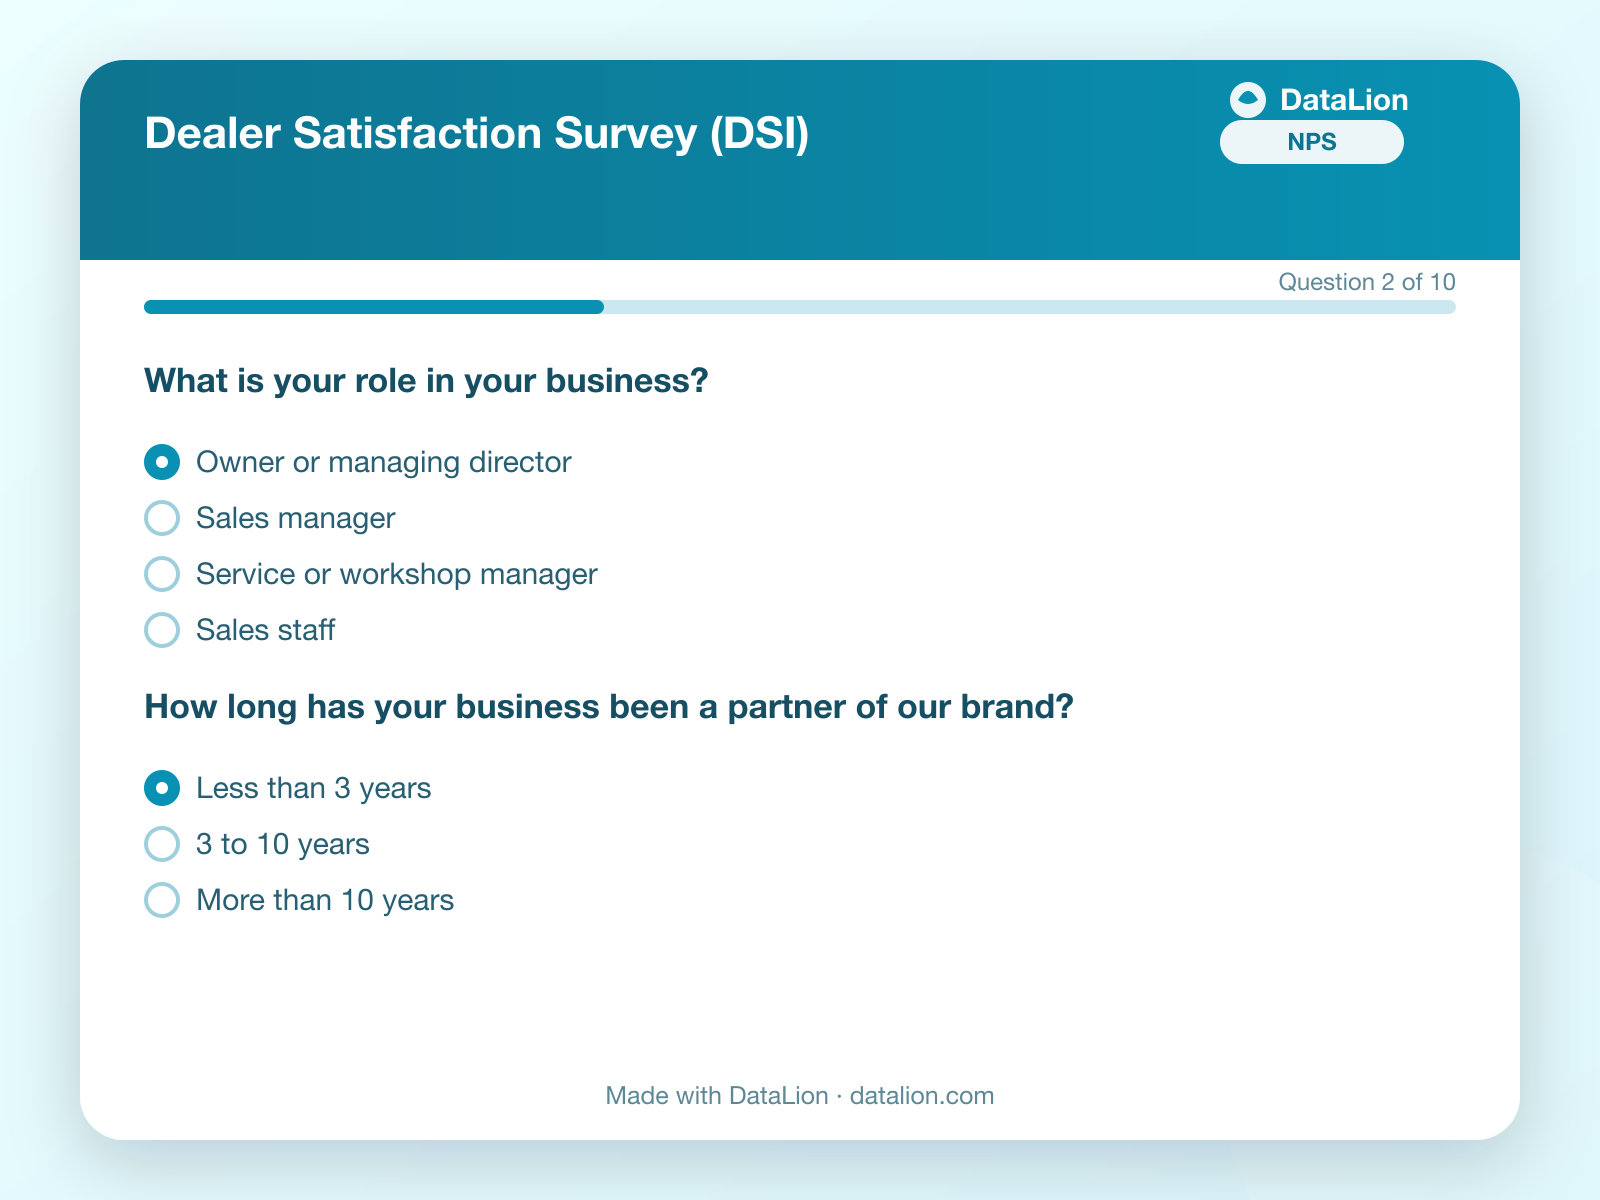
| Structure | Role in the business, partner since, other brands | Owners rate margins, service managers rate parts |
| Satisfaction | Eleven aspects from product quality through margins and delivery times to field support and dealer portal | The basis of the index |
| Overall | Overall satisfaction 1 to 10 | The anchor for weighting and driver analysis |
| Economics | Profitability with the brand | The question that predicts terminations best |
| Loyalty | Sign the contract again today? Recommend to other dealers (NPS) | The early-warning system |
| Priorities | Ranking: what should the manufacturer improve first? | The order of business for the dealer council |
| Open | What works particularly well, what badly? | What the matrix does not capture |
The role in the business comes first for a reason. Owners, sales managers and service managers rate the same partnership from three perspectives, and an index that mixes all three hides that margins sit at 2.1 with the owner and at 3.5 with the service manager who never sees them.
The index: formula and weighting
The usual form of the DSI is the mean across the satisfaction aspects, rescaled to 0 to 100. On a five-point scale:
DSI = (mean of all aspects − 1) / 4 · 100
A mean of 3.8 gives an index of 70. The rescaling changes no information, but it makes the value comparable across waves and countries with different scales, and readable for the board.
Three variants are common. The unweighted index treats all eleven aspects equally; it is easiest to explain. The weighted index gives each aspect a weight from a driver analysis, i.e. from its contribution to overall satisfaction or re-signing; it is more informative but harder to explain, and the weights should stay constant across waves. The third variant is the top-box index: the share of outlets that ticked at least "satisfied", averaged across aspects. It reacts less to outliers and is, in many networks, the figure regional managers are measured on.
Which variant you pick matters less than consistency: an index whose formula changes is no longer a time series. In DataLion you set the index up once as a computed metric; after that it is available per country, region and wave in every chart and export.
Importance from the data, not from a question
Many templates additionally ask how important each aspect is. With dealers that yields little: margins, delivery times and parts are "very important" to everyone. Driver analysis derives importance from the data instead: which aspects statistically explain overall satisfaction or re-signing? The result surprises regularly. The margin everyone discusses in the dealer council often explains less than the field support nobody mentions, because it is not something to negotiate.
Put the relative importance from the driver analysis next to satisfaction per aspect. Action is needed where importance is high and satisfaction low, and that list is usually short.
Anonymity across the network
The dealer survey has an anonymity problem the customer survey does not: many outlets have one owner, and if the outlet is identifiable, so is the person. At the same time head office needs the breakdown by region and country, otherwise the index is a number without an address.
The compromise that has proven itself: region and country come into the dataset as parameters on the survey link, the outlet does not. Figures are shown from a minimum case count per region, typically ten outlets. Where you do capture the outlet, for example because the end-customer service feedback runs per outlet anyway, say so in the cover letter and show outlet figures only to the outlet itself, not to the regional manager. Whatever you promise should be in the cover letter word for word; dealers read it.
Fieldwork: invitation, reminder, response
The invitation should come from the head of sales, not from marketing, and it should say what happened with the results of the last wave. One reminder after ten days typically doubles the response. In a network of 400 outlets, 50 to 70 percent response is achievable when area managers mention the survey in the outlet; with multi-brand outlets noticeably less.
In DataLion the contact list, the invitation in the brand's layout, the reminder and the delivery status run through the fieldwork module; responses are stored without a link to the contact list. If you survey internationally, add the languages to the same questionnaire; every response lands in one dataset.
Analysis: from index to action per region
- Index per region and country as a heatmap against the eleven aspects. The red cell is the opening of every conversation with a regional manager.
- Check significance. Whether the south is really worse than the north or the difference is chance at 35 outlets per region is told by the significance test in the crosstab, before anyone has to justify themselves.
- Cross re-signing with profitability. Outlets that would not sign the contract again and rate profitability as insufficient are the list the head of sales takes into next week.
- Hold the priority ranking from the ranking question against the driver analysis. Where both agree the action is undisputed; where they diverge, dealers know something the statistics do not see, or the other way round.
- Code the open answers by topic and sentiment, with a topic scheme that stays the same across waves. 600 comments become a ranking per region.
- Compare waves. Whether the new bonus scheme changed anything is shown by the index line in the following wave, not by the anecdote from the dealer council.
The template as PDF and as an online questionnaire
The PDF template is the paper version, meant for alignment with the head of sales and the dealer council. The online template is the same questionnaire as a survey: set it up, adapt the eleven aspects to your network, generate a link per region and country, invite through the fieldwork module. The index is then a computed metric in the dataset.
Next step
Download the PDF template, compare the aspects with your current questionnaire and decide the index formula before the first wave runs. How one dataset becomes the reports for head office, country, region and outlet is covered in the article on the reporting cascade for dealer networks; the full picture is on the page Dealer surveys and after-sales feedback for sales networks.