
Gabor-Granger Price Test
The classic pricing method: purchase intent at several price points yields a demand curve and the revenue-optimal price.
The live demo opens the real questionnaire — no signup required.
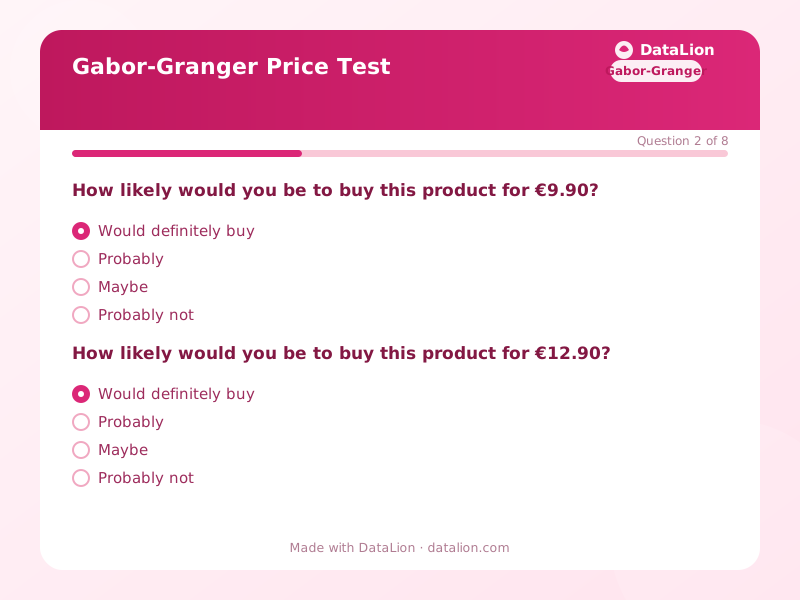
The Gabor-Granger method is, alongside Van Westendorp, the classic of pricing research – and the right choice when you already have concrete price candidates. Respondents state how likely they would be to buy at a series of price points. This produces a demand curve: what percentage buys at €9.90, how many at €14.90? Multiplied by price, the revenue curve shows where the revenue-optimal price sits – often not where most people would buy. Before fielding, adapt the product description and the five price points to your offer; the price points should fully cover the realistically conceivable range.
When should you use this template?
This template is a great fit for:
- Before product launches when concrete price candidates exist
- Before price increases, to estimate volume effects
- For price differentiation between plans or target groups
Every question in this template
- 1Info
Our product
[Describe your product or offer here: what is it, what does it do, what is included? Ideally add an image. The following price questions refer to exactly this offer.]
- 2Single choice
How likely would you be to buy this product for €9.90? *
- Would definitely buy
- Probably
- Maybe
- Probably not
- Definitely not
- 3Single choice
How likely would you be to buy this product for €12.90? *
- Would definitely buy
- Probably
- Maybe
- Probably not
- Definitely not
- 4Single choice
How likely would you be to buy this product for €14.90? *
- Would definitely buy
- Probably
- Maybe
- Probably not
- Definitely not
- 5Single choice
How likely would you be to buy this product for €19.90? *
- Would definitely buy
- Probably
- Maybe
- Probably not
- Definitely not
- 6Single choice
How likely would you be to buy this product for €24.90? *
- Would definitely buy
- Probably
- Maybe
- Probably not
- Definitely not
- 7Number
What is the maximum price in euros you would pay for this product?
123 - 8Single choice
How often do you buy products of this kind?
- This would be my first time
- Less than once a year
- About once a year
- Several times a year
- Monthly or more often
From questionnaire to dashboard
From five price questions, the dashboard builds the complete price-demand logic:
- Demand curve: The share of willing buyers (“definitely” + “probably”) per price point as a falling line – the heart of the Gabor-Granger test.
- Revenue curve & optimal price: Willingness times price per point: the calculation tile shows which price maximises revenue – your key result for the pricing decision.
- Purchase intent profile: All five answer levels per price point as 100% stacked bars – shows whether rejection at higher prices is hard (“definitely not”) or soft.
- Distribution of maximum prices: The open price question as a histogram reveals willingness-to-pay segments sitting between your price points.
- Segment comparison: Purchase intent crossed with buying frequency or target group – the basis for differentiated pricing.
Related survey templates
- Brand Tracker (wave survey)The full brand funnel with named Waves, case counts and automatic previous-Wave comparisons: awareness, consideration, usage, advocacy and image profile.
- Conjoint Analysis: Product PreferencesUse a Choice-Based Conjoint analysis to learn which features and which price really drive purchase decisions – respondents repeatedly choose their preferred offer from realistic product combinations.
- Shopper Style Analysis (Consumer Styles Inventory)Eight scientifically described shopping styles from quality-conscious to impulsive – as a personal profile with your two strongest styles.
- What Kind of Player Are You?Achiever, explorer, socialiser or challenger? Sixteen statements, four play motivations and your personal player type.
Frequently asked questions
Gabor-Granger or Van Westendorp – which is right for us?
How do I choose the five price points?
Don't respondents overstate their willingness to buy?
Start with this template
Load the template into DataLion, adapt it to your brand and start collecting responses — GDPR-compliant, in minutes.