Show significances (group comparisons) in tables and bar/column charts
You can display significances in tables, column charts and bar charts.
For a chart, select the test you want under Settings → Significances.
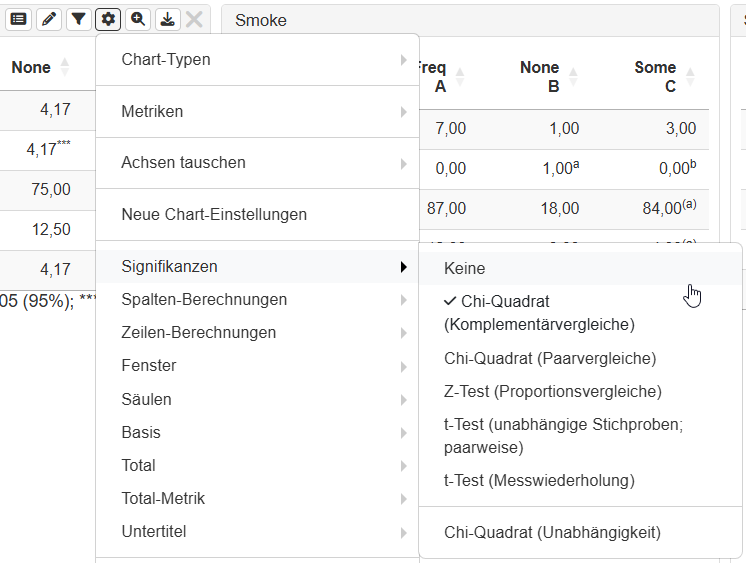
The following tests are currently available
-
Chi-square (complement comparisons):
Compares expected vs. observed frequencies between each individual cell and its complement (all other categories). -
Chi-square (pairwise comparisons):
Compares expected vs. observed frequencies between cells in a pairwise manner. -
Z-test (proportion comparisons):
Compares the percentages between cells pairwise for significance -
t-test (independent samples; pairwise):
Compares means pairwise between two independent groups (e.g. gender) with respect to a dependent variable. -
t-test (repeated measures):
Compares means pairwise between two measurement points (or conditions) for the same individuals with respect to a dependent variable. -
Chi-square (independence)
Tests two variables for statistical independence. -
In progress: t-test (dependent samples)
Compares means pairwise between two ratings (e.g. products) for the same individuals with respect to a dependent variable.
Recommended metrics
-
Chi-square tests: absolute values
-
Z-test: percent
-
t-test: mean
Notes:
-
For the t-tests, the dependent variable must be defined as numeric in the codebook!
-
For the chi-square tests, the Yates correction can be enabled/disabled in the chart settings.
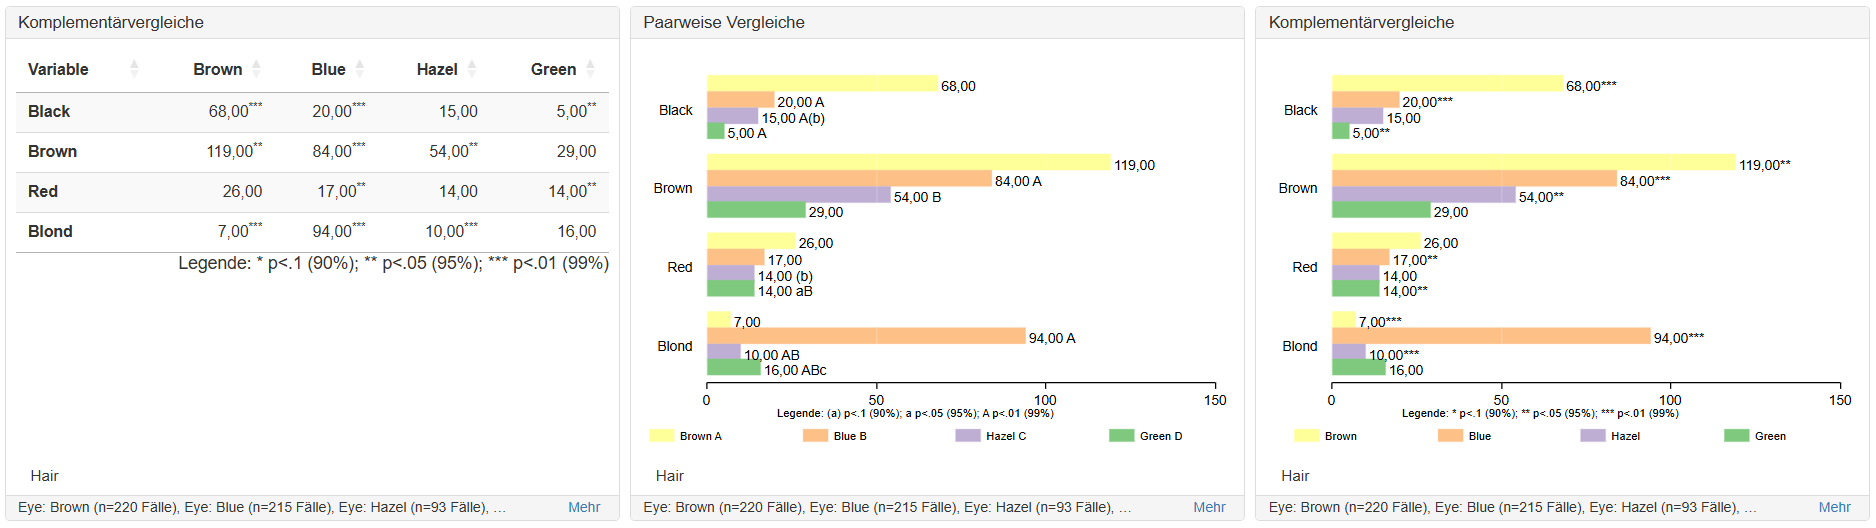
How significances are displayed (significance levels can be found in the legend):
-
Complement comparisons: asterisks indicate whether one group differs from the others. The number of asterisks represents the significance level.
-
A letter after a value indicates which comparison group the value is significant against. Each comparison group is assigned a letter (either in the columns or in the labels for the categories). The way the letter is displayed represents the significance level.