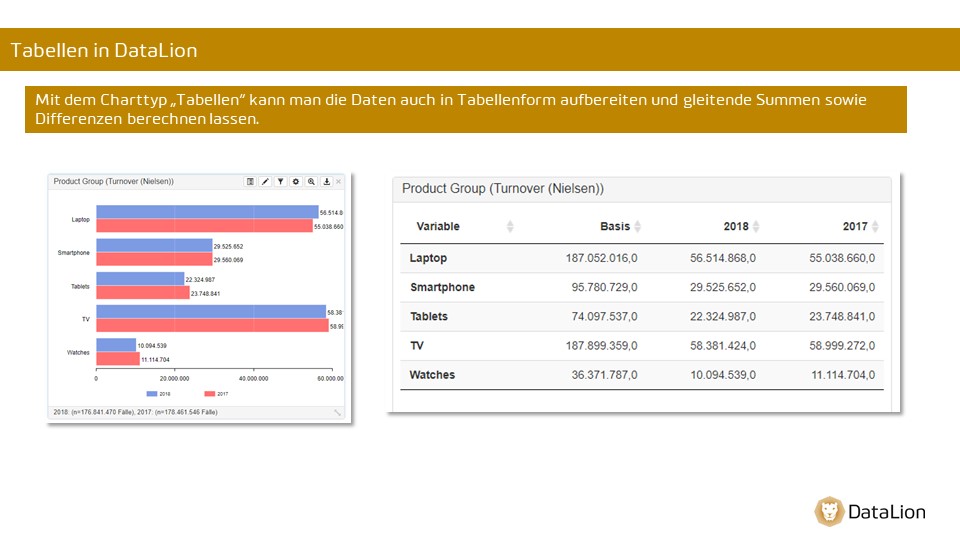
Tables in DataLion
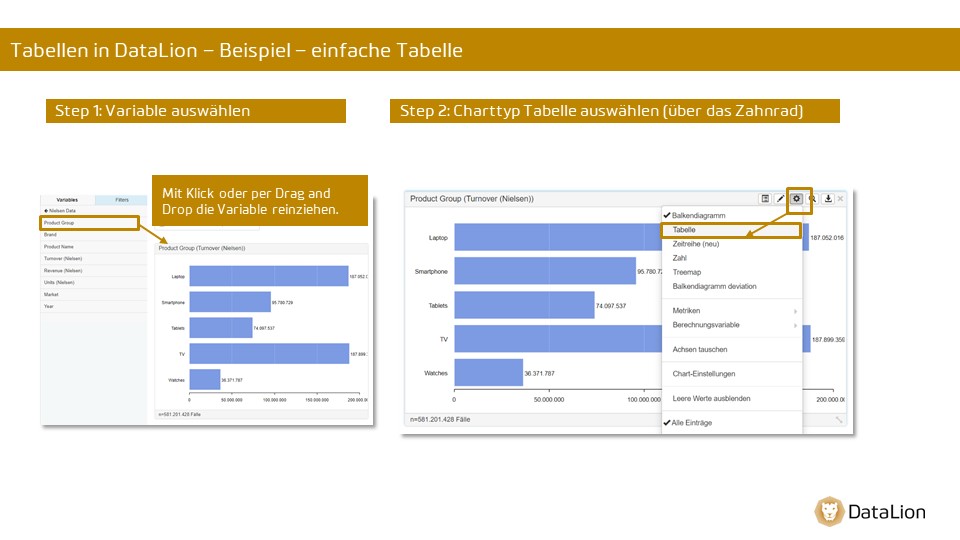
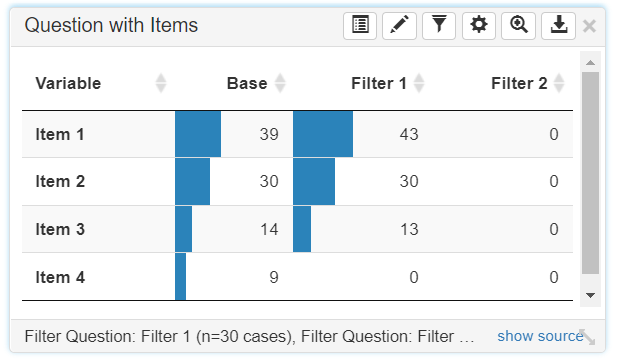
Tables in DataLion - example - simple table
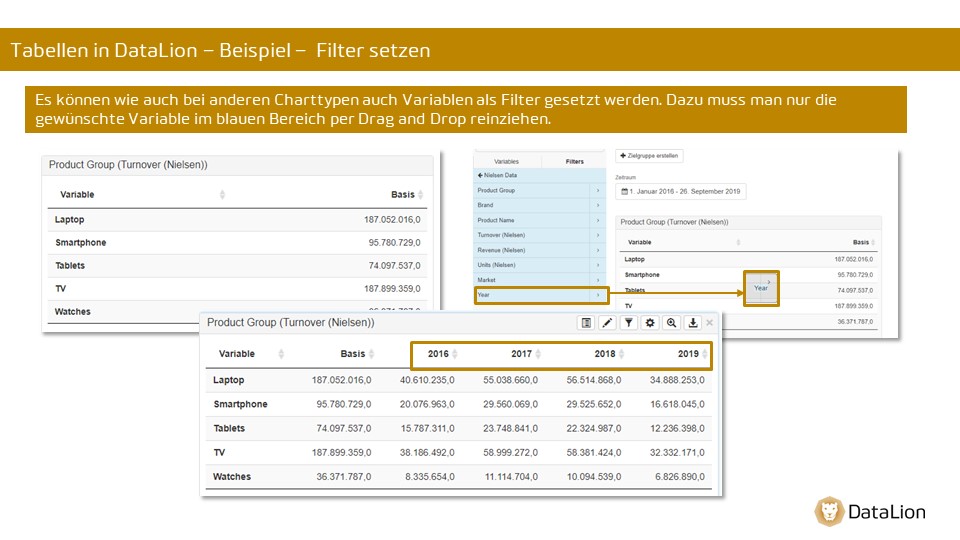
Tables in DataLion - example - setting filters
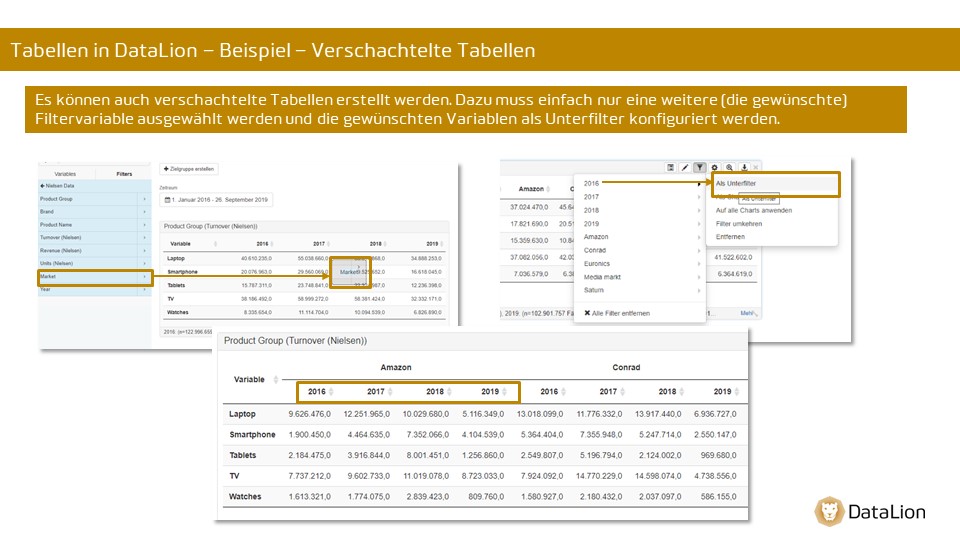
Tables in DataLion - example - nested tables
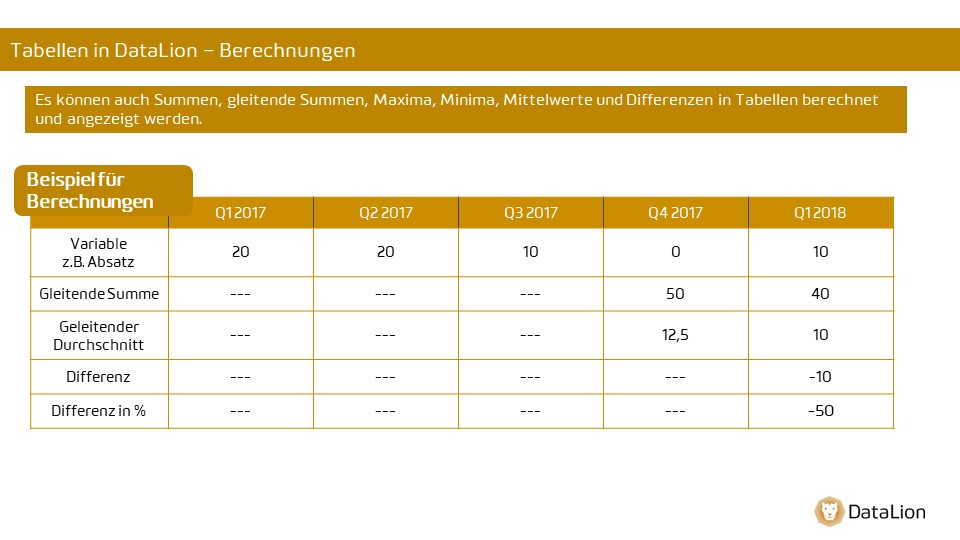
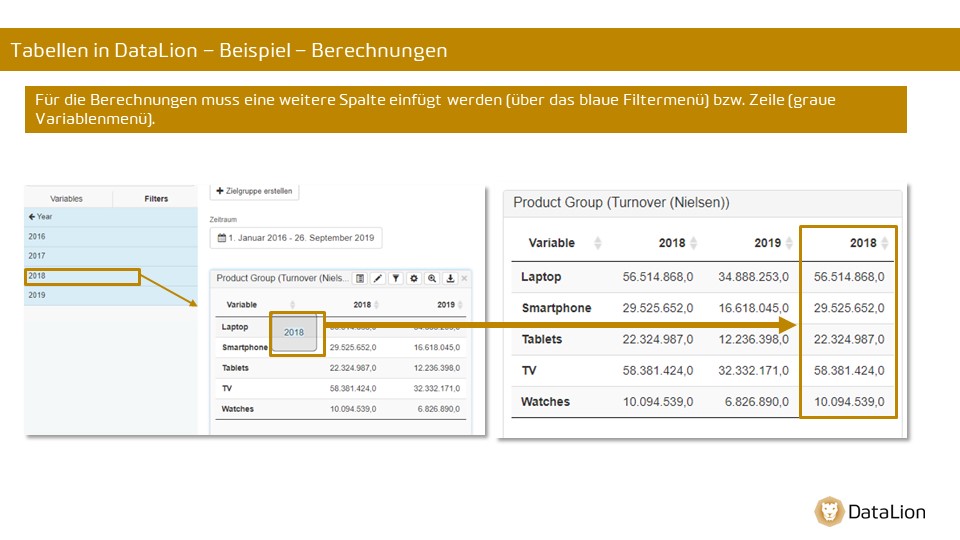
Tables in DataLion - calculations
Tables in DataLion - additional settings
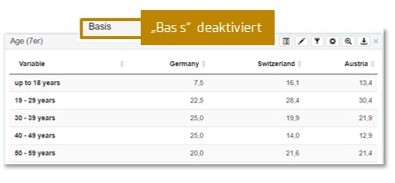
Additional settings for the “Table” chart type (via the chart menu (gear icon))
- Show and hide the base column
-
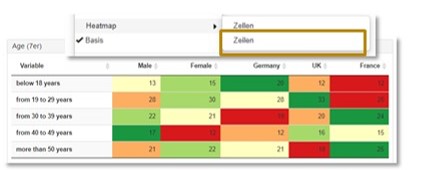
Heatmap display
-
row-wise = rows
-
across all rows/columns = cells)
-
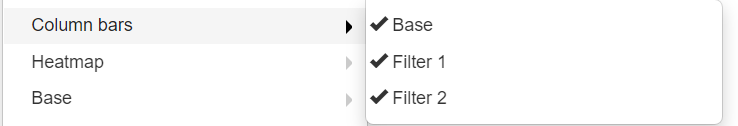
- Show column bars
- Show significances (chi-square test)
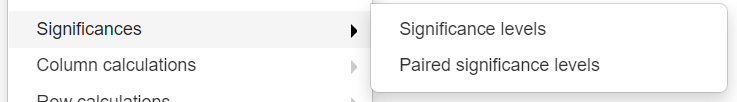
-
Significance levels: significance against the base
- Paired significance levels: significances between the groups
Tables in DataLion - specific chart settings
You can find instructions on the following topics in the articles linked below:
-
Inserting difference columns into a table
-
Linking table items
-
Conditional formatting in tables