
Gallery · Sample data
Startup KPIs: runway, MRR & retention
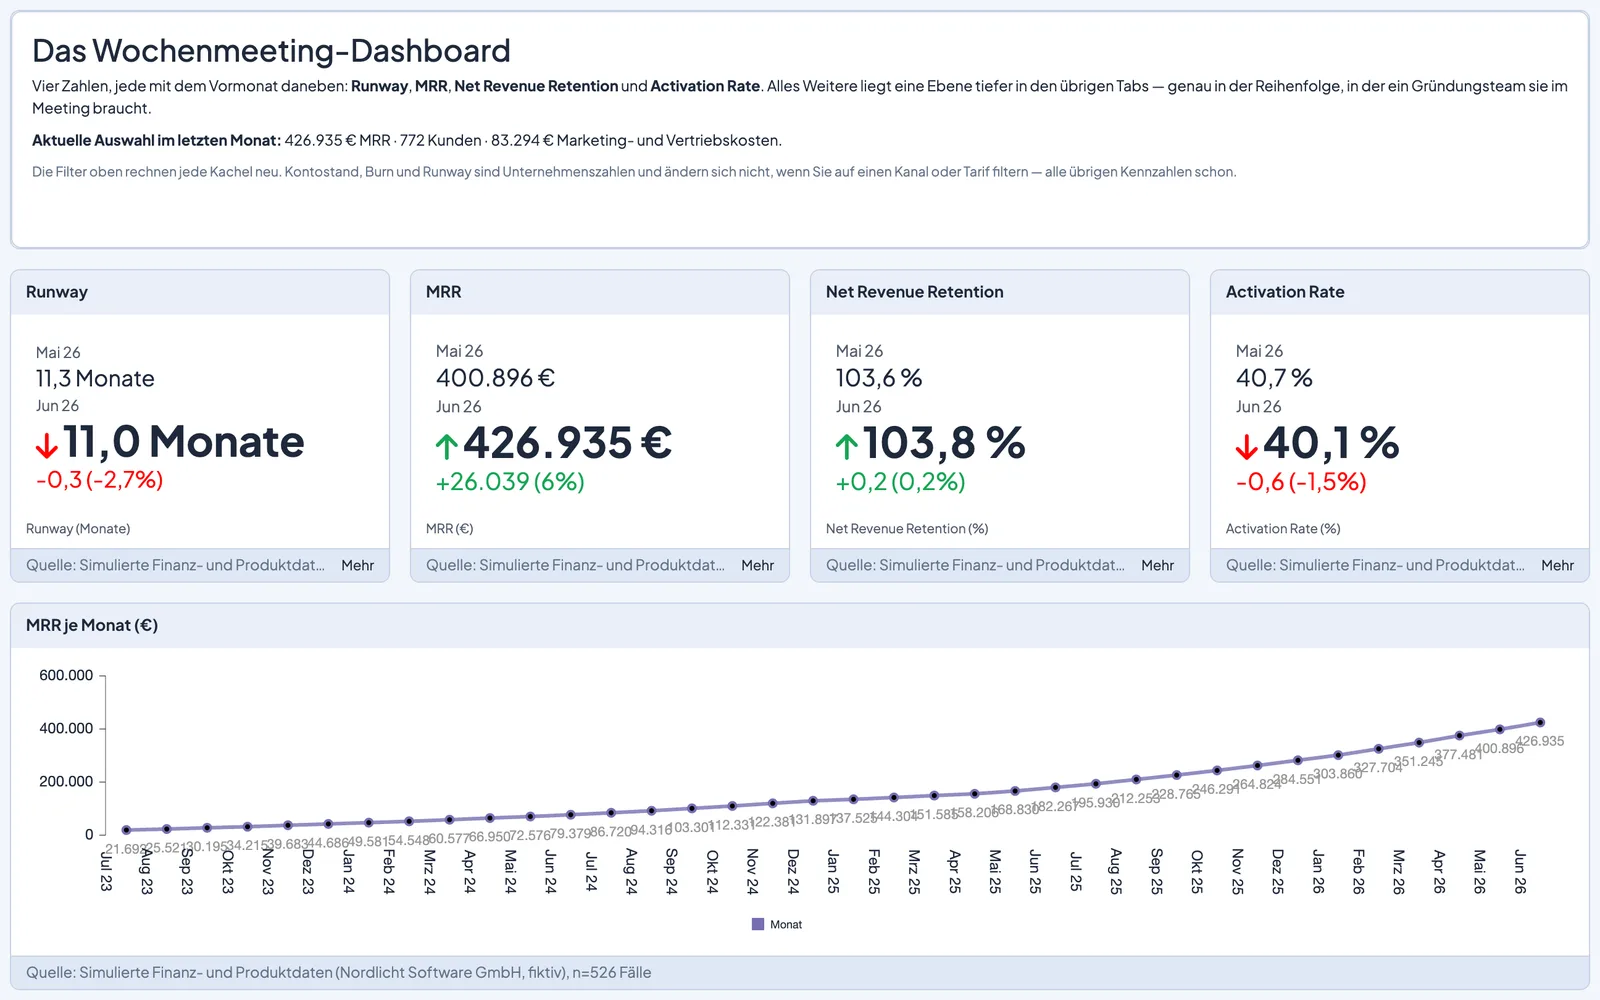
The dashboard a founding team actually reviews every week: runway on net burn, an MRR bridge of new business, expansion, contraction and churn, NRR, CAC payback instead of LTV/CAC, and activation instead of signups — 36 simulated months of a B2B SaaS.
No account, no sign-up
Synthetic data This study runs on synthetic data — computer-simulated, with no real respondents and no customer data.
At a glance
- Sample
- 540 simulated records
- Dashboards
- 6
- Topic
- Market & business
- Analyses
- Waterfall, KPI tiles, Runway
- Data source
- Synthetic, simulated by DataLion
What you can do in the dashboard
- Switch questions and break results down by age, gender or region
- Build crosstabs and read significance between groups
- Apply filters and watch the case count update as you go
- Export charts as images, tables as Excel and the analysis as PowerPoint
The same with your data
Upload a CSV, Excel or SPSS file and DataLion builds the codebook, dashboard and crosstabs from it. Every study here was built with exactly those tools.
Start for free