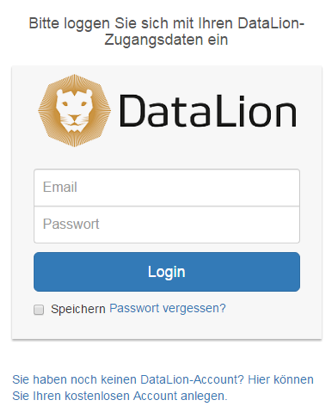
After you registered your account, confirmed the email and have been approved, you can login to the software with the link https://datalion.net/dashboard.
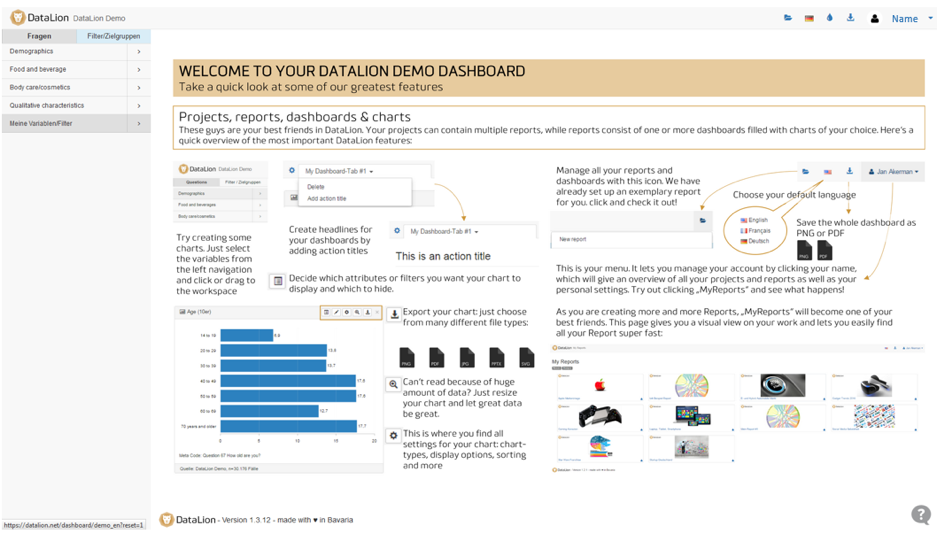
After your login, you will be redirected to your default project.
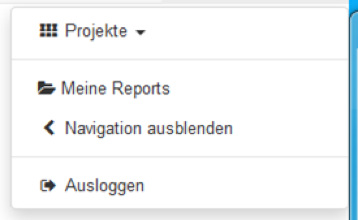
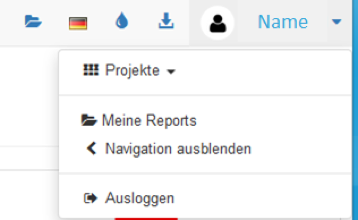
If you have been unlocked for multiple DataLion projects – studies, databases or other data sources – you can find an overview of all your active projects by opening the user menu by clicking on your name in the top navigation and then clicking on projects.
Start page and navigation
Depending on your projects, your start page can also include links to demo reports or study descriptions. You can access them by clicking on the images.
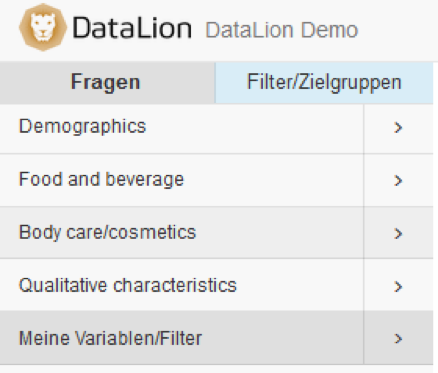
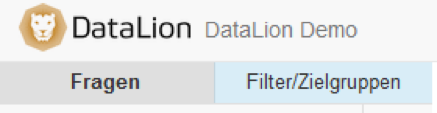
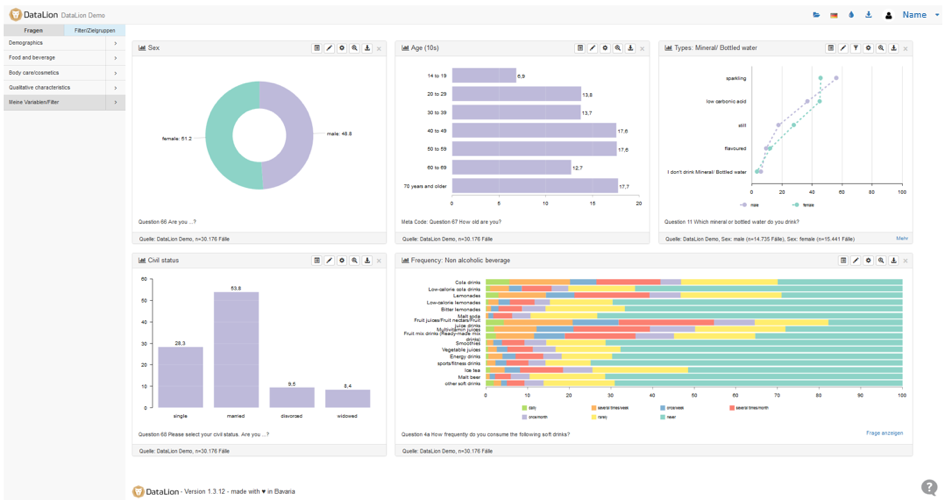
On the left is the navigation menu with all questions and variables of the active data set or study. The navigation is divided into two tabs: questions and filters / target groups.
You can hide and show the navigation in the user menu. To do this, click on your name and then on “hide navigation” or “show navigation”.
To go back to the start page, you can click either on the project in the user menu or on the logo in the top left corner of the screen.
Create your first charts
To create your first dashboard, select a variable by clicking on it in the left navigation menu. If it has an arrow symbol on the right, the navigation will open into subcategories.
Add a chart to the dashboard by clicking on the variable or drag it onto the screen. This way, you can add as many charts to the screen as needed.
We use cookies on our website to give you the most relevant experience by remembering your preferences and repeat visits. By clicking “Accept”, you consent to the use of ALL the cookies.
This website uses cookies to improve your experience while you navigate through the website. Out of these, the cookies that are categorized as necessary are stored on your browser as they are essential for the working of basic functionalities of the website. We also use third-party cookies that help us analyze and understand how you use this website. These cookies will be stored in your browser only with your consent. You also have the option to opt-out of these cookies. But opting out of some of these cookies may affect your browsing experience.
Necessary cookies are absolutely essential for the website to function properly. This category only includes cookies that ensures basic functionalities and security features of the website. These cookies do not store any personal information.
Any cookies that may not be particularly necessary for the website to function and is used specifically to collect user personal data via analytics, ads, other embedded contents are termed as non-necessary cookies. It is mandatory to procure user consent prior to running these cookies on your website.