The platform for market research institutes & agencies
Deliver interactive dashboards in your client’s own CI instead of static PPT decks — multi-client ready, with automatic tracking studies and a native PowerPoint report. Built by market researchers for market researchers. ISO 27001-certified hosting, GDPR-compliant, made in Munich.
DataLion is a web-based market research platform, made in Munich — built by market researchers for institutes and agencies. Deliver interactive white-label dashboards in your client CI instead of static PPT decks, run multi-client tracking studies that update automatically, and work GDPR-compliant, hosted in ISO 27001-certified data centers.
- 🇩🇪 Made in Munich
- GDPR-compliant
- DPA included
- Hosted in Germany
Trusted by research, insights & media teams
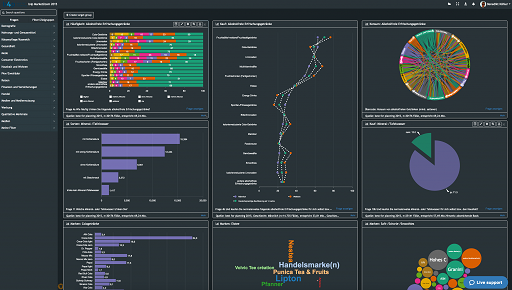
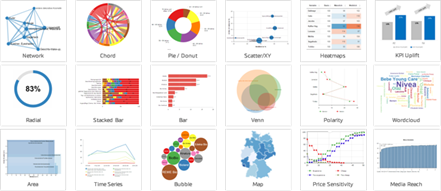
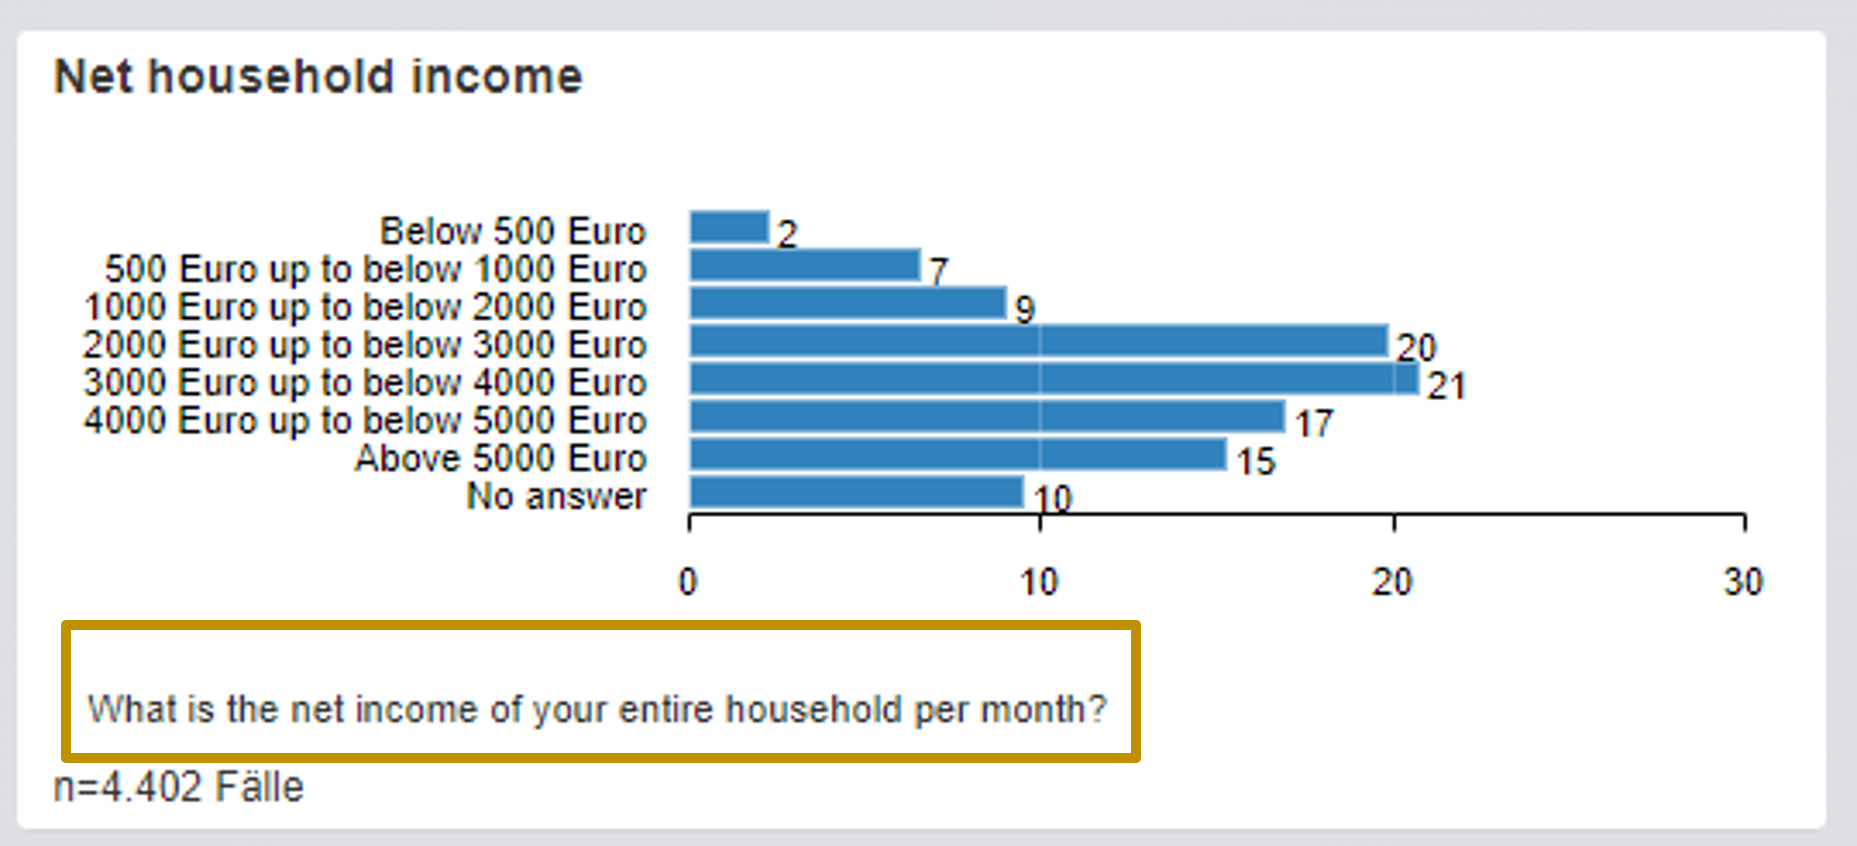
- 50+ interactive chart types
- 20+ statistical methods (R)
- 2 weeks release cadence
- ISO 27001 certified data centers (Germany)
From questionnaire to client dashboard — in one platform
Institutes and agencies usually juggle a tool chain: collection in one tool, prep in SPSS, charts in Excel, the client deck in PowerPoint. DataLion unites the whole chain in one platform — each step builds on the previous one, with no export and no media break, all the way to the finished deliverable for your clients.
Here is the continuous flow — each step has its own page with the full detail:
- Survey software: questionnaires with 20+ question types — answers become SPSS variables automatically.
- Data import & integration: SPSS incl. labels, CSV, Excel, ASCII and databases — automatically via API.
- Data preparation: weight, clean, recode — directly on the dataset.
- Analysis & statistics: 20+ procedures on an R engine incl. significance tests.
- Dashboard software: interactive client dashboards and reports in one click.
- AI market research: Claude & AI agents speed up setup and reporting via MCP.
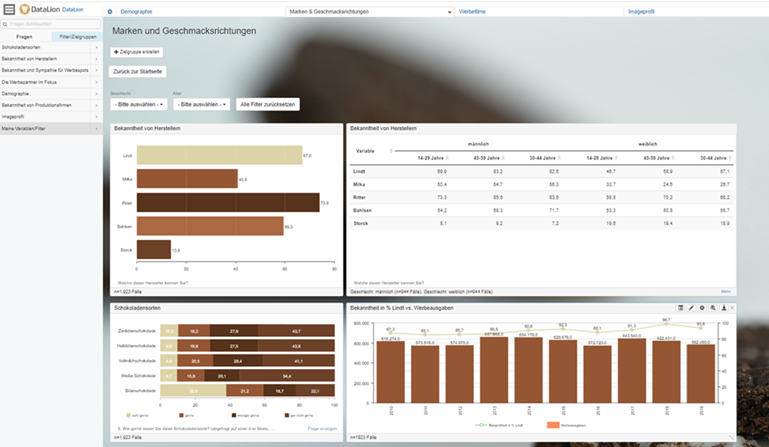
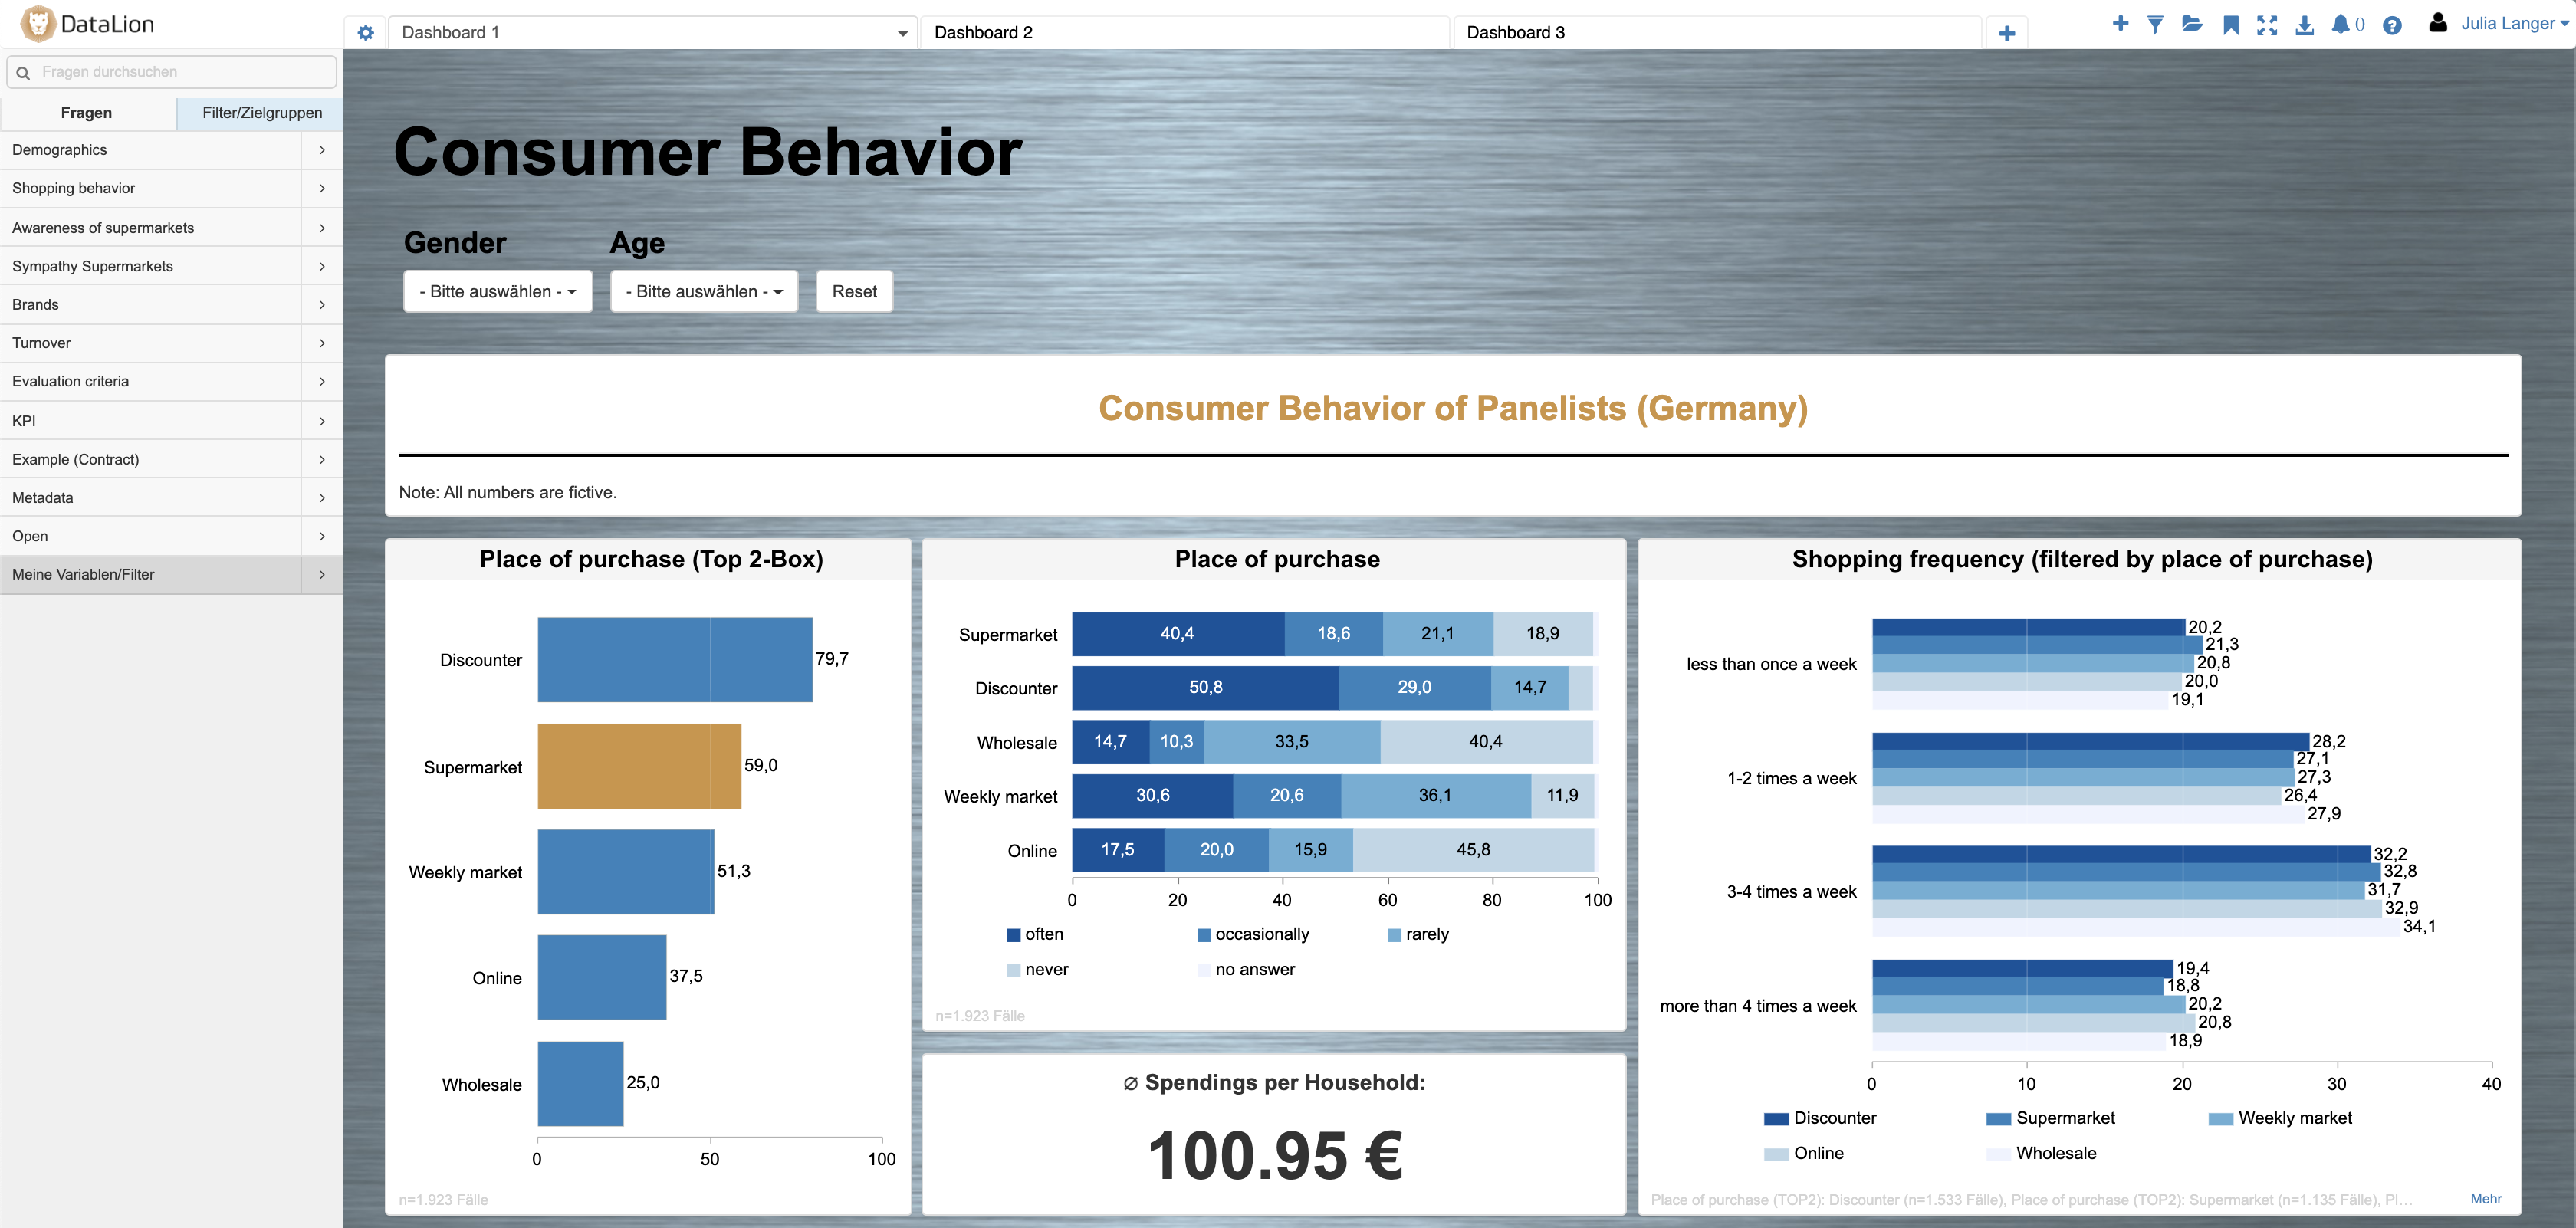
White-label dashboards in your CI — not static decks
Stop delivering a dead PDF and ship your clients an interactive dashboard portal in their own corporate design instead. Themes, colors, logo and custom CSS make every dashboard a showpiece — with no visible DataLion branding.
Your clients filter live, drill down into the detail and compare waves across flexible time series. That turns the interactive dashboard into a billable deliverable — and the reason clients keep coming back.
- Full whitelabel with themes, colors & custom CSS
- Interactive filters & drill-downs in real time
- Embed as an iFrame in client portals & websites
- The interactive dashboard as a billable deliverable
Multi-client ready: each client sees only their own data
DataLion is multi-client ready from the ground up. Create users, groups and roles for all your clients — every account sees only its own projects and data. That lets you safely run many clients in parallel on one platform.
Granular rights and roles control who can see, filter or edit which dashboards — per team, per client, per project. Ideal for agency setups with many parallel mandates.
- Multi-client ready for agency & institute setups
- Granular rights & roles per user and client
- Every account sees only its own data
- Single source of truth for internal & external teams
Tracking studies that update themselves
Continuous tracking studies are the bread-and-butter business of many institutes — and that is exactly what DataLion is built for. New waves import automatically via API at regular intervals, including recoding and weighting. Once set up, dashboards and reports refresh themselves wave after wave.
Instead of processing every wave by hand, new data flows into your existing setup — and your clients see the updated results as soon as they are available.
- Automatic import of new waves via API
- Automatic recoding & weighting per wave
- Dashboards & reports refresh wave after wave
- For tracking, ad-hoc, panel & CX studies
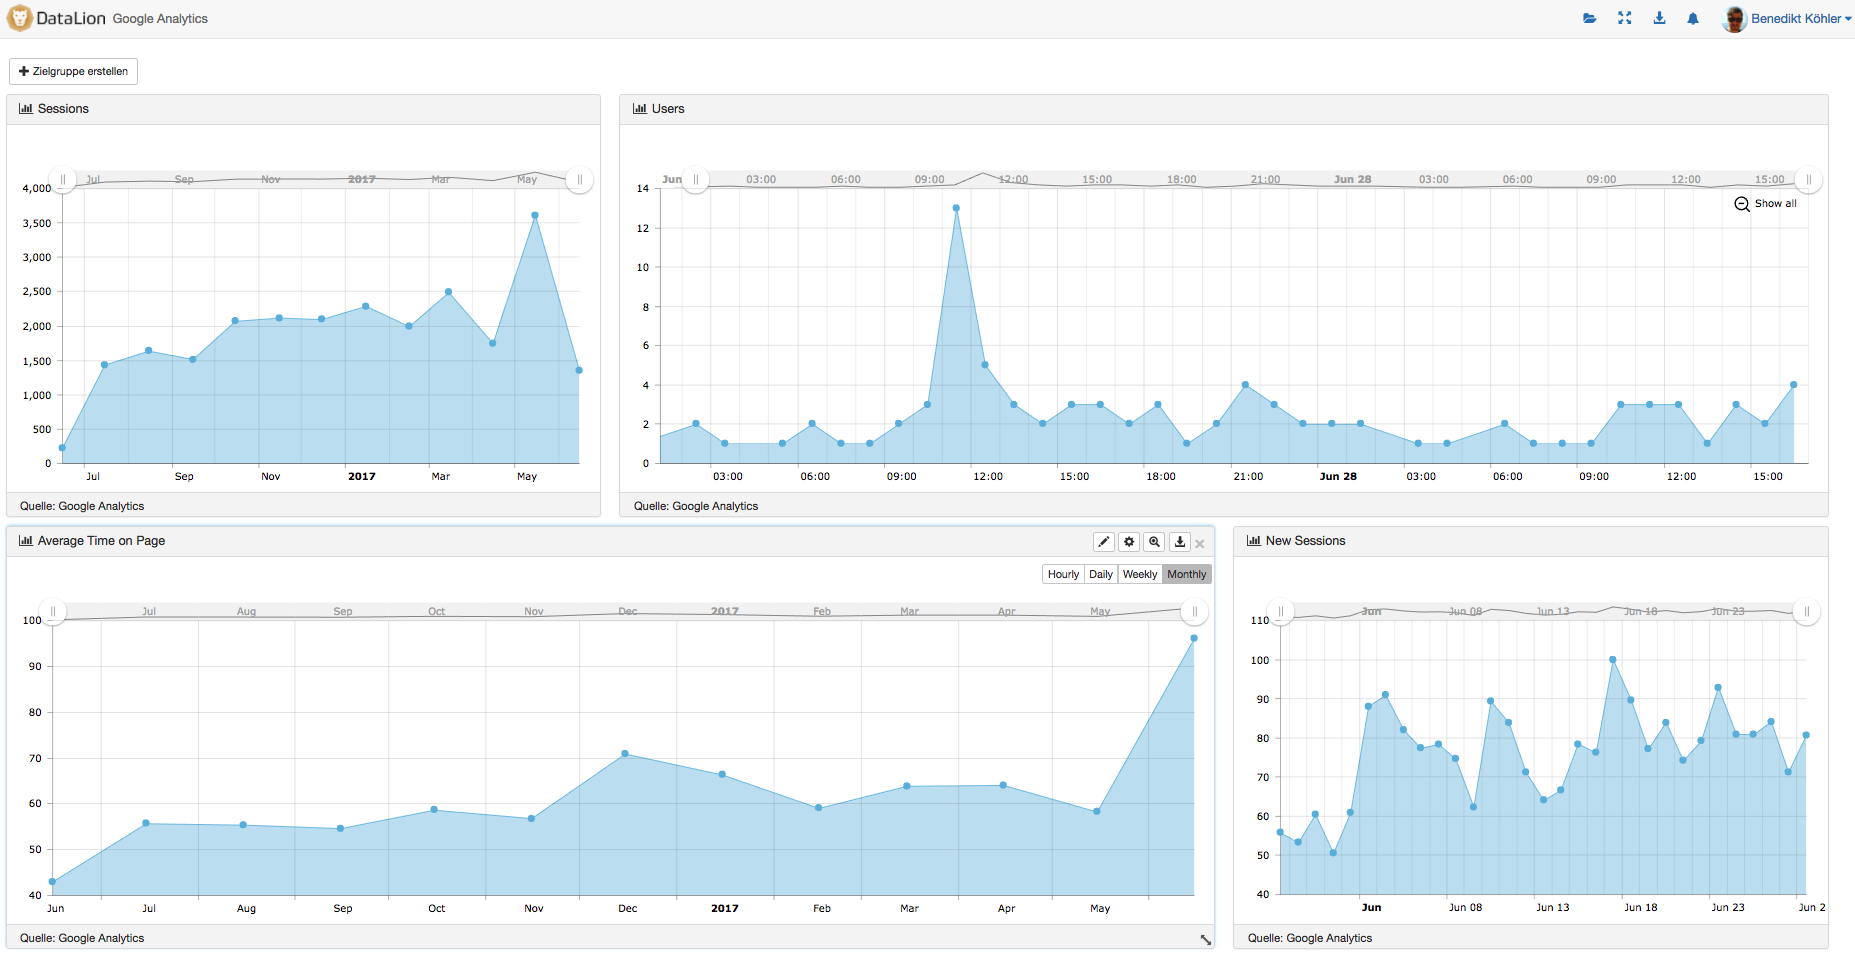
Table volumes & native PowerPoint export in client CI
When your clients do need a deck, export reports in one click as natively editable PowerPoint — with real PowerPoint diagrams and your own master in the client CI. Add flexible Excel report books with nested column headings, dynamic filters and KPI tracking.
Native to research: build table volumes with significance tests, means, top-2-box and NPS scores directly in DataLion — on top of 20+ statistical procedures on an R engine and confidence levels from 80% to 99%.
- Real PowerPoint diagrams with your own master in client CI
- Excel report books, PDF, CSV & JPEG
- Table volumes with significance, top-2-box & NPS
- Weighting, driver analysis, ANOVA & open-ended responses
Hosted, ISO-certified & GDPR-compliant
Sensitive respondent and client data belongs in safe hands. DataLion runs browser-based in ISO 27001-certified data centers in Germany — no installation, platform-independent on any device. Personal support in your language included.
- ISO 27001-certified data centers in Germany
- 100% GDPR-compliant, Data Processing Agreement (DPA) included
- On-premise hosting available, encrypted & IP-restricted access
- Browser-based, responsive & personal support — made in Munich
See DataLion with your own data
Start a free trial or book a personal demo — from raw data to a finished dashboard.

We now work much more efficiently, giving us more time to take care of the derivations and insights from the data for the customers.
The platform in detail
Common questions from institutes & agencies
Can I deliver white-label dashboards in my client’s own CI?
Is DataLion multi-client ready for several clients?
Is DataLion suitable for continuous tracking studies?
How secure is my clients’ data?
Which reports and table volumes can I build for clients?
Who is DataLion made for?
Ready to deliver dashboards as a deliverable?
Try DataLion free with your own studies — from the questionnaire to the white-label client dashboard. Or book a personal demo and see the platform live.