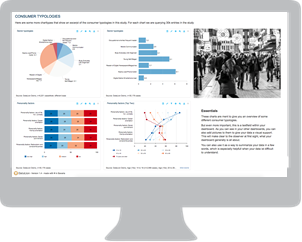
A new way to visualize your study & data with Associations Dashboards Solution
You are regularly publishing studies and send your members the reports as PDF or Excel? Publishing your studies as interactive visualized reports from DataLion dashboard software will make your data even more valuable for your members. With smart data analytics tools and associations Dashboards solution, They can dive deeper into your results, see the data visualization, and analyze them by target groups. Furthermore, you gain information about which data are used most frequently and can use these BI insights to further develop your studies.
Or you can use the DataLion dashboard software with a Freemium model to monetize your studies by offering a subset of the data for free and charge for deeper insights with a paywall.
Dashboards Solution for Associations
Dashboards are an important part of your business. The volume of data that is produced in companies every day is growing. And so is the need for data access, preparation and visualization as well.
The information hidden in many companies’ data jungles can be essential for decision-makers. They need an overview of the most important KPIs from sales, marketing, and HR. Quick and visually attractive dashboards – even on the road!
- Mobile first
- Access your dashboards and reports wherever you are. The DataLion dashboard software is adapting to different screen sizes of smartphones, tablets and desktops.
- Fullscreen mode
- All data at one glance. The fullscreen mode gives your dashboards and your insights full attention. This way, you can support meetings with maximum information and content.
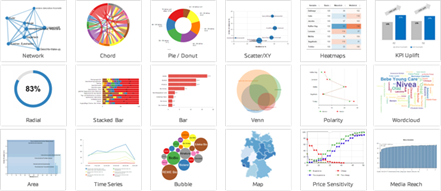
- 50 chart types
- More than 50 pre-defined chart types enable you to design your dashboards in a diverse and visually compelling way. And if this is not enough, you will be able to integrate your own JavaScript-based custom chart types.
- Export
- If you need your data in a “usual” file format later, you can always export your charts and dashboards as PDF, PowerPoint, Excel or image files. Of course, in your own layout and PowerPoint master. This enables you to create complete presentations within a few minutes, which normally take hours or days.
Test DataLion Dashboard software Free Demo Now:
- Associations Dashboards Solution
- Data analytics for Agencies
- Enterprise Dashboards: Efficient Management Reporting for Business
- Human Ressources
- MARKET RESEARCH INSTITUTES
- Marketing Data Solutions
- Media
- Sales
- Startups Dashboard Solution
- DataLion Executive Suite – Ready-made high-quality business dashboards