With your HR cockpit in HR dashboards solution, all important key figures are always in view in your data analytics strategy
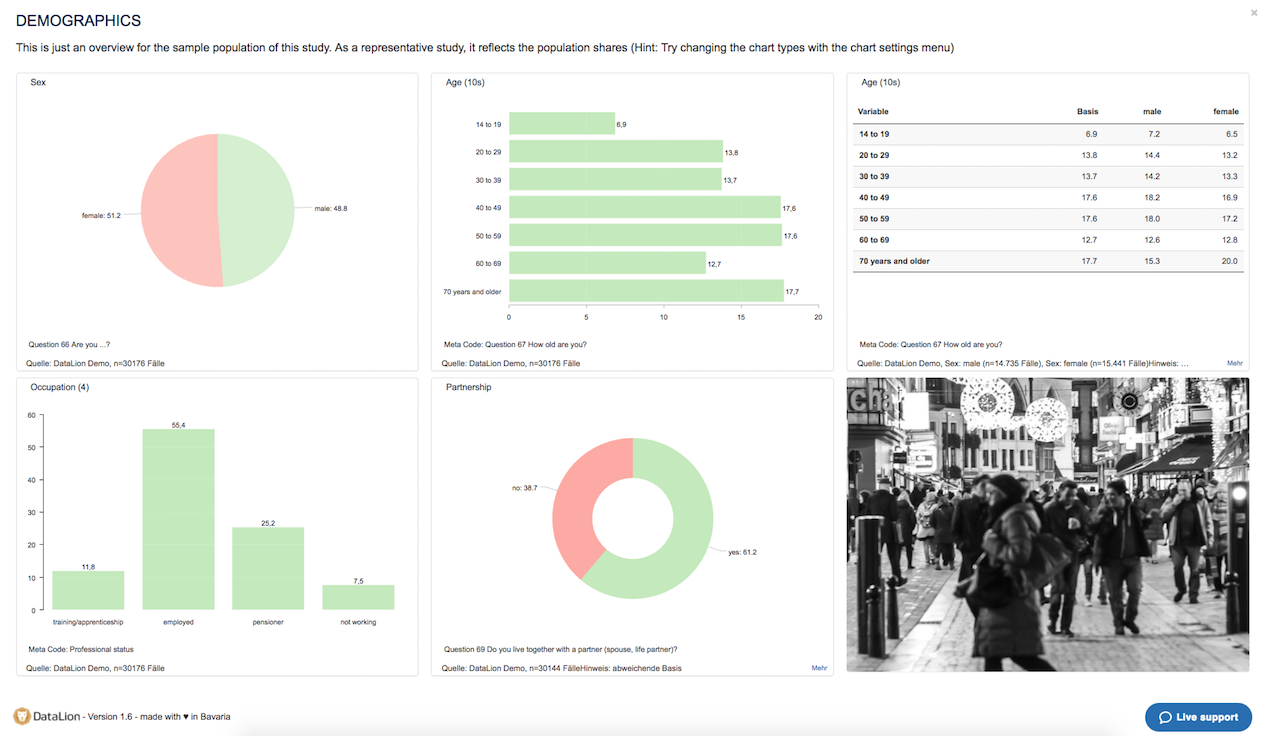
In DataLion, you can create key figure cockpits for the HR dashboards using Drag & Drop. In this way, you always keep an eye on the most important key figures from the personnel area. The graphical representation of the KPIs as a dashboard provides you with a quick overview. At the same time, you can call up more detailed information at any time with a “Deep Dive”.
What is an HR Dashboard Solution? Which questions can I answer?
A human resources dashboard helps companies evaluate HR data in a way that enables data-driven decisions to be made:
- What channels should recruitment focus on?
- What are the differences in the abilities and skills of the employees?
- How many employees belong to the high potentials and how can these employees be encouraged and retained?
- What is the company’s potential with regard to the most important skills in the coming years?
KPIs for Human Resources
The following subjective or “soft” indicators are among the most important indicators from personnel management that are perfectly suited for preparation as a dashboard solution. The data can, for example, come from employee surveys:
- employee satisfaction (actual vs. target)
- Involvement with the company
- Commitment
- load and strain
- Work-Life-Balance
- Attractiveness of the employer
- Talent Matrix
- Diversity
By the way: With a professional data visualization software like DataLion you make sure that every employee in the personnel area only has access to the data for which she has authorization.
“Hard” KPIs for HR dashboards solution
But the objective, “hard” key figures can also be very well integrated into a human resources cockpit of the HR dashboards solution:
- Headcount
- Long absences and costs
- New settings
- Fluctuation
- Open positions
- Promotion rate
- Personnel costs
- Education and training costs
- Turnover per employee
- ROI per employee
- Sources of personnel recruitment
Individual KPIs can be visualized as tachometers, donut diagrams or traffic lights. Several KPIs can also be displayed combined as spider web diagrams or in multivariate displays such as scatter plots.
With the click of a mouse, the information can also be filtered according to the most important dimensions, e.g. age, gender, location, department, function, working time, length of service or even time periods. Of course, your HR dashboard and all exports from it can be completely adapted to the corporate identity of your company.
Interested in the HR dashboards solution?
We will be happy to demonstrate our software to you on the basis of a sample project or create an individual offer for your human resources dashboard.
- Associations Dashboards Solution
- Data analytics for Agencies
- Enterprise Dashboards: Efficient Management Reporting for Business
- Human Ressources
- MARKET RESEARCH INSTITUTES
- Marketing Data Solutions
- Media
- Sales
- Startups Dashboard Solution
- DataLion Executive Suite – Ready-made high-quality business dashboards