Data-Driven Research, Beer tasting @ Bits & Pretzels
Monday evening was a special evening at the DataLion office in Munich. We hosted a beer tasting event as an official side-event of the Bits & Pretzels Founders Conference and Startup Night. Together, we had fun in making Data-Driven Beer Research.
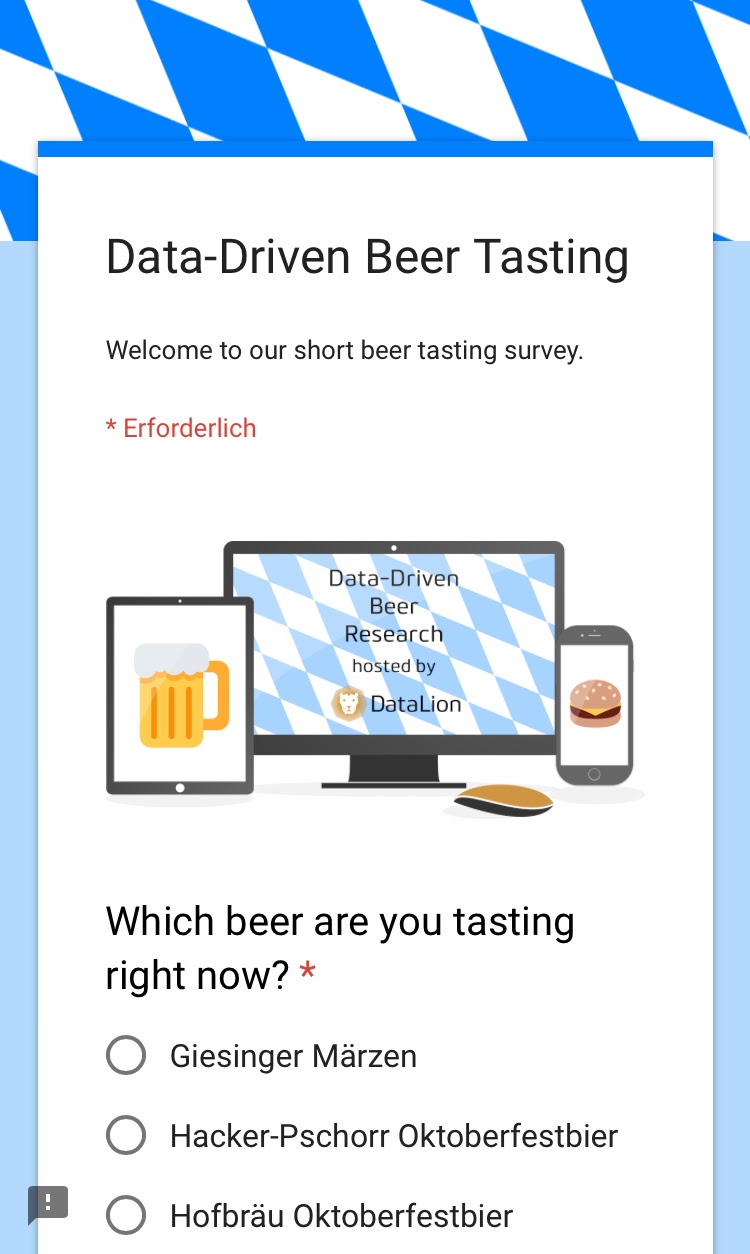
Data-Driven Research from different types of beers
Together with beer sommelier Stefan Hermansdorfer, we tasted six different beers from Munich and surroundings that were all in the Märzen or Festbier style (Hacker-Pschorr, Augustiner, Hofbräu, Tilmans Das Helle, Eittinger and Giesinger). One of them even had a lion on the label. And because we all love data, we also created short data-driven survey research for describing and scoring the beers in terms of appearance, aroma, and, of course, taste.
Visualize instantly with Beer Dashboards
All results were displayed in a DataLion real-time dashboard in our conferencing room: We chose radar charts for our live visualization because they allow comparing the different taste profiles of the beers very intuitively at one glance. Every time one of our guests rated a beer, the results were updating and showing the new rankings.
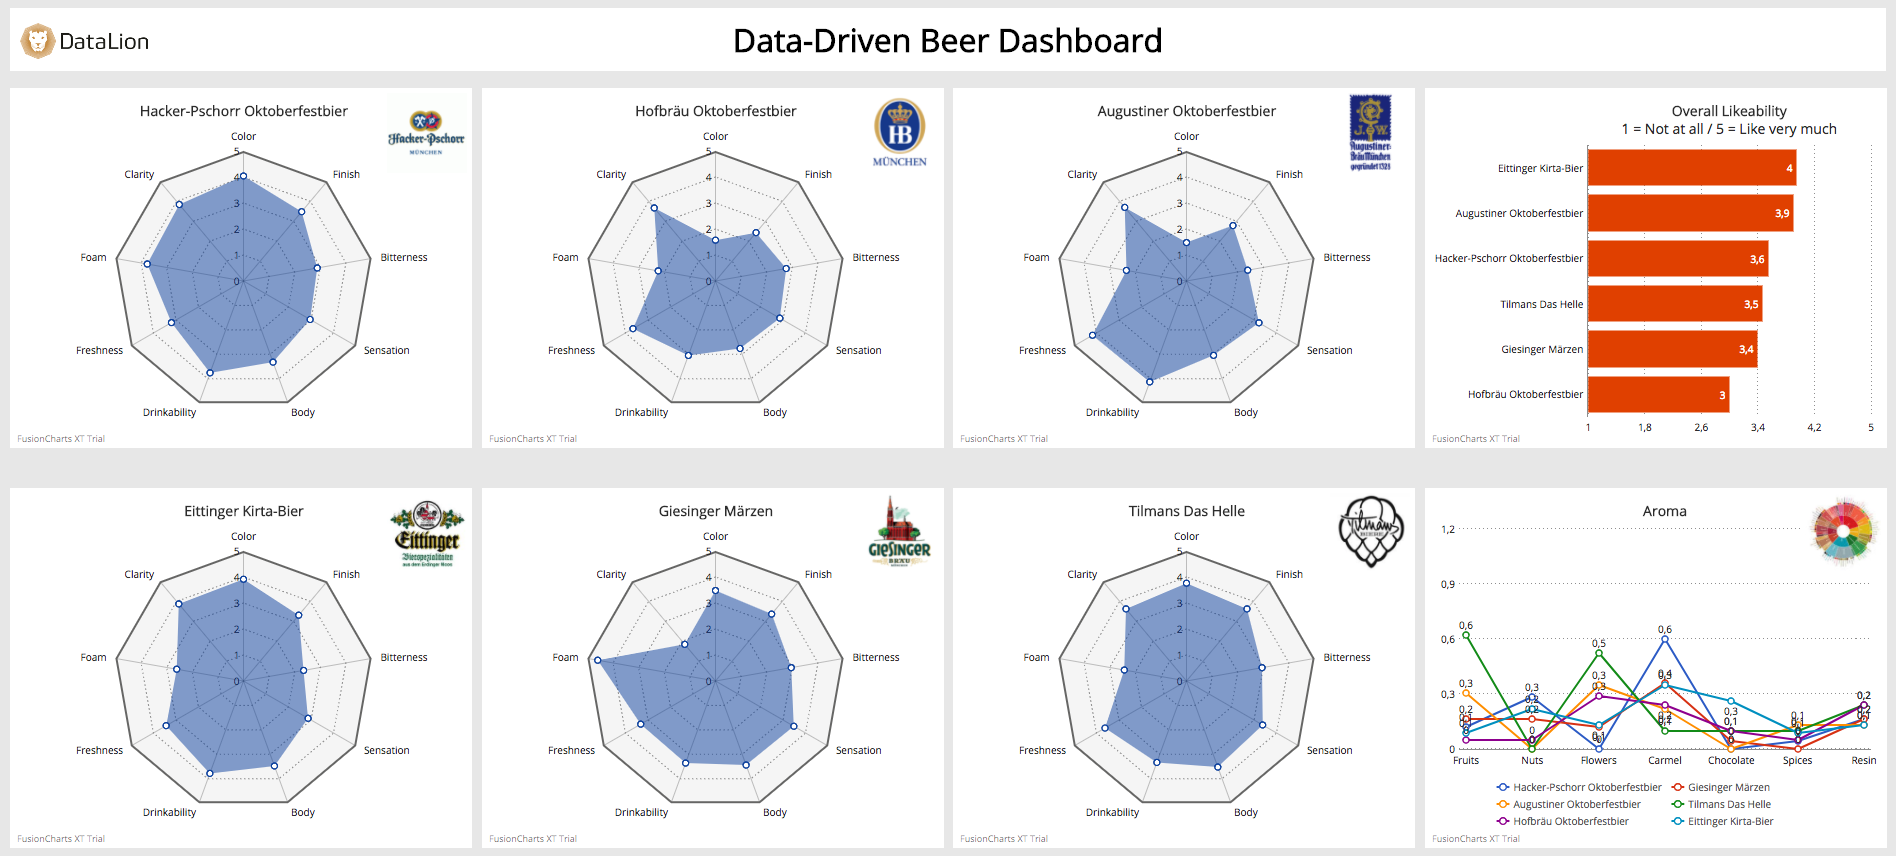
You can see the live dashboard at this link. If you're interested in live dashboards that are connected to a quick survey for your business, just leave a message on our contact page.