“Data is power”: by now an established fact. “Music is power”: a universal truth. So what do we get, when we creatively combine the plethora of available data on music with analyzing techniques and powerful software? We gain knowledge, insight and tremendous inspiration. We have gathered some really interesting and inspiring creative visualizations, apply machine learning both interactive and non-interactive visualizations on the evolution of music as well as on current distinctive trends. Enjoy!
Creative Music Visualizations
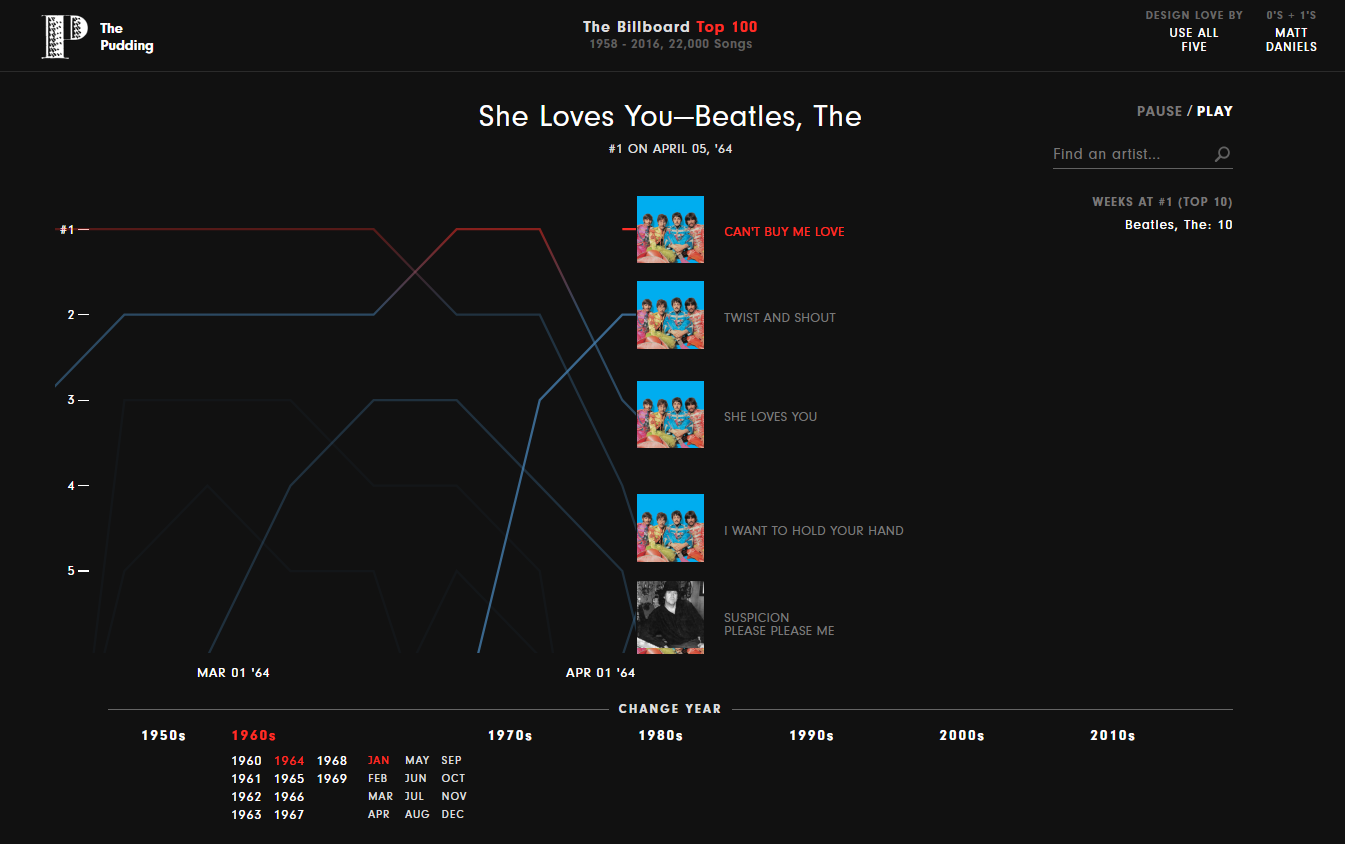
Using data from the Billboard Top 100 Data 1958 – 2016, The Pudding´s Matt Daniels has visualized the evolution of musical taste on a month-to-month basis over the years: every top 5 songs from 1958 to 2016 in the U.S. Headphones required – it´s a “soundalized” visualization!