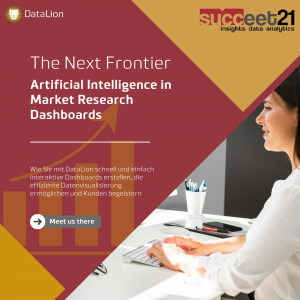
Meet and succeed with DataLion: “Succeet21” – Stand. 114
On October 27th and 28th, the market research fair Succeet21 will take place in Munich – the trade fair for insights and market research. After there was initially a virtual trade fair in spring 2021, a face-to-face event will now also be held. With the motto: Meet and succeed, DataLion will be happy to present as an exhibitor on both days of the fair.
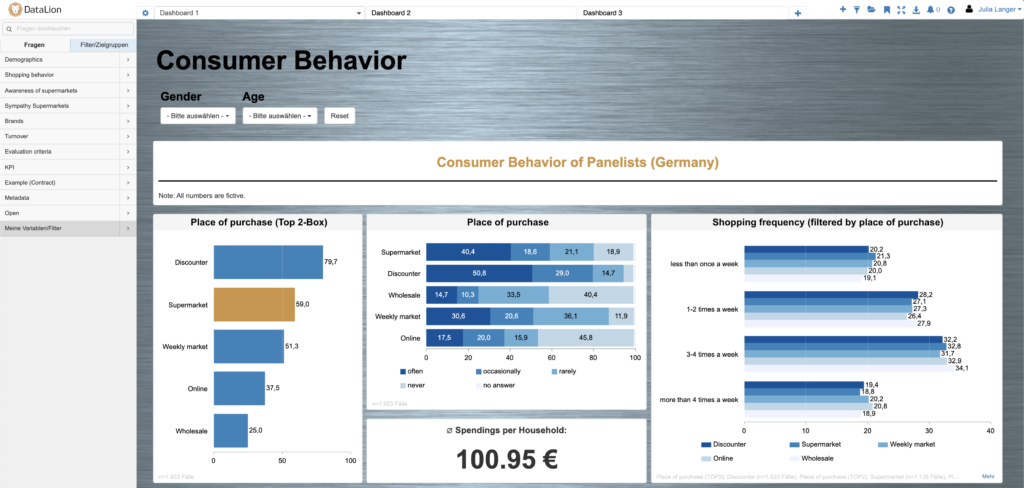
Are you on-site? Come by and visit us! Our booth has booth number 114. Let us arrange a meeting in advance by simply sending us a message with the form below. We are ready to show how you can use DataLion dashboard software to quickly and easily create interactive dashboards that enable efficient data visualization and inspire customers. We look forward to welcoming many new and familiar faces to our stand.
Continue reading “DataLion at Succeet21 – AI in Market Research Dashboards”→
DataLion is exciting to join the two events of DMEXCO & DIGITALX to join the discussions with other businesses in Europe about business analytics, digital business, marketing, and innovation this September. We are fascinated to share with all Data-fan some great insights which are sharing during the events.
Dmexco – Digital Marketing Exposition & Conference
From the beginning, we designed DataLion as a dashboard software for market researchers. One reason for this is certainly our professional background in the industry. But what exactly makes a market research dashboard software? Since we are asked time and again what exactly differentiates DataLion from other software platforms, we want to shed light on the topic of “Dashboards for Market Research” from different perspectives in a series of blogposts and go into more detail about the special features in data, chart types, metrics, and reporting, among other things.
Do we all know how important it is to have the right Dashboard Tools?
Dashboard tools are playing an increasingly important role for companies for a reason: Without the right dashboard platform, the growing mountains of data can hardly be analyzed and presented in an understandable way. Business Intelligence (BI) without the appropriate software solution is not possible. However, finding the right software for the company is anything but easy. This article explains what you should consider when looking for a suitable dashboard tool.
Continue reading “DASHBOARD TOOLS CHECKLIST: HOW TO FIND THE RIGHT DASHBOARD?”→
What are the most common big data challenges when it comes to your data analytics? How to use a holistic data strategy to make big data and data analytics child’s play and maximize your return on data?
Solving problems and developing innovations for Big Data
Data is the new oil. But while the use of oil was relatively clearly defined, there are much more possibilities in data. It’s an endless story.
Almost all companies are facing the challenge of having tons of data from very heterogeneous sources. But often, they lack a clear vision of what the data could be used for. What are new business models that can be fueled with the data? Which data products can be defined and sold by the company? The solution is big data Design Thinking.
Continue reading “Big Data Design Thinking”→
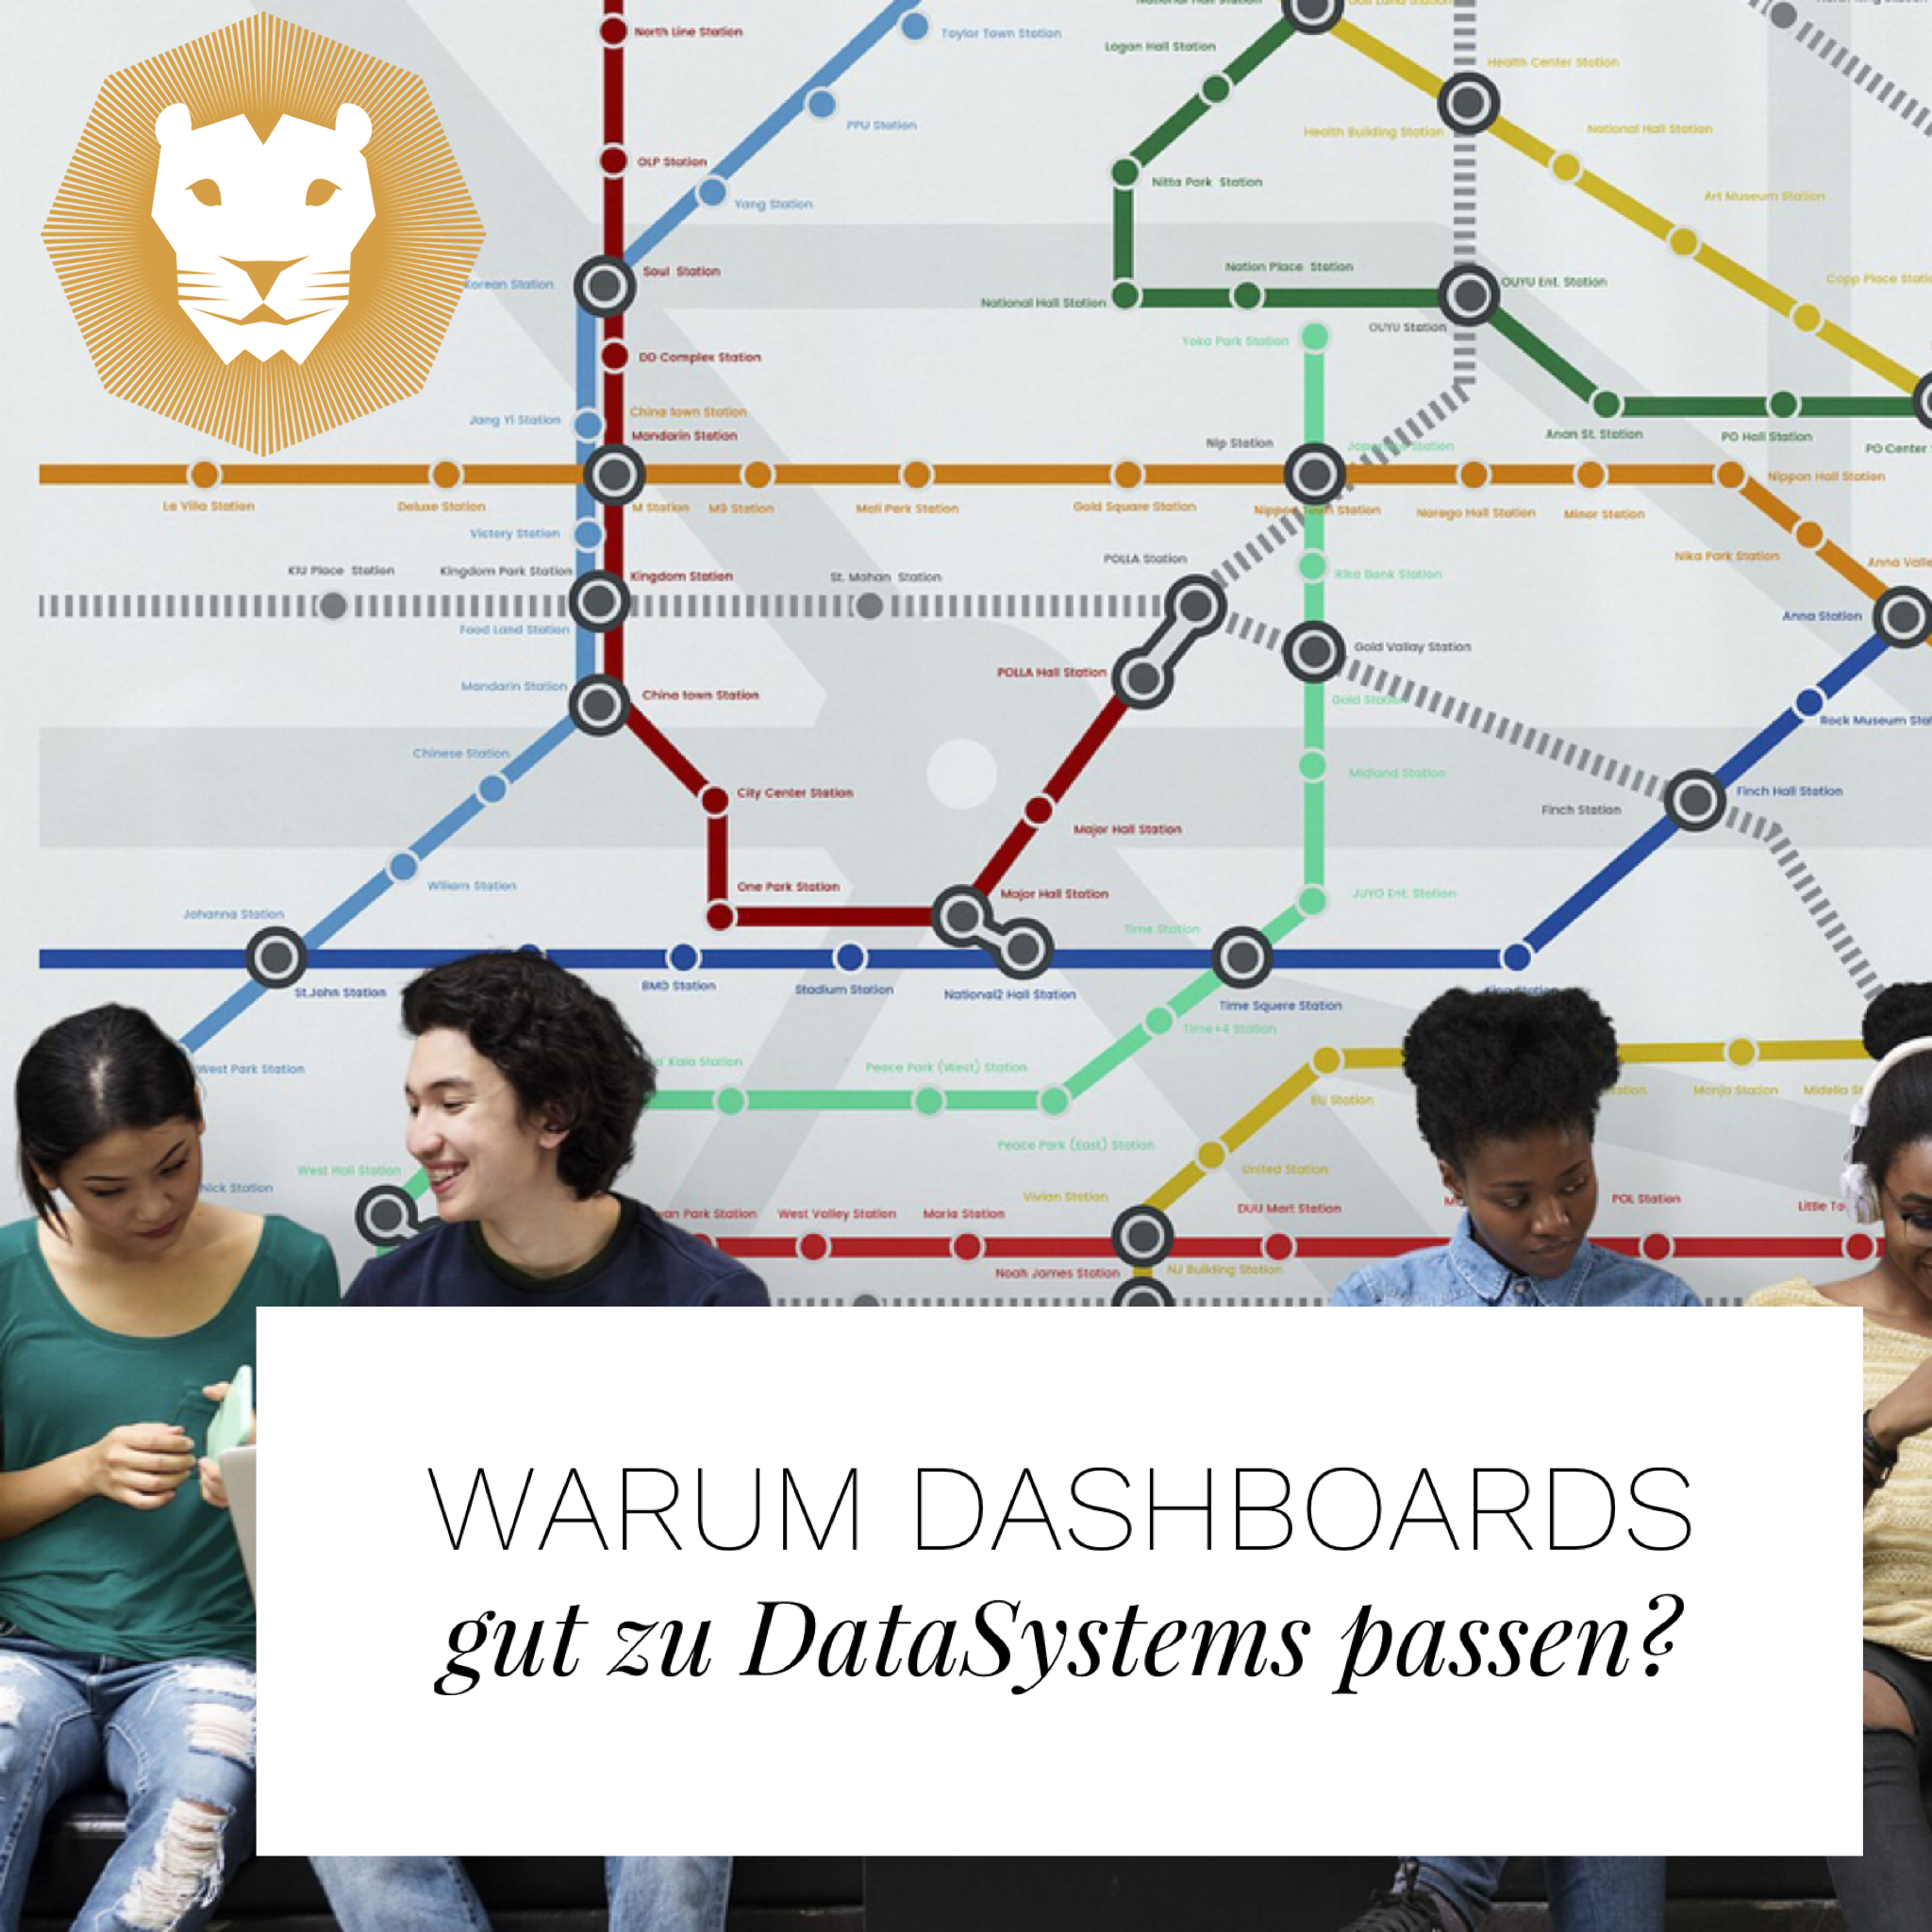
Why exactly do dashboards and data systems go so well together? That is the topic of the article by Benedikt Droste, Senior Data Analyst at MSR Consulting Group, and Holger Geißler, CMO of DataLion, which was published on Marktforschung.de as part of the topic dossier “Plattformen und Datensysteme 2019”. First, the authors explain how data systems are created in the first place. The way to create a data system is described in five steps: Continue reading “WHY DASHBOARDS ARE A GOOD FIT FOR DATA SYSTEMS?”→
In Data visualization, dashboards are a great way to make sense of complex data. How effective a dashboard is, however, ultimately depends on the specific composition. In modern dashboard systems like Datalion, the compilation of charts is easy, but how to choose the right chart types? Check our Data visualization tips to make your dashboards perfectly. Continue reading “Data visualization tips: these chart types are worth a thousand words”→
In the age of big data, business intelligence and artificial intelligence, data plays an increasingly important role for companies. Dashboard solution is now widely used, bringing data to the point and thus becoming an important basis for decision-making. If you are visualizing your data, these dashboard tips might be helpful for you.
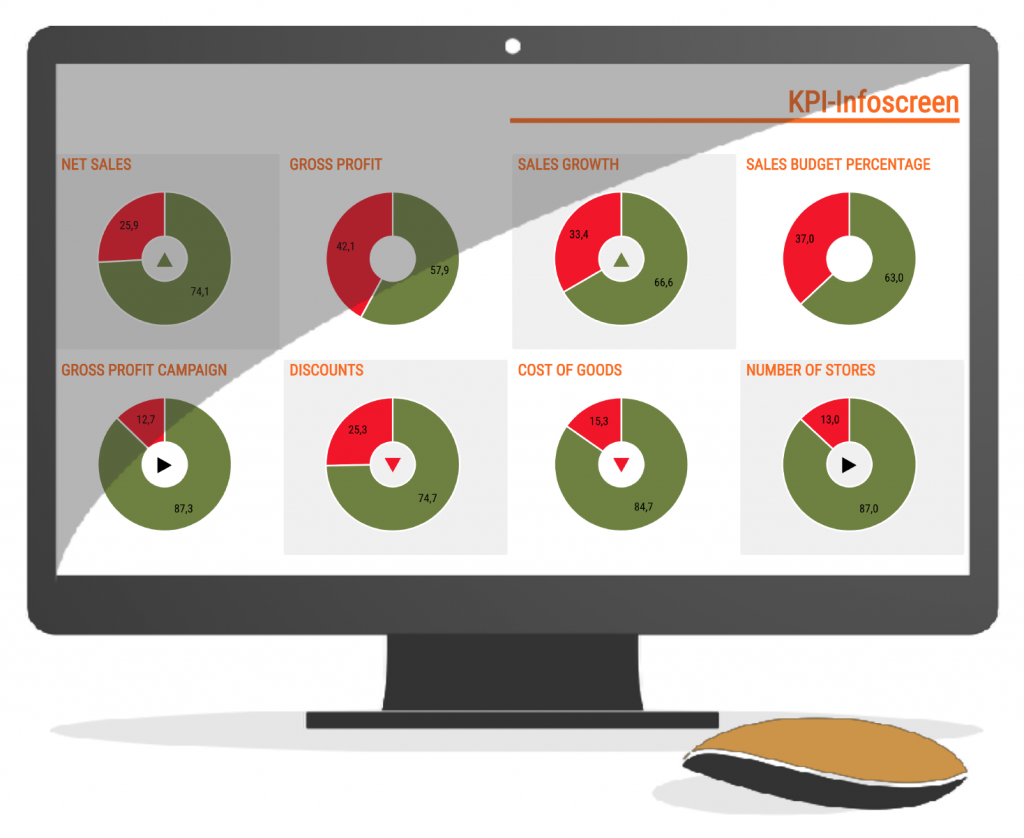
Key performance indicators or KPIs are not just a big issue in most companies since the growing importance of business intelligence software. However, it is very controversial which KPIs actually lead to success. Which are superfluous? Which indicators are more misleading than helpful? Even dashboard solutions are an indispensable part of KPI reports, as they are the only ones that develop their full potential here. Imagine you are still late in the office finishing your presentation for the next morning’s board meeting. That’s where it helps if you can easily pull up the real-time KPI dashboard in the BI system.
We use cookies on our website to give you the most relevant experience by remembering your preferences and repeat visits. By clicking “Accept”, you consent to the use of ALL the cookies.
This website uses cookies to improve your experience while you navigate through the website. Out of these, the cookies that are categorized as necessary are stored on your browser as they are essential for the working of basic functionalities of the website. We also use third-party cookies that help us analyze and understand how you use this website. These cookies will be stored in your browser only with your consent. You also have the option to opt-out of these cookies. But opting out of some of these cookies may affect your browsing experience.
Necessary cookies are absolutely essential for the website to function properly. This category only includes cookies that ensures basic functionalities and security features of the website. These cookies do not store any personal information.
Any cookies that may not be particularly necessary for the website to function and is used specifically to collect user personal data via analytics, ads, other embedded contents are termed as non-necessary cookies. It is mandatory to procure user consent prior to running these cookies on your website.