Dashboards for Market Research – Part 2: Integrating Different Data Sets and Timelines

Dashboard software for market researchers – Part 2

.
Check the Part 1 – Dashboards for Market Research of the series here: Part 1 – Data
.
DataLion is designed as a market research dashboard software for market researchers. This is certainly because of our professional background in the industry. We want to shed light on the topic of “Dashboards for Market Research” from different perspectives in a series of blog posts. After our first article: Dashboards for Market Research – Part 1: Data, in the second part of the series “Dashboards for Market Research” we want to take a look at the challenges that arise from combining different studies within one project – especially concerning timelines.

Timeline KPI dashboard
Background vector created by rawpixel.com – www.freepik.com
Continue reading “Dashboards for Market Research – Part 2: Integrating Different Data Sets and Timelines”

Dashboards for Market Research – Part 1: Data

From the beginning, we designed DataLion as a dashboard software for market researchers. One reason for this is certainly our professional background in the industry. But what exactly makes a market research dashboard software? Since we are asked time and again what exactly differentiates DataLion from other software platforms, we want to shed light on the topic of “Dashboards for Market Research” from different perspectives in a series of blogposts and go into more detail about the special features in data, chart types, metrics, and reporting, among other things.

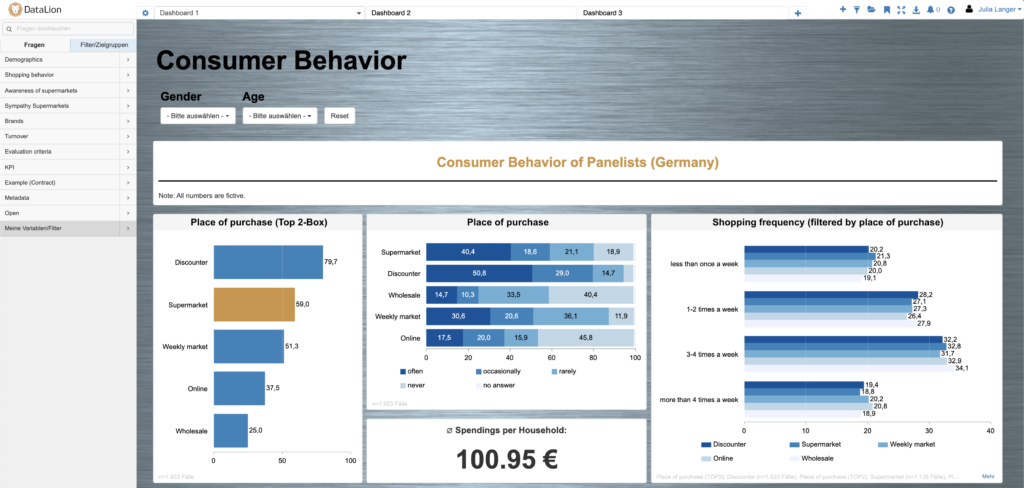
Market research consumer behavior sample in dashboard reports

Continue reading “Dashboards for Market Research – Part 1: Data”