DASHBOARD SOFTWARE VERSION 2022.2 RELEASED

The new Version 2022.2 is here! DataLion wishes you a relaxing summer and makes it easier for DataLion admins to work with the software: Filter and delete data online, an overview page for project reports, as well as ownership and exports with notification. There are also new features for data visualization such as the network chart for showing connections, a revised chord diagram and new functions for the calendar drop-down menu. At the same time, we further reduced the number of page reloads and improved the usability of the project setup for a more pleasant user experience.

A comprehensive overview of all improvements and new features can be found here.

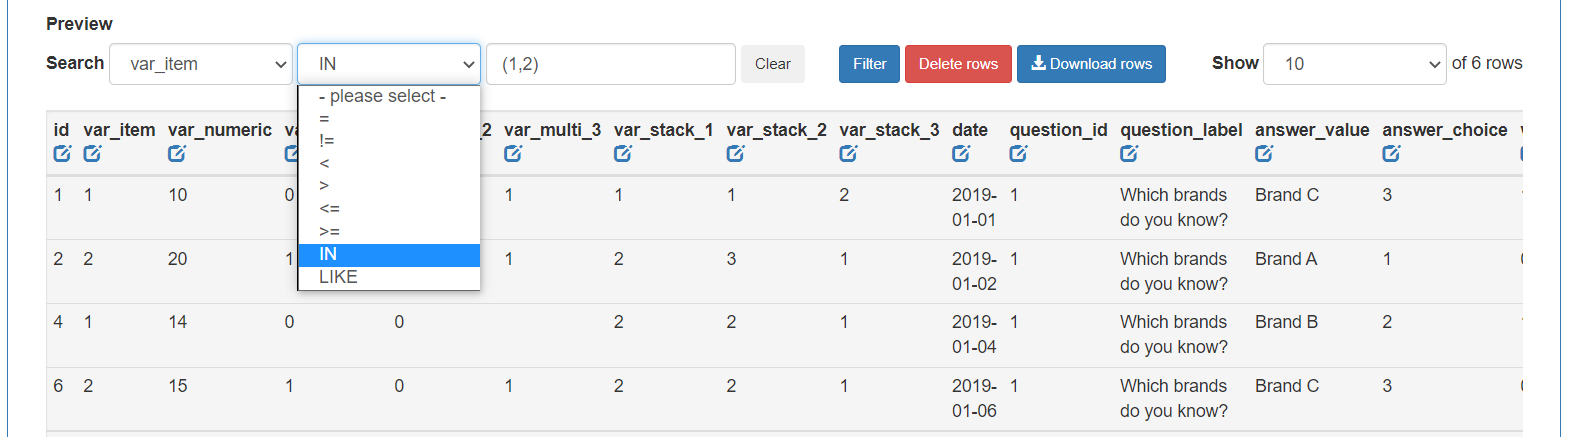
Edit data tables online in DataLion

Data tables can now easily be filtered online in DataLion and the filter selection can be deleted. An example: The data of a new wave was imported into the project, but the data has to be changed again. Simply filter on this wave in your table, delete the entries and then import the current data. This means that not all of the project data has to be removed and re-imported. The filter function can also be used to find out the number of cases for an entered condition, e.g. WHERE var_item IN (1,2) returns the cases where the variable var_item = 1 or = 2. Filtered data can also be exported. Learn more here mehr.

Datenfiltern.png

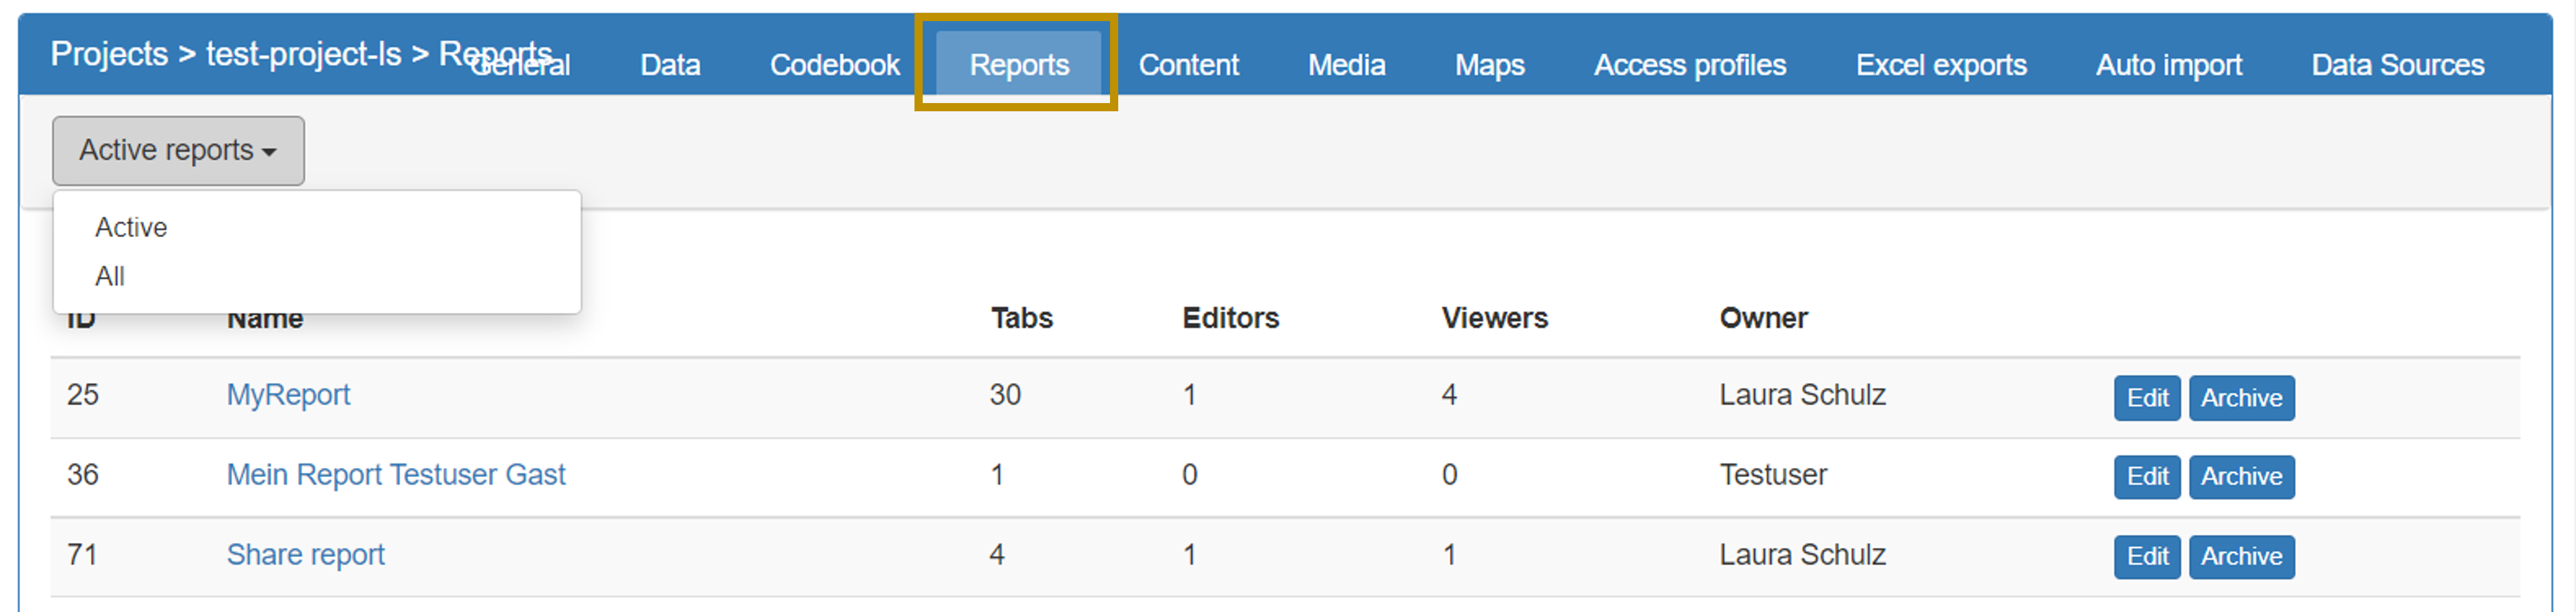
As an admin, keep track of projects with the new report overview!

The report overviewhelps you to know which reports exist in a project and who has rights to them. The report overview is a list of all reports in the project with the report owner and a link to the corresponding report settings (“Edit”). There is also the option in the report overview to organize reports into active and inactive. Inactive reports are listed as archived in the frontend, but can be retrieved via the report overview if required.

Also new is that report ownership can be changed. The change can be made in the report settings.

Reportsubersicht-1.png

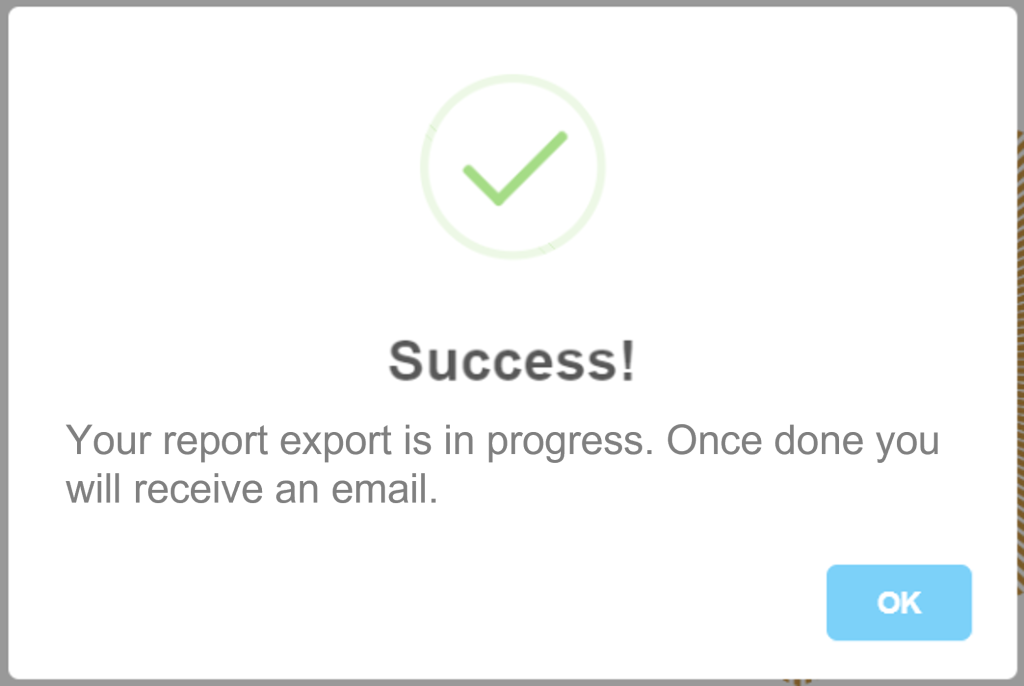
Export large amounts of data with notification

Exports of data tables or exports of reports/dashboards in formats such as xlsx, PDF or pptx can now also be carried out as a queue job with notification. This is particularly useful for large amounts of data to be exported, e.g. reports with a large number of tabs and charts. The user can simply continue working while the export is being generated in the background and will conveniently receive a notification to the stored e-mail address after completion.

Find out here in the Project Settings – Reports and Dashboards section how the report export with notification is activated and here in the Export Project section how the table export with notification for access profiles is activated.

Export-1-1024x686.png

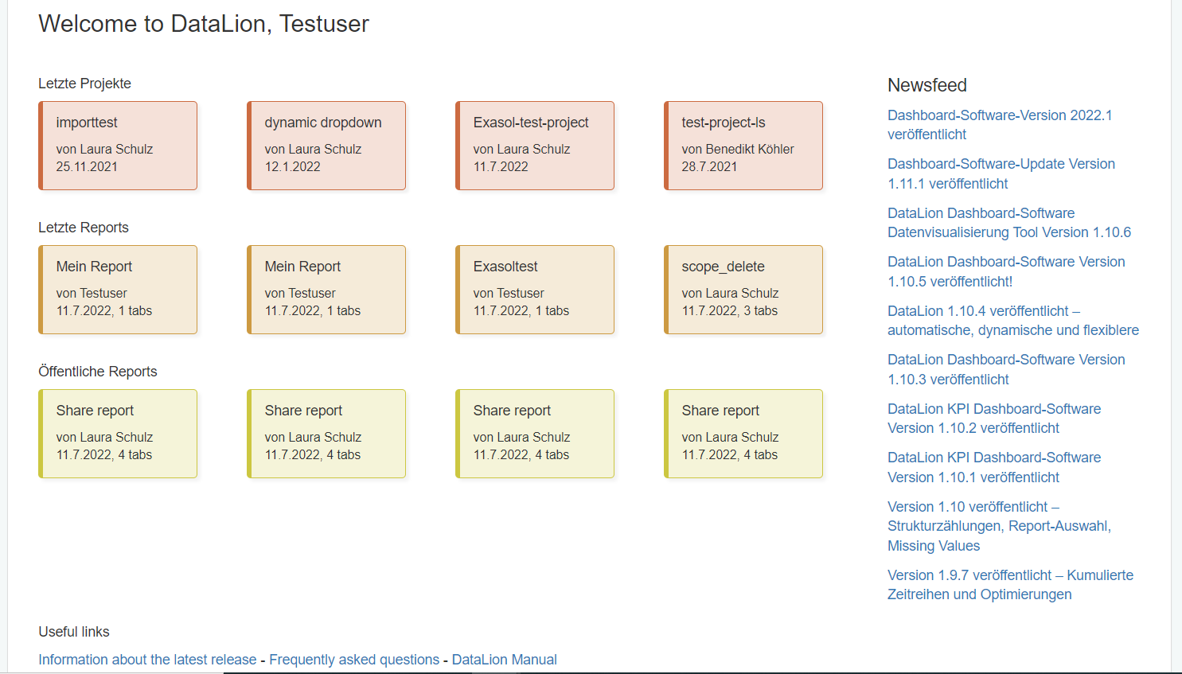
DataLion start page with your personal recent work and the latest DataLion information

The start page gives you an overview of your recent work and navigates you directly to your dashboard by clicking on an item. You will also find helpful links to the DataLion documentation, the latest announcements and release logs on the start page.

The start page is displayed after login if no default project is applied, to which you are automatically forwarded after login.

Startseite-1.png

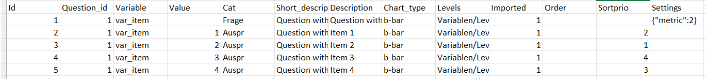
Set up large dashboard projects quickly and clearly: define metrics via the codebook

In DataLion, representations can be output in many different metrics, e.g. percent, absolute values, sums, maximum, minimum, etc. You can first define a default metric at project level and then change this metric in the frontend for each chart if desired, e.g. from absolute values to percent. This second step can now also be carried out in a time-saving manner via the codebook and thus significantly reduce the number of clicks in the front end, especially in large projects with many charts and dashboards. Learn more about how to define the metric per chart via the codebook here.

mceclip4.png

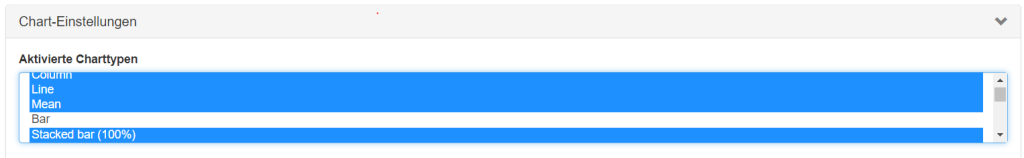
Select project chart types

The chart types that are available in the project can be selected in the Project backend > General > Chart settings. The chart IDs no longer have to be entered.

mceclip2-1024x158.png

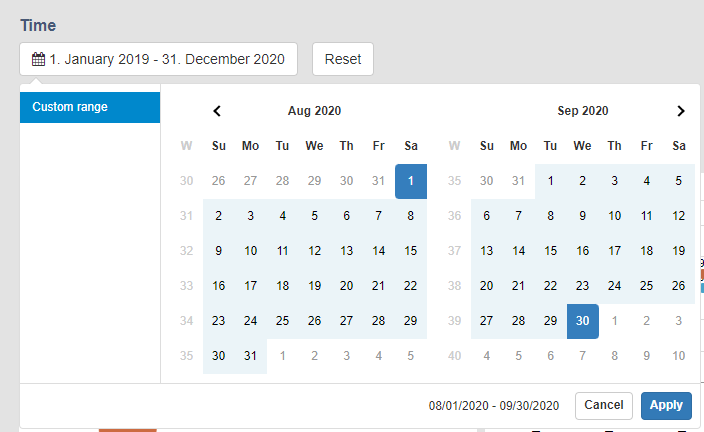
The datepicker has evolved: default time periods

Additional periods are now available for the date picker (calendar), which can be defined as default time periods. With a default time period, the dashboard is always displayed to the user as a standard, filtered to this preset time period. Find outherein the Datepicker section (time series menu) how to define a default period for the datepicker.

datepicker.png

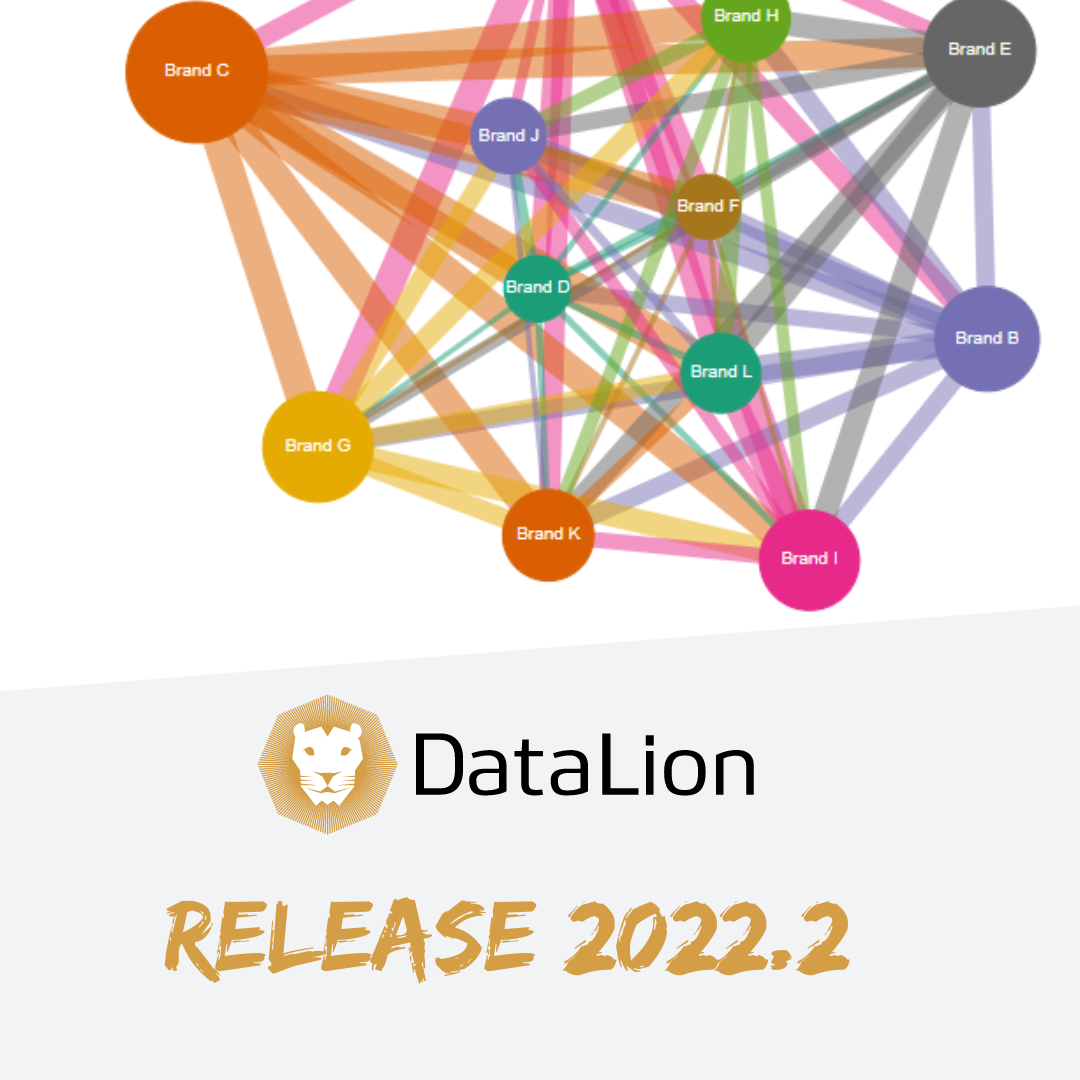
Visualizing interconnectivity: The network chart

The network chart shows how things are connected to each other. Variables are shown as nodes that are linked to each other via lines. The size of the node indicates the absolute value of the node. The lines show with which nodes there is a connection and how strong this connection is. For example, it is easy to visualize which brands were named together with other brands in an open mention and how often they were named together with the other brand (line width).

networkchart.png

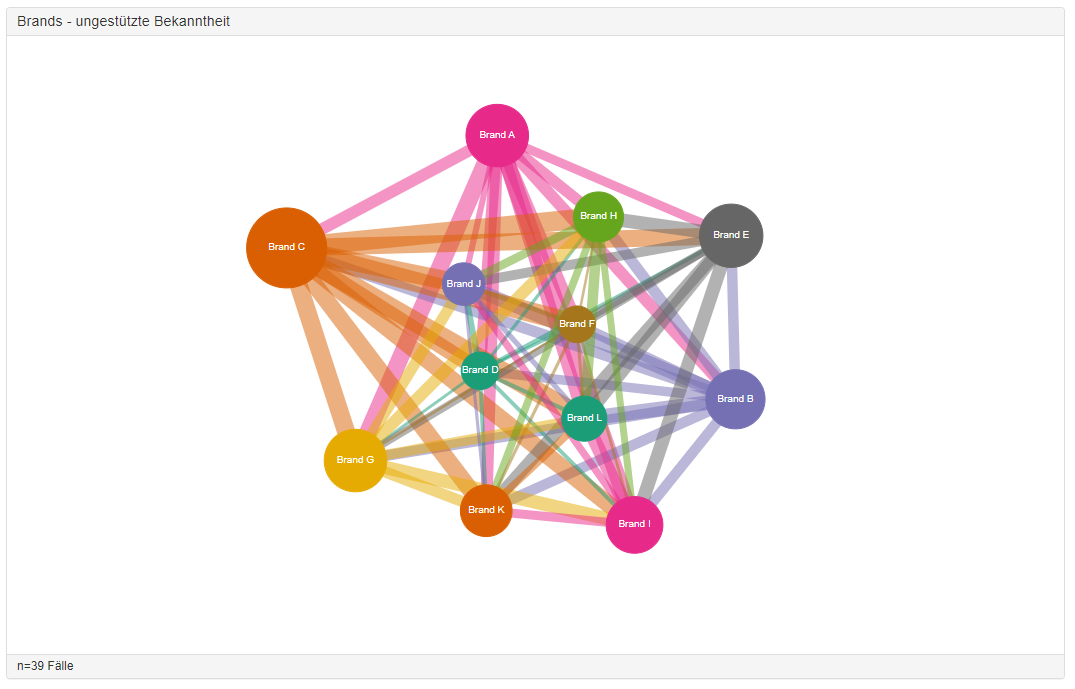
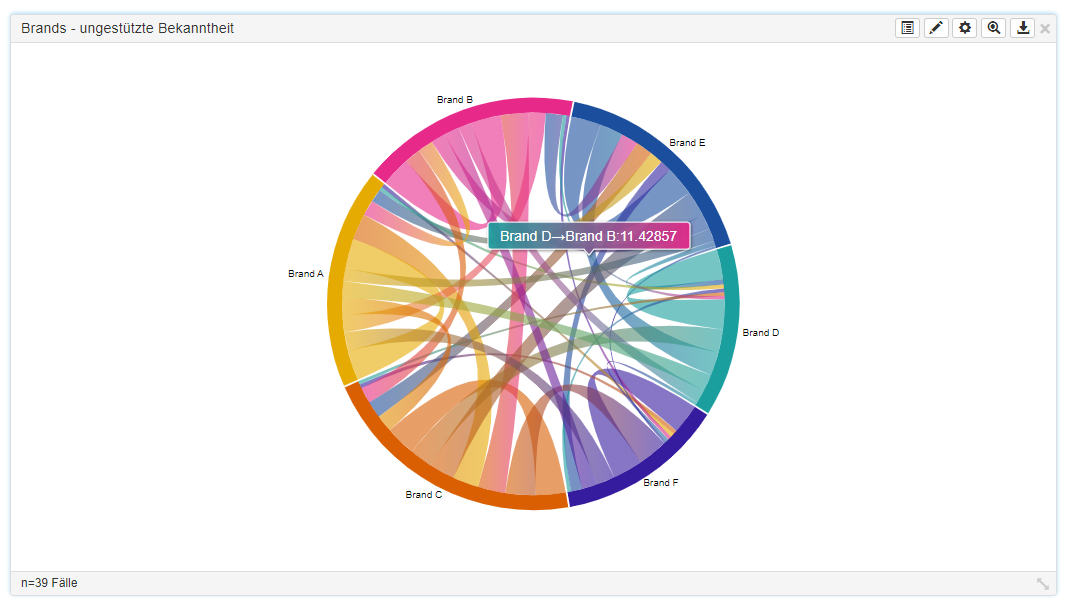
The network chart is an alternative representation of the chord diagram.

Chardchart3.png

Learn how to create a network diagram here.

Dashboards for Market Research – Part 2: Integrating Different Data Sets and Timelines

Dashboard software for market researchers – Part 2

.
Check the Part 1 – Dashboards for Market Research of the series here: Part 1 – Data
.
DataLion is designed as a market research dashboard software for market researchers. This is certainly because of our professional background in the industry. We want to shed light on the topic of “Dashboards for Market Research” from different perspectives in a series of blog posts. After our first article: Dashboards for Market Research – Part 1: Data, in the second part of the series “Dashboards for Market Research” we want to take a look at the challenges that arise from combining different studies within one project – especially concerning timelines.

Timeline KPI dashboard
Background vector created by rawpixel.com – www.freepik.com
Continue reading “Dashboards for Market Research – Part 2: Integrating Different Data Sets and Timelines”

DataLion at Succeet21 – AI in Market Research Dashboards

Meet and succeed with DataLion: “Succeet21” – Stand. 114

On October 27th and 28th, the market research fair Succeet21 will take place in Munich – the trade fair for insights and market research. After there was initially a virtual trade fair in spring 2021, a face-to-face event will now also be held. With the motto: Meet and succeed, DataLion will be happy to present as an exhibitor on both days of the fair.

DataLion AI in market research dashboards

Are you on-site? Come by and visit us! Our booth has booth number 114. Let us arrange a meeting in advance by simply sending us a message with the form below. We are ready to show how you can use DataLion dashboard software to quickly and easily create interactive dashboards that enable efficient data visualization and inspire customers. We look forward to welcoming many new and familiar faces to our stand.
Continue reading “DataLion at Succeet21 – AI in Market Research Dashboards”

DataLion at Dmexco and Digitalx

DataLion is exciting to join the two events of DMEXCO & DIGITALX to join the discussions with other businesses in Europe about business analytics, digital business, marketing, and innovation this September. We are fascinated to share with all Data-fan some great insights which are sharing during the events.

Dmexco – Digital Marketing Exposition & Conference

ARTIFICIAL INTELLIGENCE IN MARKETING AND MARKET RESEARCH

Living in the Age of Artificial Intelligence and Machine Learning.

The technology that surrounds us is becoming more and more intelligent. AI and machine learning appear everywhere include in market research, business analytics, data analytics and marketing. The further development of artificial intelligence has led to the fact that we can speak freely with our smartphones, that cars can drive autonomously or that the advantages of humans in disciplines such as chess or Go no longer apply.

Artificial intelligence algorithms, like those behind Alexa, Siri and Co, continuously collect data, evaluate it, develop predictions and models, which are then continuously tested and optimized. Often these processes are not openly visible, but they are based on neural networks – or what these machine learning methods are called today: deep learning.
Continue reading “ARTIFICIAL INTELLIGENCE IN MARKETING AND MARKET RESEARCH”

Dashboards for Market Research – Part 1: Data

From the beginning, we designed DataLion as a dashboard software for market researchers. One reason for this is certainly our professional background in the industry. But what exactly makes a market research dashboard software? Since we are asked time and again what exactly differentiates DataLion from other software platforms, we want to shed light on the topic of “Dashboards for Market Research” from different perspectives in a series of blogposts and go into more detail about the special features in data, chart types, metrics, and reporting, among other things.

Market research consumer behavior sample in dashboard reports

Continue reading “Dashboards for Market Research – Part 1: Data”

DASHBOARD TOOLS CHECKLIST: HOW TO FIND THE RIGHT DASHBOARD?

Do we all know how important it is to have the right Dashboard Tools?

Dashboard tools are playing an increasingly important role for companies for a reason: Without the right dashboard platform, the growing mountains of data can hardly be analyzed and presented in an understandable way. Business Intelligence (BI) without the appropriate software solution is not possible. However, finding the right software for the company is anything but easy. This article explains what you should consider when looking for a suitable dashboard tool.
Dashboard solution checklist, how to find right dashboard software Continue reading “DASHBOARD TOOLS CHECKLIST: HOW TO FIND THE RIGHT DASHBOARD?”

The 7 most common big data challenges in data analytics

What are the most common big data challenges when it comes to your data analytics? How to use a holistic data strategy to make big data and data analytics child’s play and maximize your return on data?

7 big data challenges, data consulting services for data analytics
Data is the gold of digital transformation. A holistic data strategy is necessary to unearth this treasure. Learn how to identify and avoid the 7 most common pitfalls of big data challenges in data management. Big data and data analytics are child’s play and you can maximize your return on data. Continue reading “The 7 most common big data challenges in data analytics”

WHY DASHBOARDS ARE A GOOD FIT FOR DATA SYSTEMS?

Why Dashboards is a good fit for Data Systems ?
Image by Rawpixel via Pixabay

Dashboards for data systems

Why exactly do dashboards and data systems go so well together? That is the topic of the article by Benedikt Droste, Senior Data Analyst at MSR Consulting Group, and Holger Geißler, CMO of DataLion, which was published on Marktforschung.de as part of the topic dossier “Plattformen und Datensysteme 2019”. First, the authors explain how data systems are created in the first place. The way to create a data system is described in five steps: Continue reading “WHY DASHBOARDS ARE A GOOD FIT FOR DATA SYSTEMS?”