In our updated data analysis tools/ dashboard platform:
Calculated columns and PowerPoints with several charts on one slide are now available in the new version of data analysis tools.
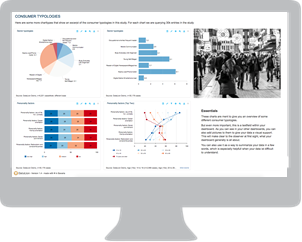
Powerful and user-friendly statistics software – a contradiction? Not at all! Now, the web-based DataLion analysis software allows you to evaluate even large amounts of data quickly and easily and display the results in a very concise and comprehensible dashboard.
Your employees don’t have to apply annoying formulas or try to unify formats. Instead, they simply create interactive reports that are automatically updated. This way, you will gain valuable insights that will help your business! All data will be visualized in an understandable and high-quality design. We’re bringing back the fun to data analysis!
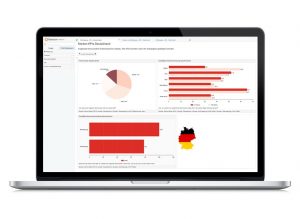
Dashboard Software for Visualize
Dashboards are an important part of your business. The volume of data that is produced in companies every day is growing. And so is the need for data access, preparation and visualization as well.
Also, The information hidden in the data can be essential for decision-makers. They need an overview of the most important KPIs from sales, marketing, and HR. Quick and visually attractive – even on the road!
Data analysis tools new features
You will find the following new features in the latest DataLion version:
-
-
- Export as PowerPoint with several charts on one page (in some cases it may be necessary to call and save the export configuration in the administration backend)
- Tables can now also contain calculated columns and rows in this updated data analysis tools (e.g. growth rates or rolling totals)
- Nested tables can also contain calculated columns.
- Number charts can now be formatted as percentages with different decimal places
- Names of rows and columns can be customized
- You can specify the lifetime in the cache setting
- Administrators can send notifications to users by mail
- Access profiles can also be based on dynamic questions
- When you copy a report, copies of the chart settings and shows/hides are also created
- Table links can be set up in the backend by dropdown
- The API backend can now also calculate mean values
- Time series charts can now contain several characteristics and filters
Test the DataLion- data analysis tools Free Demo Now:
-