Experience more lion power in the new Dashboard Platform version

There’s exciting news from DataLion Dashboard Platform: we released version 1.9 which includes numerous new features we’ve developed in close cooperation with clients & users. We have incorporated your feedback and suggestions gathered in the past months. Among new features like visualizations and export functions, we have also implemented several optimizations (e.g. loading time) and bug fixes.
In short, DataLion Dashboard Software now is faster, more flexible and more productive than ever. We hope you will love it!
Let’s have a closer look at some highlights:
Yes, Dashboard Platform with more chart types!
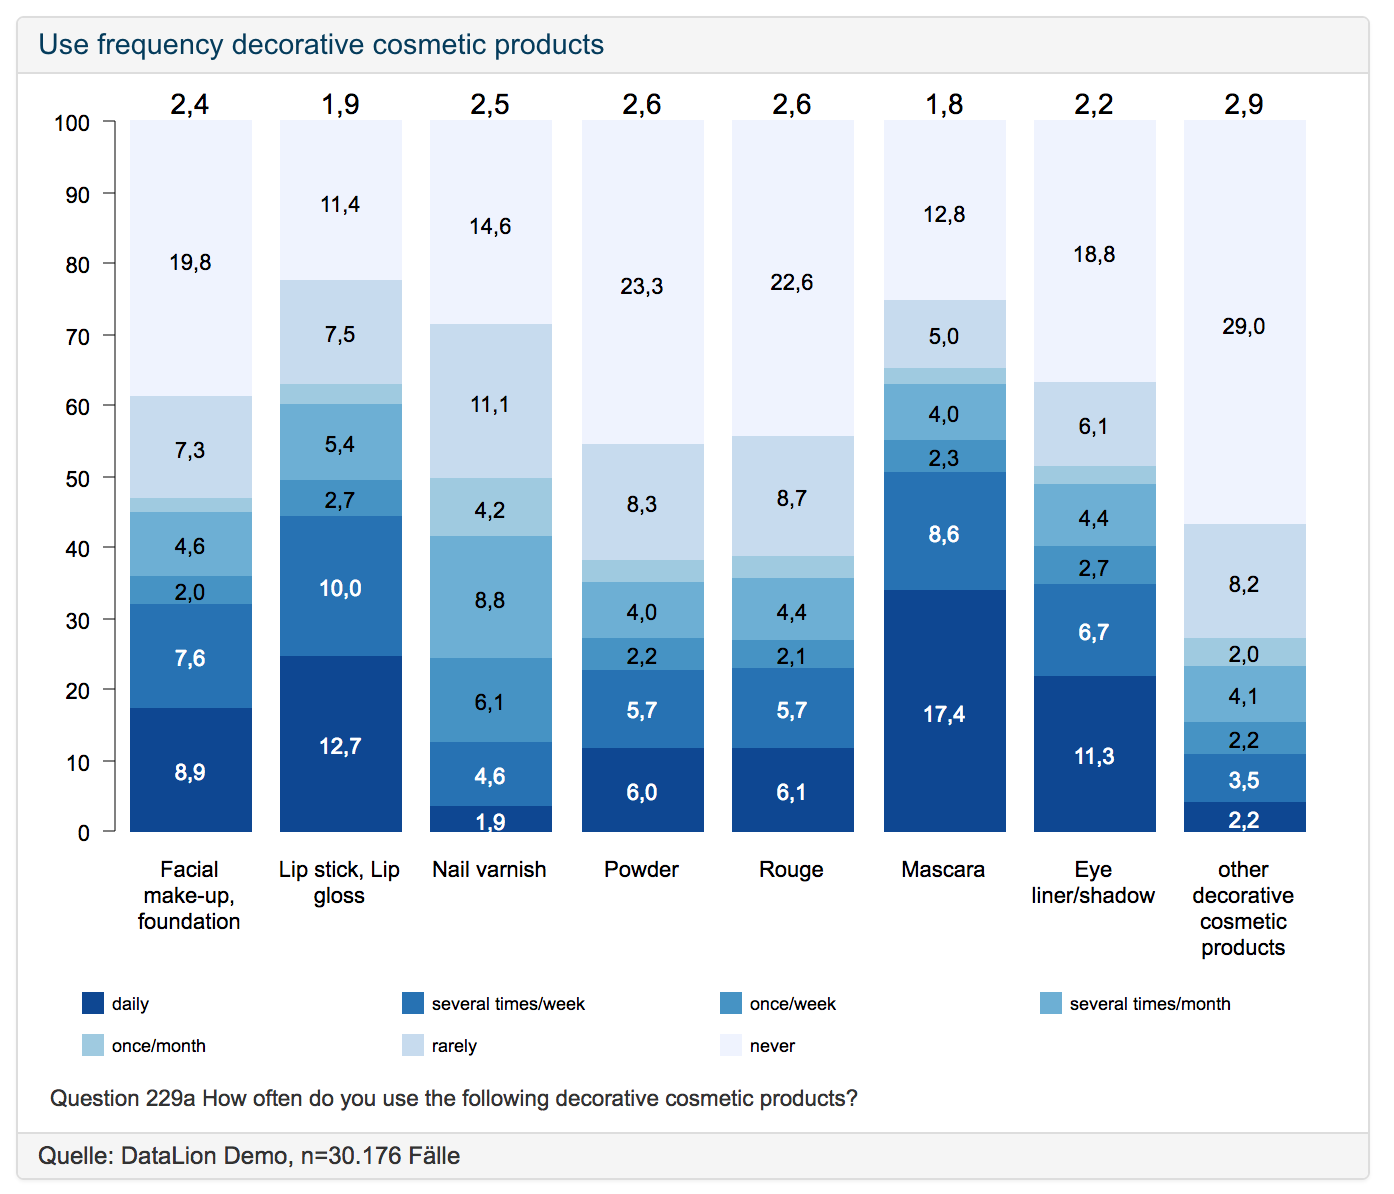
A stacked column chart with the option to display the mean or the sample size (Example):
Extended donut chart e. g. for the comparison of Key Performance Indicators (Example):
New exports, New interfaces! Let’s check out in the Dashboard Platform
Export of a dashboard or a report with more than one dashboard and charts as PowerPoint or Excel document
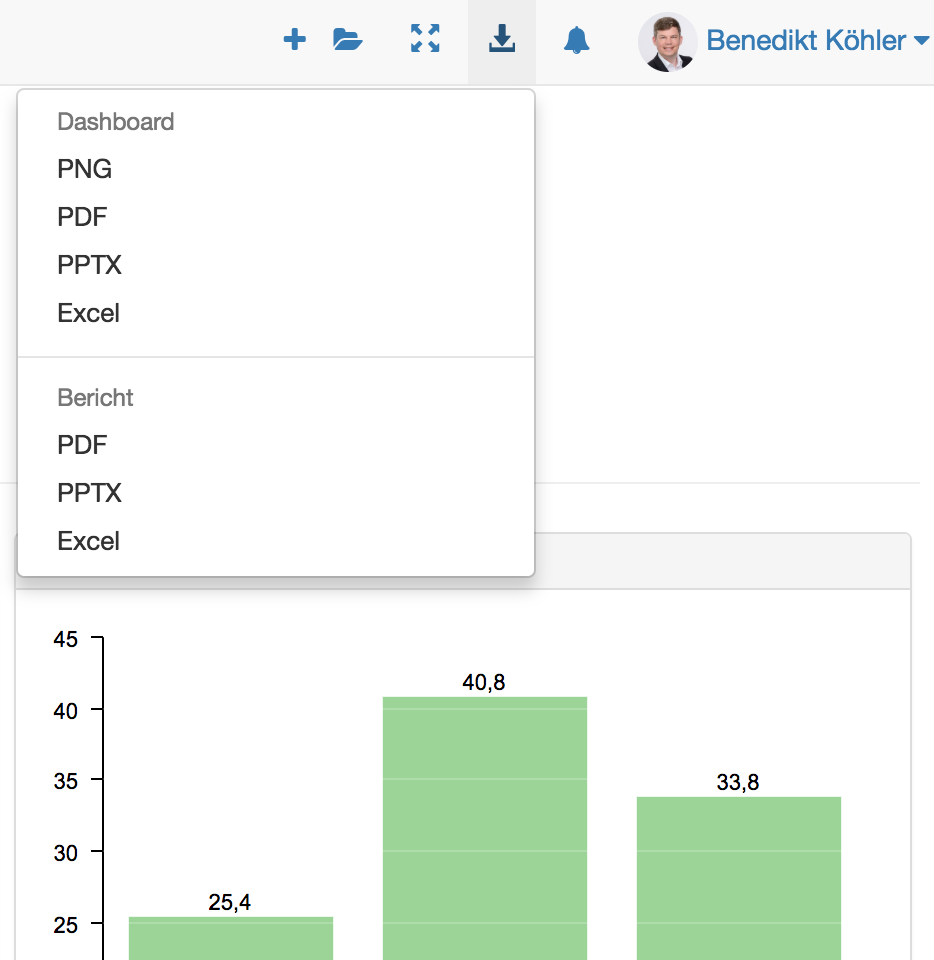
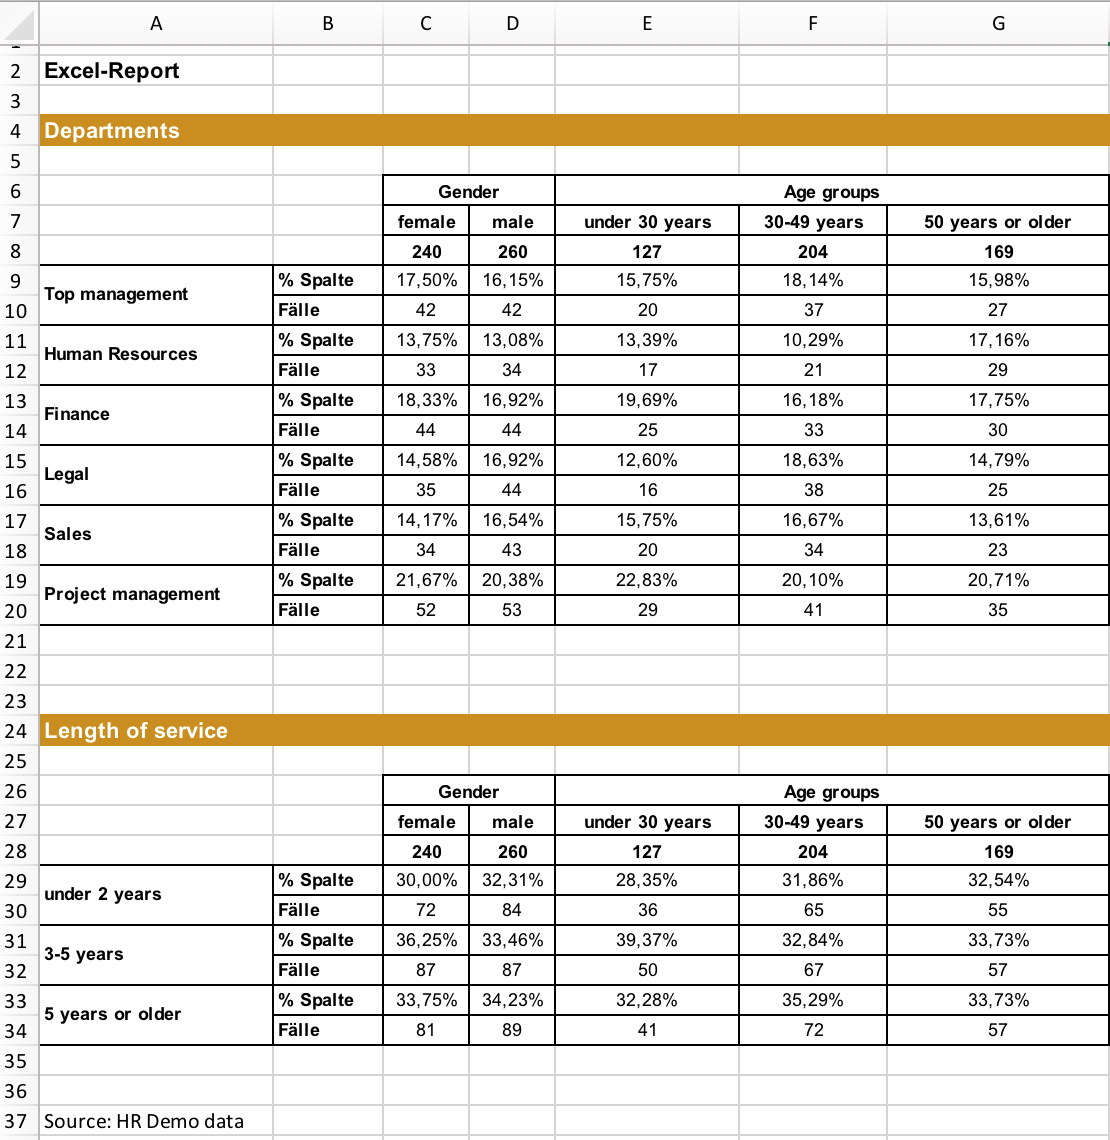
Export of an excel report with multiple tabs in an individually defined format:
Overview of our new features in the data analysis tools
Data Visualization
- New chart type: stacked column chart with means and case numbers
- New chart type: extended donut chart with means e.g. to compare KPI Values
- Sort charts by the mean value
- Reverse order of stacked column chart segments
- Top5, Top10, etc. for time series charts
- Hide empty values and categories in time series charts
- Separate filter dropdowns for each tab of a report
- Export of word clouds as image
Reports and Dashboards
- Placeholder element in report/dashboard title
- Read-only mode for read-only access profiles
- The selected global filter remains across tabs
- Automatic selection of comparison operators depending on the selected report filter
- Individual dropdown-menus per dashboard
Settings
- Adjustable precision of average values
- Back-end definition of missing values
- Set alignment and spacing in chart settings
Export features
- Back-end configuration of pptx-exports and masters
- Export of an entire report with multiple dashboards and charts as PPTX
- Export of an entire report with multiple dashboards and charts as Excel
- Export of an excel report in a pre-defined format
Metadata and import
- Add of text fields via codebook
- Automated incremental data update (e.g. backfill of last month, week)
- Export of the codebook including special fields and text elements
- Back-end function to delete and replace entire codebook
Various bug fixes and optimizations (load time, exports, imports)
Test DataLion Free Demo:
Get started now and try our new version 1.9! We are looking forward to your feedback!
Rooaaarrr DataLion