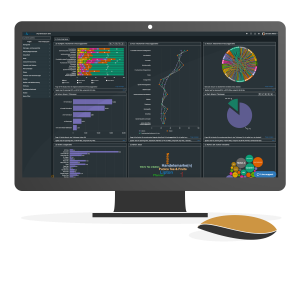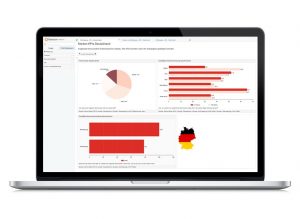
The new Version 2022.2 is here! DataLion wishes you a relaxing summer and makes it easier for DataLion admins to work with the software: Filter and delete data online, an overview page for project reports, as well as ownership and exports with notification. There are also new features for data visualization such as the network chart for showing connections, a revised chord diagram and new functions for the calendar drop-down menu. At the same time, we further reduced the number of page reloads and improved the usability of the project setup for a more pleasant user experience.
A comprehensive overview of all improvements and new features can be found here.
Edit data tables online in DataLion
Data tables can now easily be filtered online in DataLion and the filter selection can be deleted. An example: The data of a new wave was imported into the project, but the data has to be changed again. Simply filter on this wave in your table, delete the entries and then import the current data. This means that not all of the project data has to be removed and re-imported. The filter function can also be used to find out the number of cases for an entered condition, e.g. WHERE var_item IN (1,2) returns the cases where the variable var_item = 1 or = 2. Filtered data can also be exported. Learn more here mehr.

As an admin, keep track of projects with the new report overview!
The report overviewhelps you to know which reports exist in a project and who has rights to them. The report overview is a list of all reports in the project with the report owner and a link to the corresponding report settings (“Edit”). There is also the option in the report overview to organize reports into active and inactive. Inactive reports are listed as archived in the frontend, but can be retrieved via the report overview if required.
Also new is that report ownership can be changed. The change can be made in the report settings.

Export large amounts of data with notification
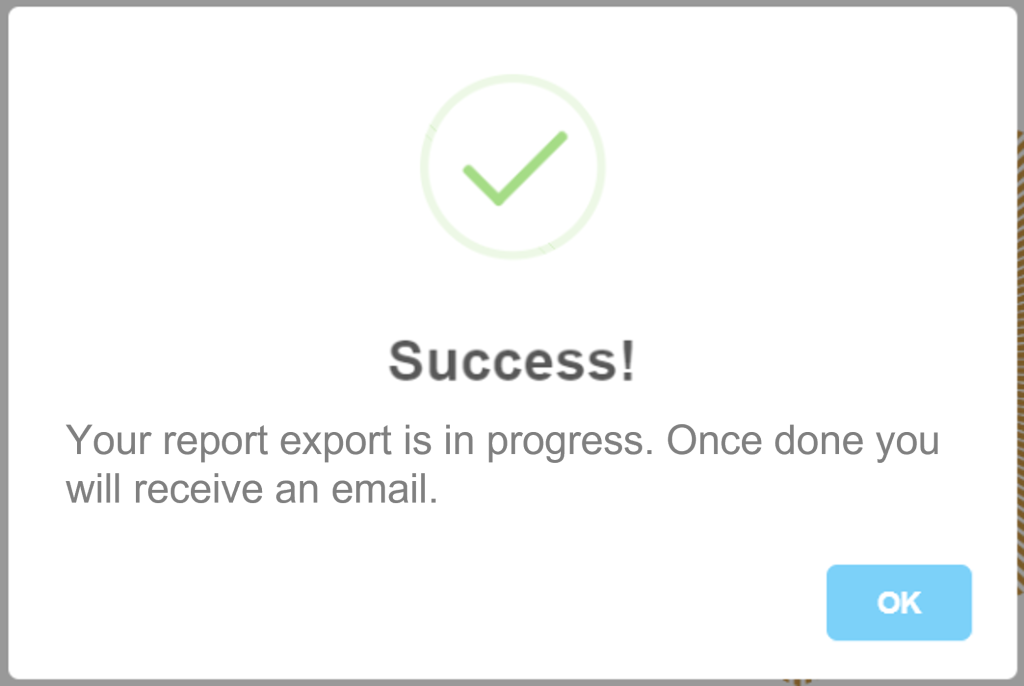
Exports of data tables or exports of reports/dashboards in formats such as xlsx, PDF or pptx can now also be carried out as a queue job with notification. This is particularly useful for large amounts of data to be exported, e.g. reports with a large number of tabs and charts. The user can simply continue working while the export is being generated in the background and will conveniently receive a notification to the stored e-mail address after completion.
Find out here in the Project Settings – Reports and Dashboards section how the report export with notification is activated and here in the Export Project section how the table export with notification for access profiles is activated.
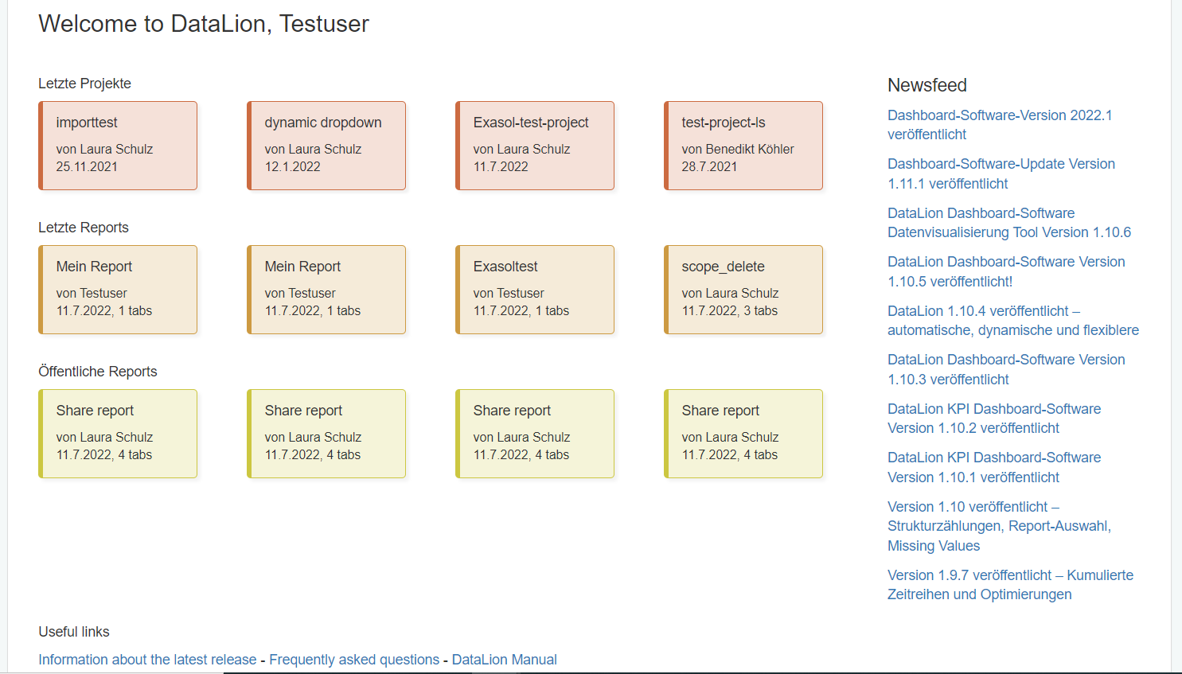
DataLion start page with your personal recent work and the latest DataLion information
The start page gives you an overview of your recent work and navigates you directly to your dashboard by clicking on an item. You will also find helpful links to the DataLion documentation, the latest announcements and release logs on the start page.
The start page is displayed after login if no default project is applied, to which you are automatically forwarded after login.
Set up large dashboard projects quickly and clearly: define metrics via the codebook
In DataLion, representations can be output in many different metrics, e.g. percent, absolute values, sums, maximum, minimum, etc. You can first define a default metric at project level and then change this metric in the frontend for each chart if desired, e.g. from absolute values to percent. This second step can now also be carried out in a time-saving manner via the codebook and thus significantly reduce the number of clicks in the front end, especially in large projects with many charts and dashboards. Learn more about how to define the metric per chart via the codebook here.

Select project chart types
The chart types that are available in the project can be selected in the Project backend > General > Chart settings. The chart IDs no longer have to be entered.

The datepicker has evolved: default time periods
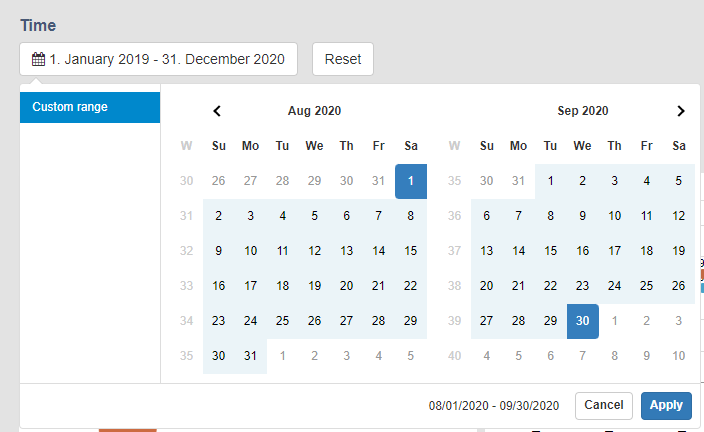
Additional periods are now available for the date picker (calendar), which can be defined as default time periods. With a default time period, the dashboard is always displayed to the user as a standard, filtered to this preset time period. Find outherein the Datepicker section (time series menu) how to define a default period for the datepicker.
Visualizing interconnectivity: The network chart
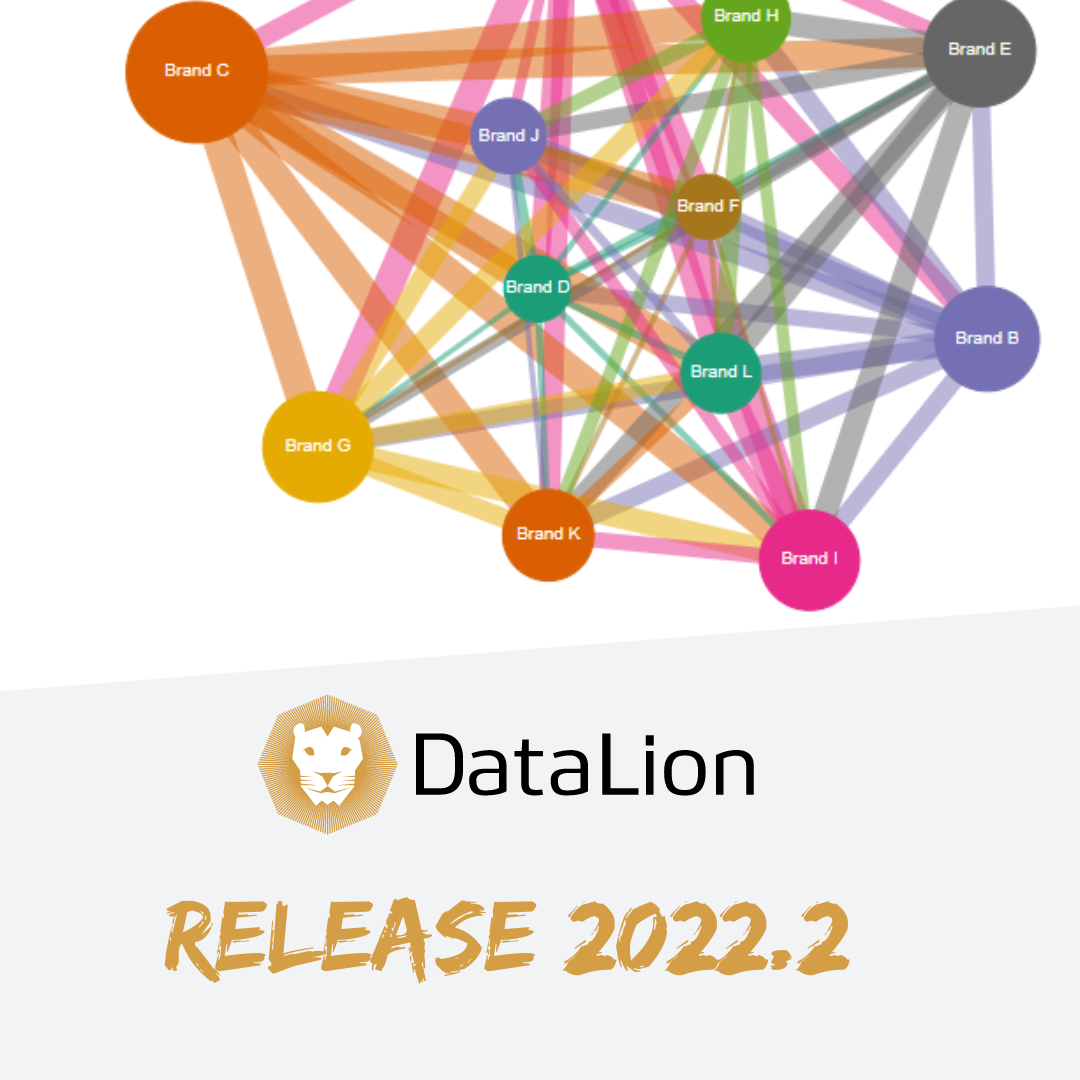
The network chart shows how things are connected to each other. Variables are shown as nodes that are linked to each other via lines. The size of the node indicates the absolute value of the node. The lines show with which nodes there is a connection and how strong this connection is. For example, it is easy to visualize which brands were named together with other brands in an open mention and how often they were named together with the other brand (line width).
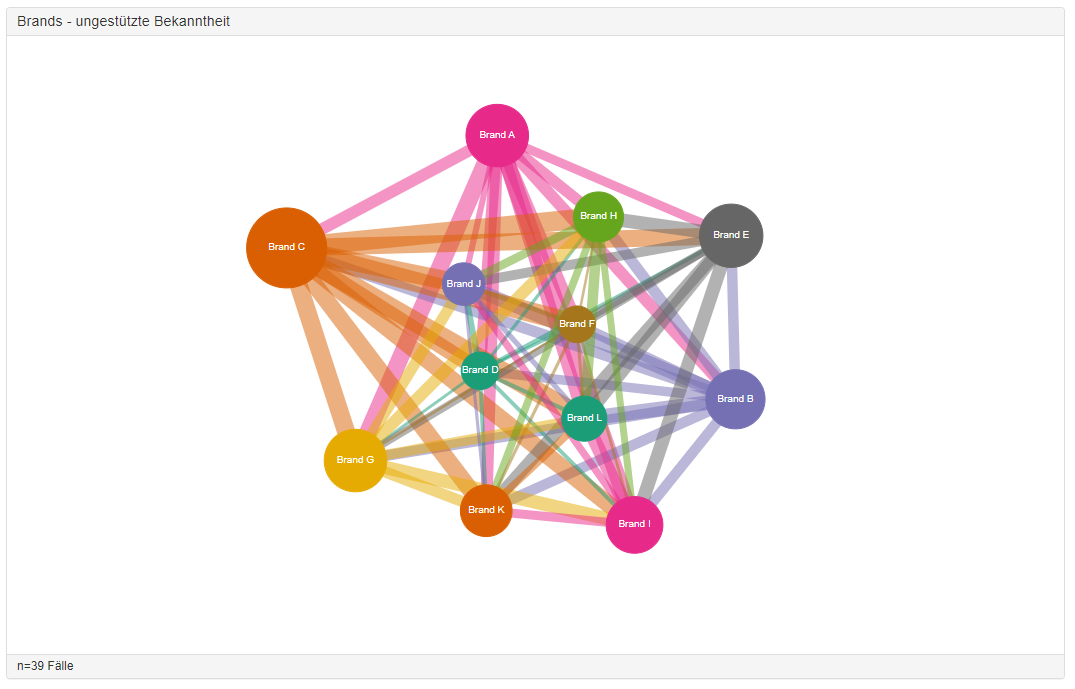
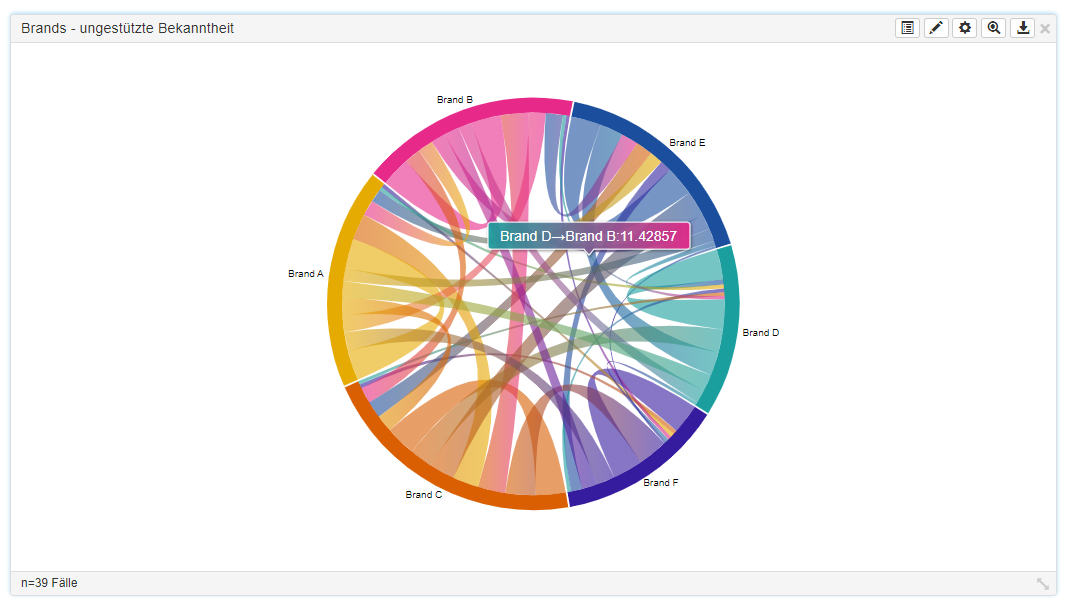
The network chart is an alternative representation of the chord diagram.
Learn how to create a network diagram here.

