DataLion at the Digital Challenge 2018

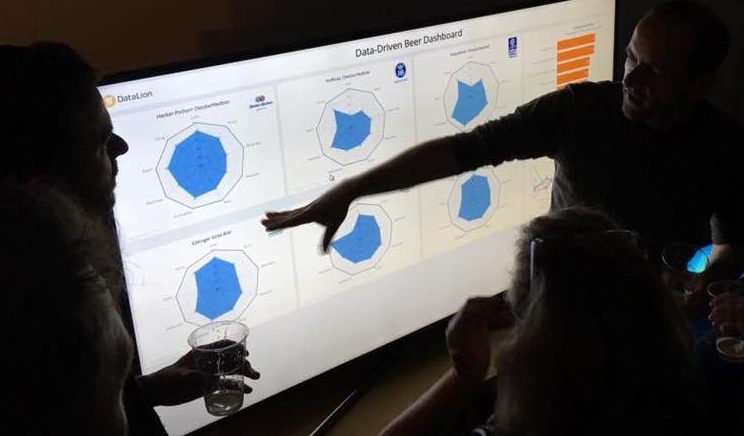
In mid-June, numerous specialists and interested parties from agencies, institutes and companies got together in Munich in order to discuss the latest developments in digitization.

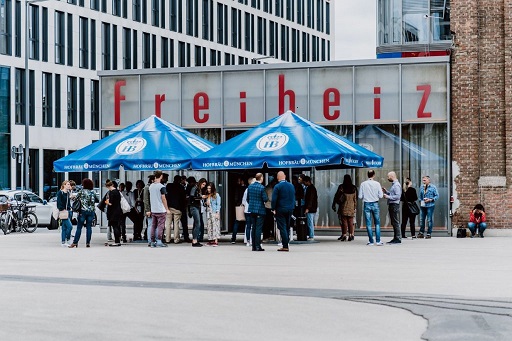
We were very much excited to be there as well: our CEO and founder Dr. Benedikt Köhler introduced the new world of data science. In a live example, he demonstrated how one can use Foursquare to avoid being marked as a tourist when visiting an unknown new city. Continue reading “DataLion at the Digital Challenge 2018”

The 5 Most Creative Music Visualizations

“Data is power”: by now an established fact. “Music is power”: a universal truth. So what do we get, when we creatively combine the plethora of available data on music with analyzing techniques and powerful software? We gain knowledge, insight and tremendous inspiration. We have gathered some really interesting and inspiring creative visualizations, apply machine learning both interactive and non-interactive visualizations on the evolution of music as well as on current distinctive trends. Enjoy!

Creative Music Visualizations

Using data from the Billboard Top 100 Data 1958 – 2016, The Pudding´s Matt Daniels has visualized the evolution of musical taste on a month-to-month basis over the years: every top 5 songs from 1958 to 2016 in the U.S. Headphones required – it´s a “soundalized” visualization!
Creative Visualizations on music, she loves you, Beatles Continue reading “The 5 Most Creative Music Visualizations”

Craft Beer & Data Tasting

Data Tasting at Research & Results 2017

After the great success of our first “Festbier Tasting” side-event of the Bits & Pretzels startup conference, we are looking forward to hosting another data-driven beer and data tasting to celebrate our first trade-fair appearance at the world’s largest marketing research fair Research & Results.

data tasting - market research fair research & result (succeet)

Continue reading “Craft Beer & Data Tasting”

BI dashboard tools DataLion version 1.6 is live now

BI dashboard updated: Time Series, data import, drag & drop for customized dashboards

New Month – new update! Our software engineering lions worked until last night on the BI dashboard software‘s latest new features and hunted for the last remaining bugs. Their hunt was so successful that we can finally launch the new DataLion version 1.6.

Here are some of the most important new features and improvements in our newest BI dashboard: Continue reading “BI dashboard tools DataLion version 1.6 is live now”

DataLion nominated for I-COM 2017 data startup competition

Data Startup challenge: I-COM global summit

data startup I-com data science hackathon 2017

The international marketing and data community will meet in Porto at the I-COM global summit “Data 2017 – the year of change” from April 24 to 27. We’re very proud that we’ve been nominated by the very high-quality jury as one of the 10 finalists for the official selection of the Data Startup Competition. Continue reading “DataLion nominated for I-COM 2017 data startup competition”