What are the most common big data challenges when it comes to your data analytics? How to use a holistic data strategy to make big data and data analytics child’s play and maximize your return on data?
Data is the new oil. But while the use of oil was relatively clearly defined, there are much more possibilities in data. It’s an endless story. Almost all companies are facing the challenge of having tons of data from very heterogeneous sources. But often, they lack a clear vision of what the data could be used for. What are new business models that can be fueled with the data? Which data products can be defined and sold by the company? The solution is big data Design Thinking. Continue reading “Big Data Design Thinking”
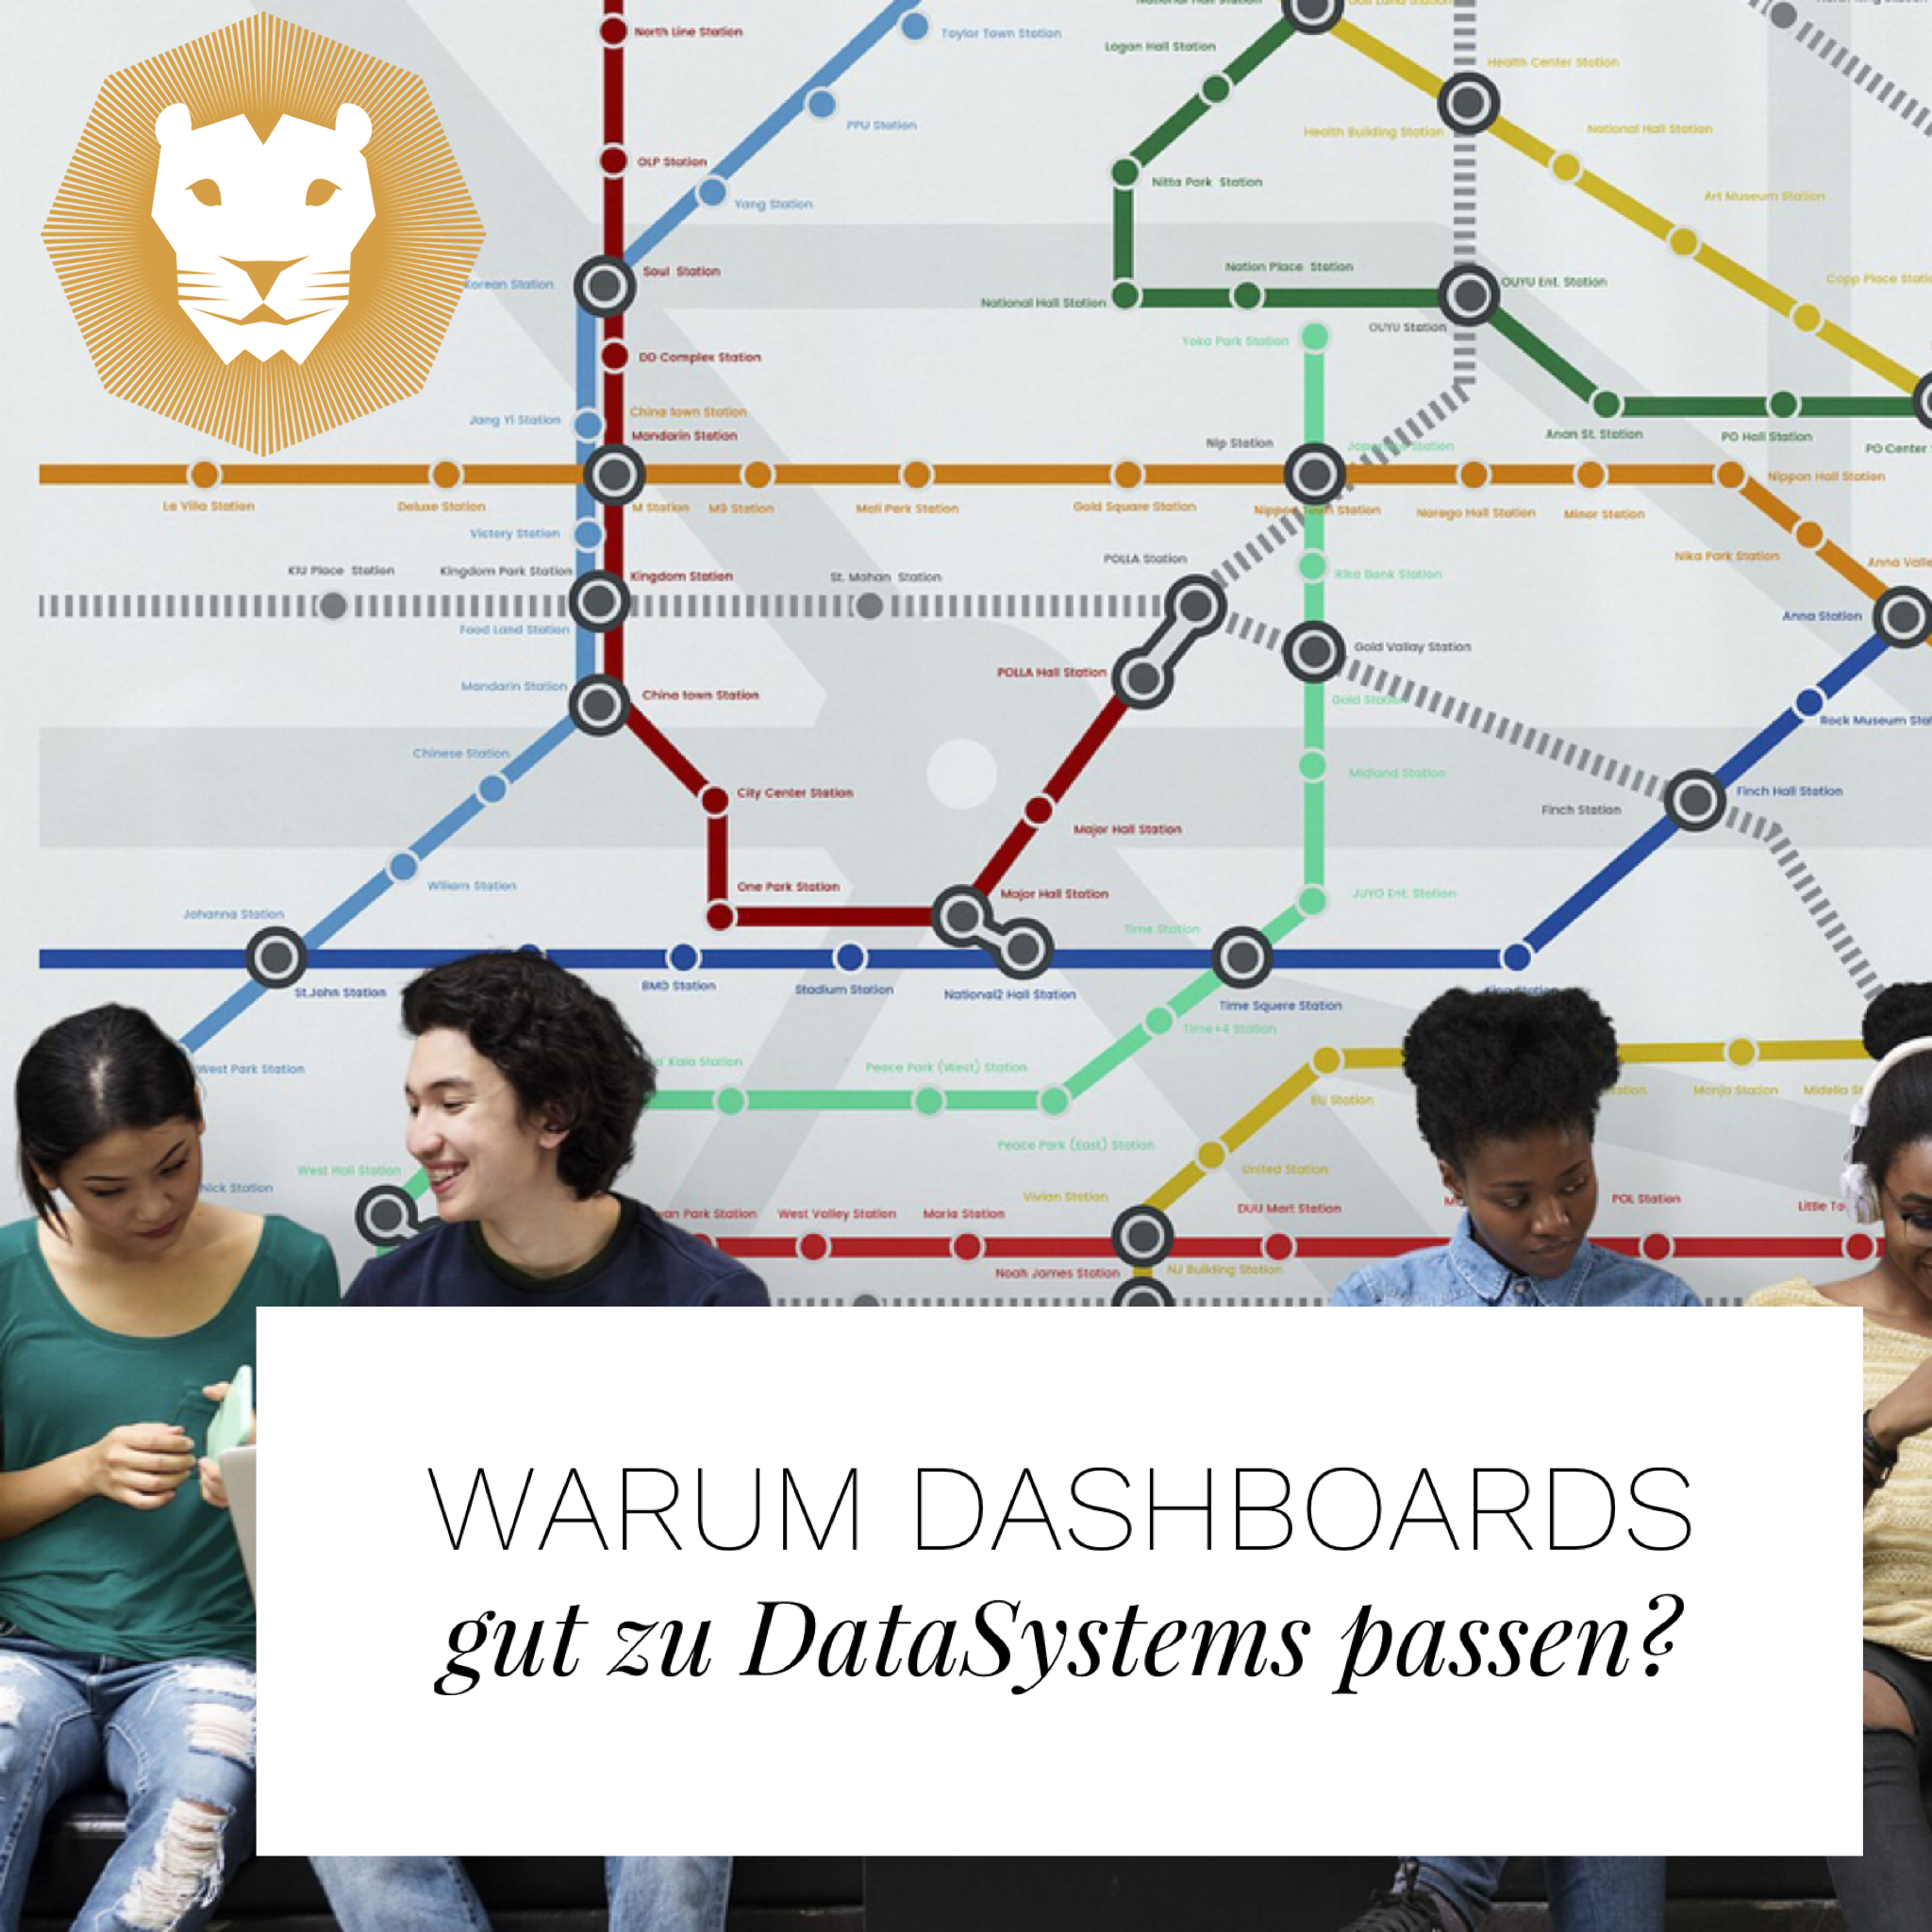
Why exactly do dashboards and data systems go so well together? That is the topic of the article by Benedikt Droste, Senior Data Analyst at MSR Consulting Group, and Holger Geißler, CMO of DataLion, which was published on Marktforschung.de as part of the topic dossier “Plattformen und Datensysteme 2019”. First, the authors explain how data systems are created in the first place. The way to create a data system is described in five steps: Continue reading “WHY DASHBOARDS ARE A GOOD FIT FOR DATA SYSTEMS?”
In Data visualization, dashboards are a great way to make sense of complex data. How effective a dashboard is, however, ultimately depends on the specific composition. In modern dashboard systems like Datalion, the compilation of charts is easy, but how to choose the right chart types? Check our Data visualization tips to make your dashboards perfectly. Continue reading “Data visualization tips: these chart types are worth a thousand words”
The best things in life aren’t things – but free books. At least if you want to spend the next few weeks taking your machine learning to another level. We’ve selected four great books that help you to understand one important aspect of machine learning in a very profound way. Thanks to the Open Access initiative, all of these works are available for free: Continue reading “Machine learning: Best 4 free math books for deepening your skills”

In the age of big data, business intelligence and artificial intelligence, data plays an increasingly important role for companies. Dashboard solution is now widely used, bringing data to the point and thus becoming an important basis for decision-making. If you are visualizing your data, these dashboard tips might be helpful for you.
But the optimal visualization of data still is a challenge. With the following six tips in the dashboard solution, you will be able to build a great dashboard and save time. Continue reading “Dashboard solution: Six tips to build a perfect dashboard”
Key performance indicators or KPIs are not just a big issue in most companies since the growing importance of business intelligence software. However, it is very controversial which KPIs actually lead to success. Which are superfluous? Which indicators are more misleading than helpful? Even dashboard solutions are an indispensable part of KPI reports, as they are the only ones that develop their full potential here. Imagine you are still late in the office finishing your presentation for the next morning’s board meeting. That’s where it helps if you can easily pull up the real-time KPI dashboard in the BI system.
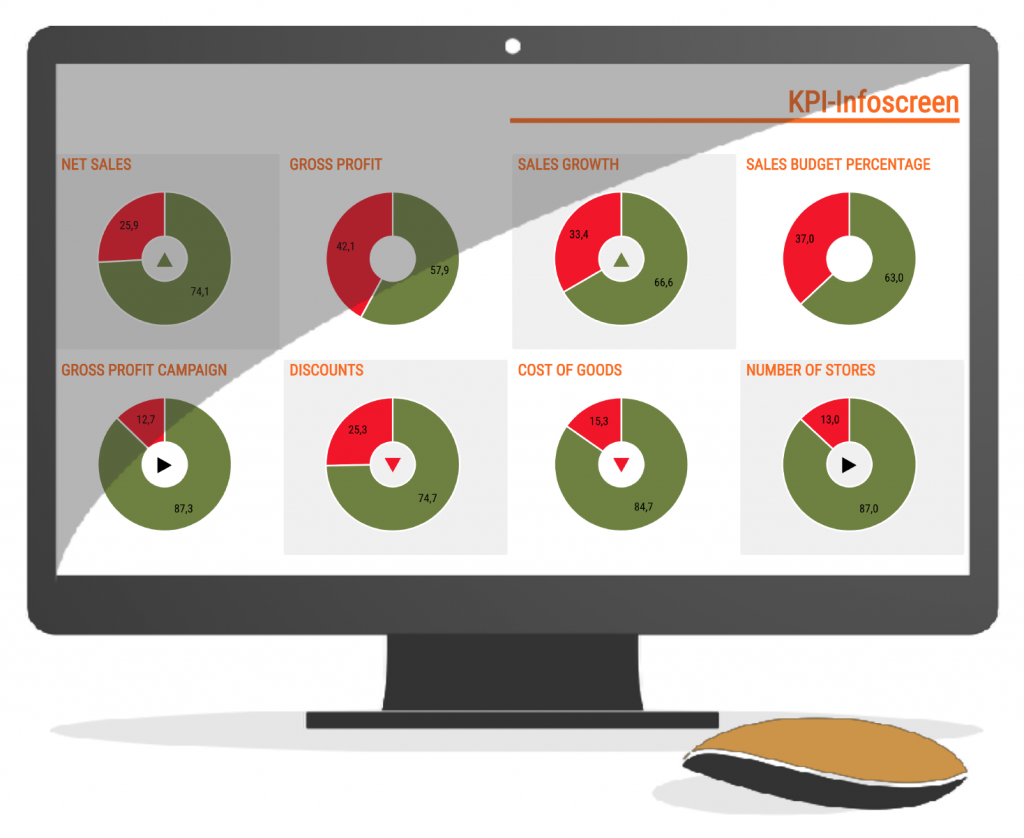
Continue reading “KPI Reports: Unfolding the full power of KPIs in dashboards”
These days we are celebrating the 50th anniversary of the Apollo 11 moon landing and focusing on a possible new lunar conquest by 2023. But let’s dream a bit and look at the most beautiful space visualizations of the universe the Internet can offer today! For all skywatchers out there, here’s a list of the sites to visualize data related to galaxies, space visualization and the world around us.
Apollo 11 (July 16–24, 1969) was the spaceflight that first landed humans on the Moon. Commander Neil Armstrong and lunar module pilot Buzz Aldrin formed the American crew that landed the Apollo Lunar Module Eagle on July 20, 1969, at 20:17 UTC. Let’s experience Apollo 11’s way to the moon.

Continue reading “Space visualization: The 5 most beautiful data visualizations”
We are on the IIEX Europe from 18.-19. February as an exhibitor in Amsterdam. The IIEX – Insight Innovation EXchange – is the premier fair for innovation in market research. Of course, we should not miss that, since the possibilities that DataLion offers at the press of a button for creating tables and reports for your big data management in market research – paired with KI algorithms – are certainly among the most exciting innovations in the industry right now.

Continue reading “Innovation in market research & Big data management”
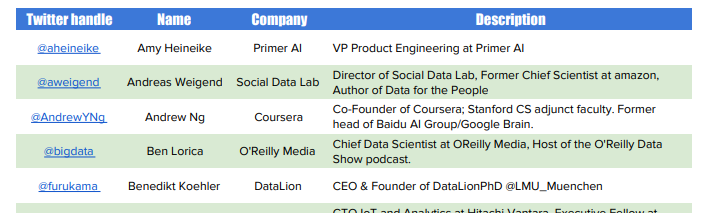
We are beyond thrilled that our CEO and founder Dr. Benedikt Köhler is on the list of the Top 50 Data Science Influencers. The list was published by Cognilytica in mid-August 2018. Let’s follow Benedikt on Twitter: @furukama.