Space visualization: The 5 most beautiful data visualizations

These days we are celebrating the 50th anniversary of the Apollo 11 moon landing and focusing on a possible new lunar conquest by 2023. But let’s dream a bit and look at the most beautiful space visualizations of the universe the Internet can offer today!
For all skywatchers out there, here’s a list of the sites to visualize data related to galaxies, space visualization and the world around us.

Apollo 11 traject Space visualization

Apollo 11 (July 16–24, 1969) was the spaceflight that first landed humans on the Moon. Commander Neil Armstrong and lunar module pilot Buzz Aldrin formed the American crew that landed the Apollo Lunar Module Eagle on July 20, 1969, at 20:17 UTC. Let’s experience Apollo 11’s way to the moon.

Apollo 11 way to the moon, space visualization, data software

Continue reading “Space visualization: The 5 most beautiful data visualizations”

DataLion auf der Research & Results 2019

Research & Results 2019

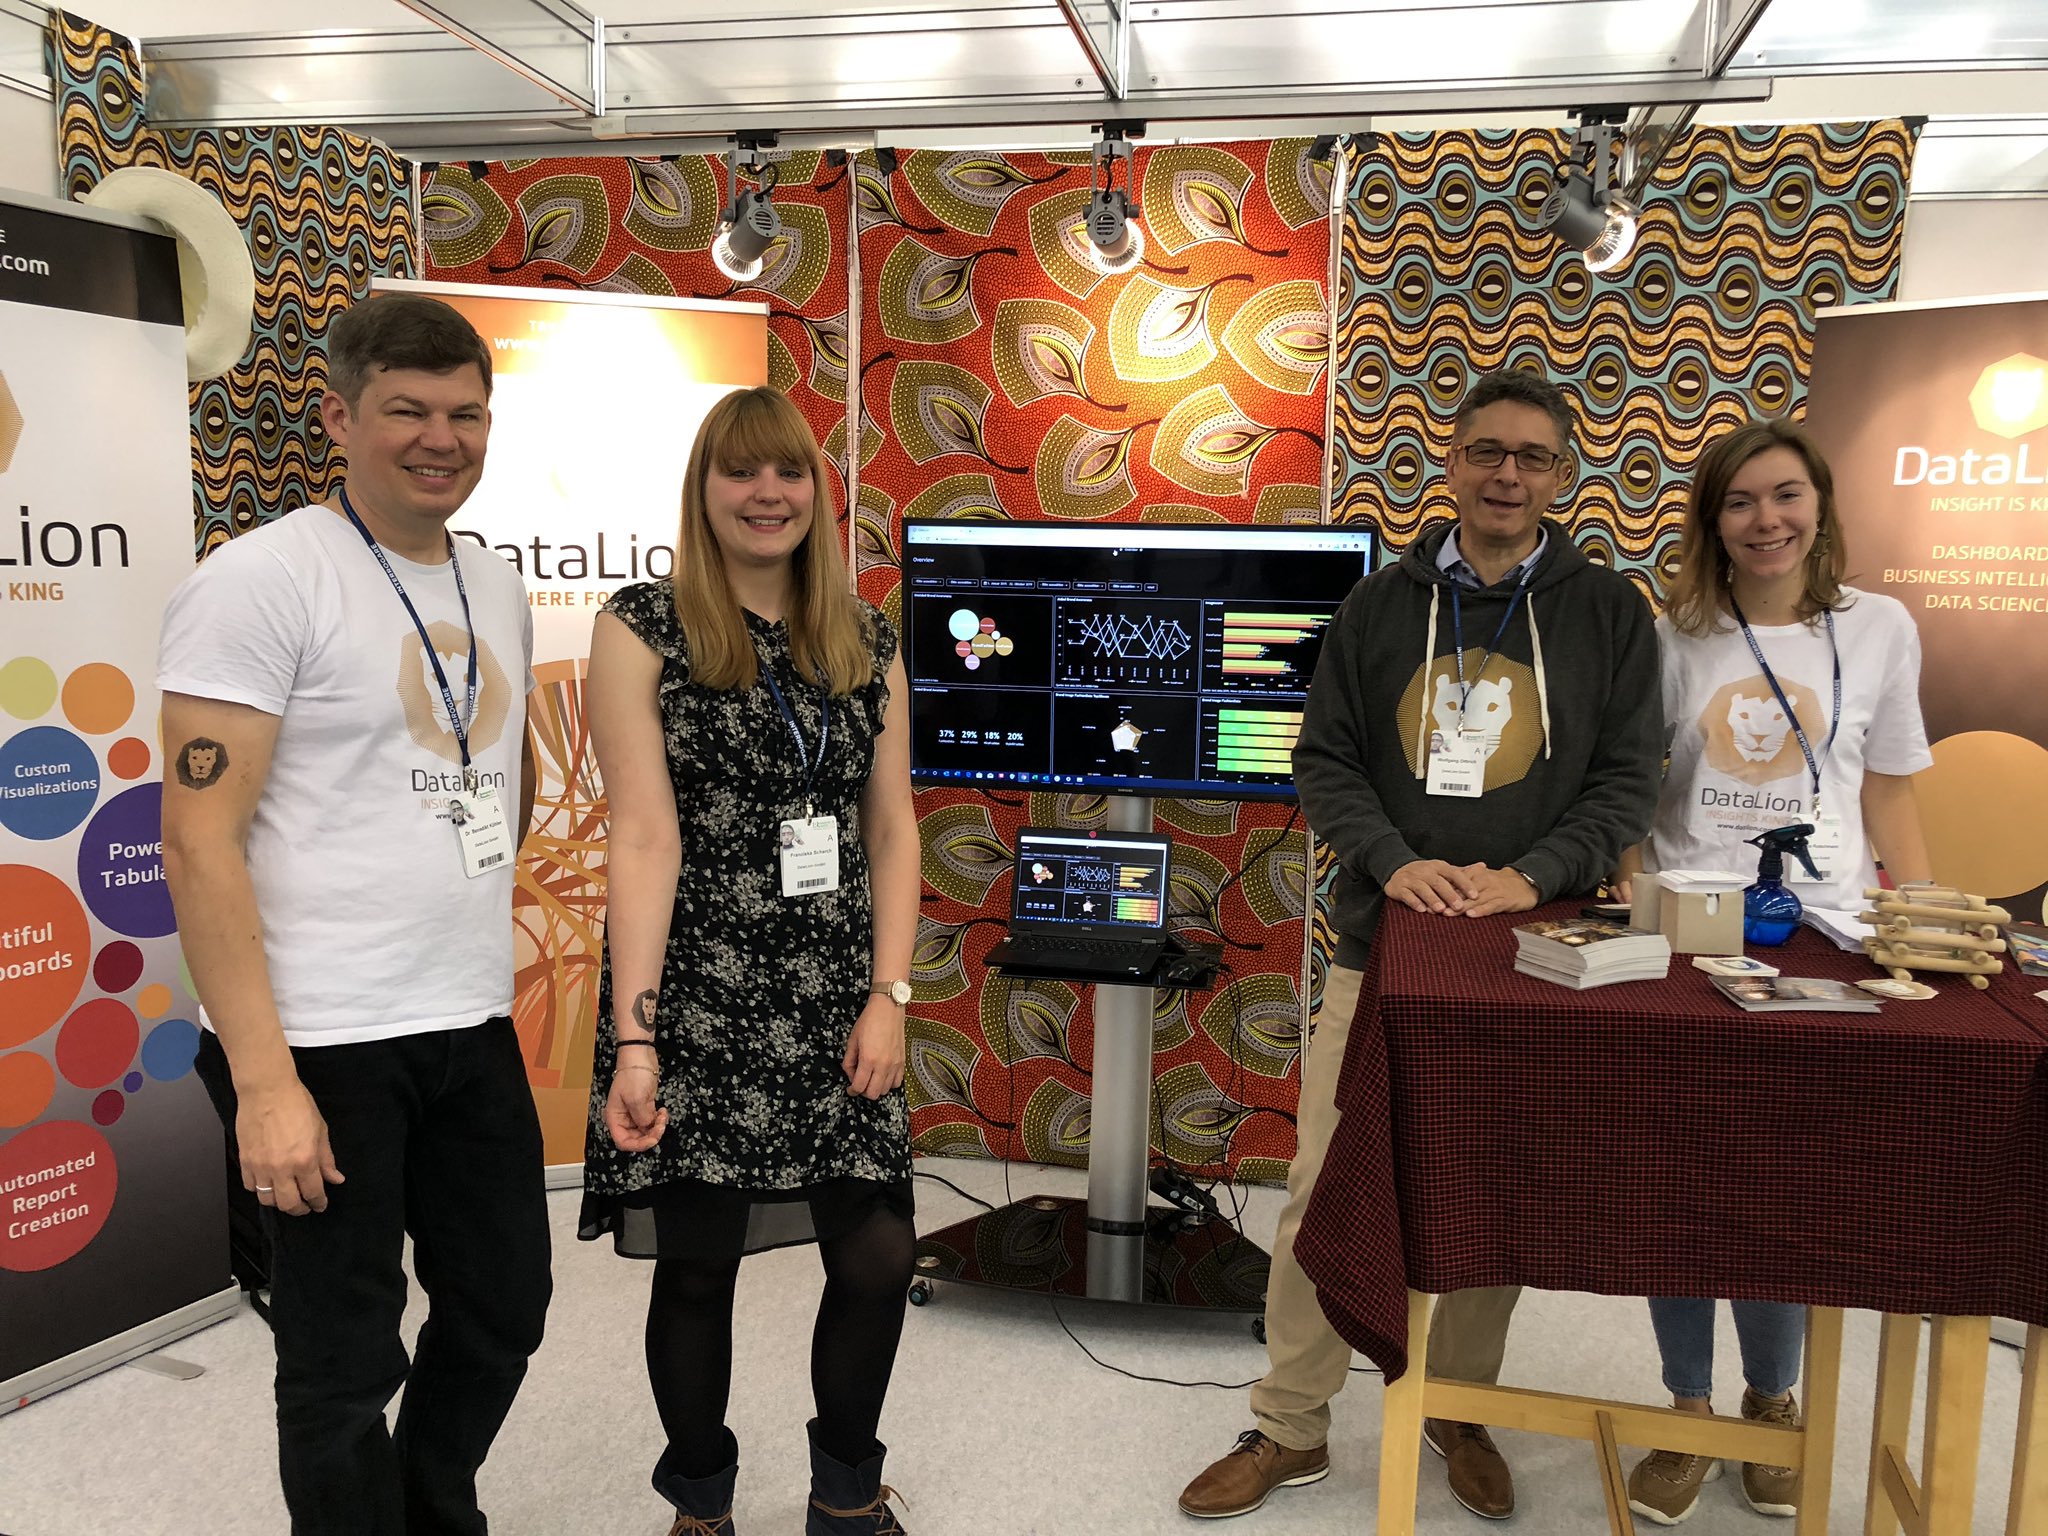
Die diesjährige Research & Results stand vom 23. – 24. Oktober wieder ganz im Zeichen von Research, Data & Insights. Hier zeigten die die branchenführenden Aussteller ihre Produkte und Innovationen. Auch unser DataLion Team war wieder dabei. Beide Tagen waren gefüllt mit interessanten Gesprächen an unserem liebevoll im Safari-Look gestalteten Stand.

Research & result 2019 - DataLion dashboard software, data consultancy

Zudem gab es an einem zweiten Messetag einen spannenden Vortrag vom DataLion CEO Dr. Benedikt Köhler zusammen mit seiner Kollegin Franziska Scharch. Continue reading “DataLion auf der Research & Results 2019”

Dashboard software released: DataLion dashboard solution Ver 1.10.6

Improvements and new features in Dashboard software released:

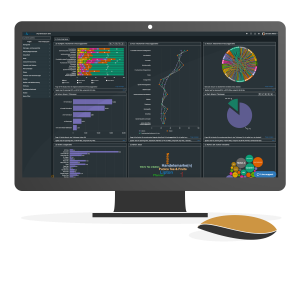
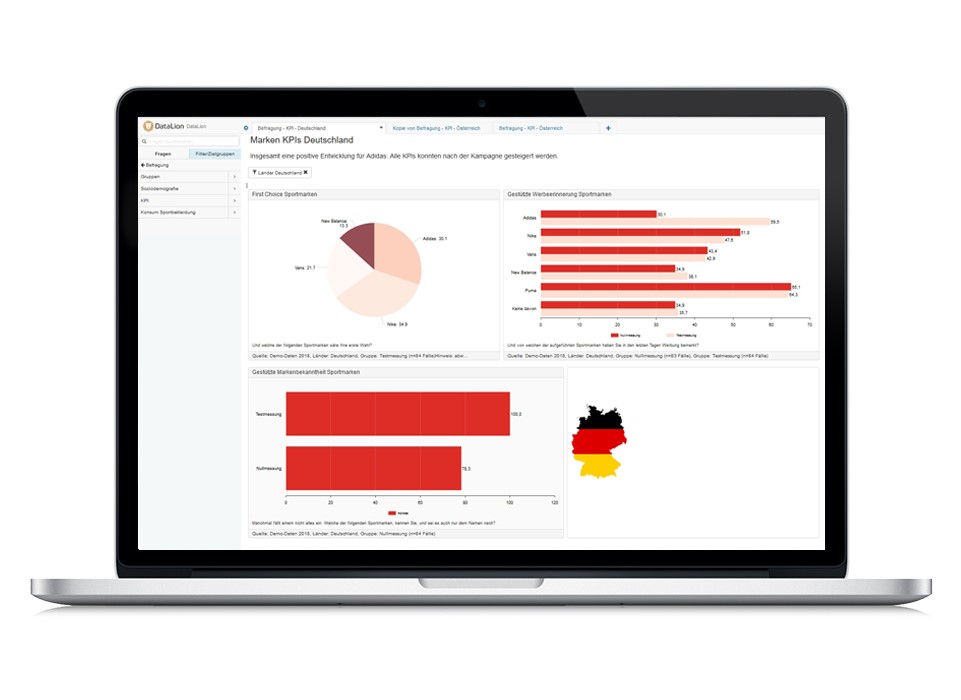
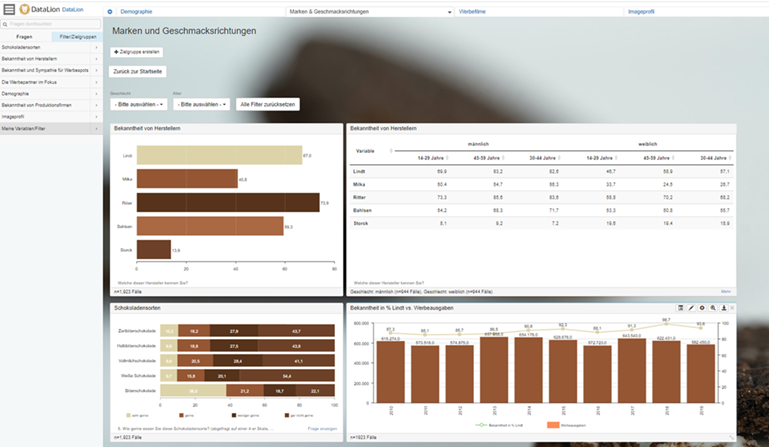
DataLion team is proud to introduce our newly dashboard software released: Dashboard solution Ver 1.10.6. You will find the following new features to improve your KPI report’s quality, the dashboard in real-time, data visualization, insight analysis, dashboard design in the latest DataLion Dashboard software version:

Dashboard software released new features:

DataLion Dashboard software Version 1.10.5 released – update data analysis tools

In our updated data analysis tools/ dashboard platform:

Calculated columns and PowerPoints with several charts on one slide are now available in the new version of data analysis tools.

data analysis tools, dashboard software free demo

Powerful and user-friendly statistics software – a contradiction? Not at all! Now, the web-based DataLion analysis software allows you to evaluate even large amounts of data quickly and easily and display the results in a very concise and comprehensible dashboard. Continue reading “DataLion Dashboard software Version 1.10.5 released – update data analysis tools”

DataLion Dashboard-Software Version 1.10.5 veröffentlicht!

Berechnete Spalten und PowerPoints mit mehreren Charts auf einem Slide

Dashboards sind fester Bestandteil des Unter­nehmens­alltags. Angesichts einer Vielzahl von Daten, die Unternehmen täglich neu produzieren, steigen die Anforderungen an Verfügbarkeit, Aufbereitung und Visualisierung dieser Daten.
.
Gefragt sind die darin verborgenen Informationen. Diese sollen Entscheidern schnell und in ansprechender Form dargestellt einen Überblick über die wichtigsten KPIs aus Vertrieb, Marketing oder HR geben – auch unterwegs!
.
Folgende Neuerungen finden Sie in der neuesten DataLion Dashboard-Software -Version 1.10.5:DataLion Dashboard-Software, data analysis tools, KPI dashboard update

Export als PowerPoint von DataLion Dashboard-Software:

    • Export als PowerPoint mit mehreren Charts auf einer Seite (in einzelnen Fällen kann es notwendig sein, die Export-Konfiguration im Administrationsbackend aufzurufen und abzuspeichern)
    • Tabellen können jetzt auch berechnete Spalten und Zeilen enthalten (z.B. Wachstumsraten oder rollierende Summen)
    • Auch verschachtelte Tabellen können berechnete Spalten enthalten
    • Nummer-Charts können jetzt als Prozent mit unterschiedlichen Nachkommastellen formatiert werden

Dashboard-Software Einstellung

    • Namen von Zeilen und Spalten können angepasst werden
    • In der Cache-Einstellung kann man die Lebensdauer angeben
    • Administratoren können Benachrichtigungen an Benutzer per Mail schicken
    • Zugangsprofile können auch auf dynamischen Fragen basieren
    • Beim Kopieren eines Reports werden auch Kopien der Chart-Einstellungen und Ein-/Ausblendungen erzeugt
    • Verknüpfungen von Tabellen lassen sich im Backend per Dropdown einrichten
    • Das API-Backend kann jetzt auch Mittelwerte berechnen
    • Zeitreihencharts können jetzt mehrere Ausprägungen und Filter beinhalten

Test DataLion Dashboard-Software Free Demo:

Jetzt testen →

DataLion 1.10.4 veröffentlicht – automatische, dynamische und flexiblere

Automatische Verknüpfung von Tabellen, dynamische Surveyfragen und flexiblere Berechnungen

In der neuen DataLion flexiblere Dashboard-software -Version 1.10.4 finden Sie die folgenden Neuerungen:DataLion 1.10.4 automatische, dynamische und flexiblere dashboard

Datenvisualisierung

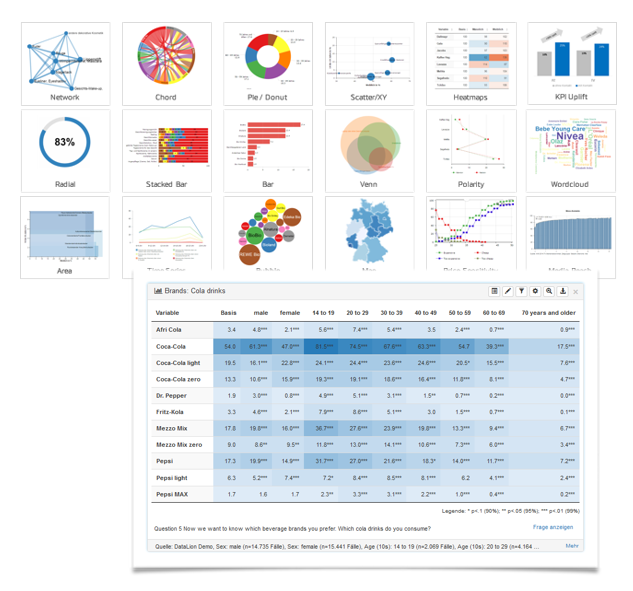
    • Neuer Charttyp: Gestapelter Balken mit Veränderungsraten
    • In Projekten mit mehreren Tabellen können diese jetzt über gemeinsame Schlüssel verknüpft werden, so dass damit auch Auswertungen über mehrere Tabellen hinweg möglich werden
    • Die angezeigten Werte (Zahlen, Balken etc.) können aus einer beliebigen Variable / Spalte berechnet werden (z.B. Umsatz).
    • Scatterplots funktionieren jetzt auch mit berechneten Variablen (Summen oder Mittelwerte)
    • Tabellen können jetzt auch mit verschachtelten Spalten dargestellt werden
    • Tabellen lassen sich jetzt auch für die Darstellung von Mittelwerten, Summen, Maximum etc. verwenden
    • Im Charttyp Image öffnen sich die Bilder auf Klick jetzt in einem Overlay-Fenster
    • Zeitreihencharts können jetzt auch gewichtete Daten verarbeiten

Continue reading “DataLion 1.10.4 veröffentlicht – automatische, dynamische und flexiblere”

Dashboard Platform updated – DataLion 1.9 released

Experience more lion power in the new Dashboard Platform version

dashboard tools update, new dashboard software release, datalion 1.9

There’s exciting news from DataLion Dashboard Platform: we released version 1.9 which includes numerous new features we’ve developed in close cooperation with clients & users. We have incorporated your feedback and suggestions gathered in the past months. Among new features like visualizations and export functions, we have also implemented several optimizations (e.g. loading time) and bug fixes.

In short, DataLion Dashboard Software now is faster, more flexible and more productive than ever. We hope you will love it!

Let’s have a closer look at some highlights: Continue reading “Dashboard Platform updated – DataLion 1.9 released”

The 5 Most Creative Music Visualizations

“Data is power”: by now an established fact. “Music is power”: a universal truth. So what do we get, when we creatively combine the plethora of available data on music with analyzing techniques and powerful software? We gain knowledge, insight and tremendous inspiration. We have gathered some really interesting and inspiring creative visualizations, apply machine learning both interactive and non-interactive visualizations on the evolution of music as well as on current distinctive trends. Enjoy!

Creative Music Visualizations

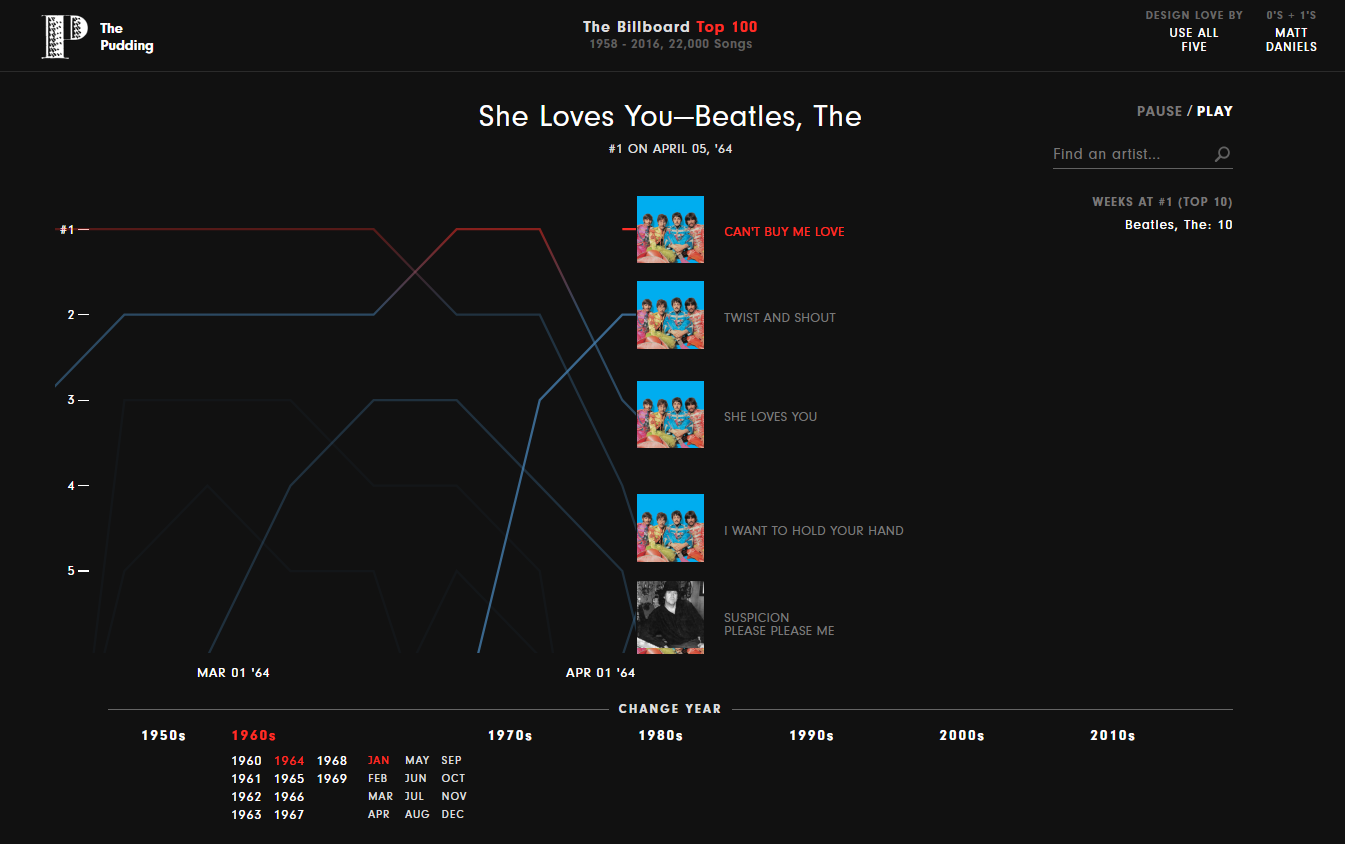
Using data from the Billboard Top 100 Data 1958 – 2016, The Pudding´s Matt Daniels has visualized the evolution of musical taste on a month-to-month basis over the years: every top 5 songs from 1958 to 2016 in the U.S. Headphones required – it´s a “soundalized” visualization!
Creative Visualizations on music, she loves you, Beatles Continue reading “The 5 Most Creative Music Visualizations”

DataLion nominated for I-COM 2017 data startup competition

Data Startup challenge: I-COM global summit

data startup I-com data science hackathon 2017

The international marketing and data community will meet in Porto at the I-COM global summit “Data 2017 – the year of change” from April 24 to 27. We’re very proud that we’ve been nominated by the very high-quality jury as one of the 10 finalists for the official selection of the Data Startup Competition. Continue reading “DataLion nominated for I-COM 2017 data startup competition”