The Mighty Funnel Chart 🎩✨

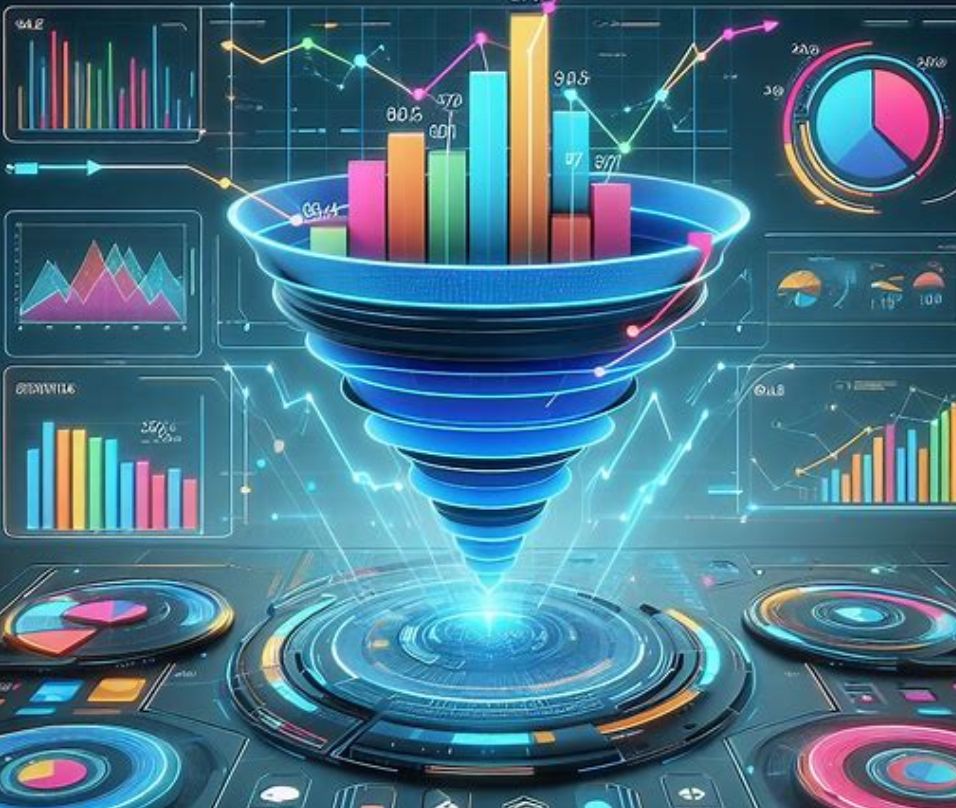
Ever wondered how to effectively track your customer’s journey, sales pipeline, or conversion rates? Enter the mighty Funnel Chart! 🎩✨

When to Use Funnel Charts:
* Conversion Analysis: Perfect for visualizing stages in a sales process or customer journey, highlighting where you’re losing prospects.
* Bottleneck Identification: Spot and address bottlenecks in processes, be it in sales, recruitment, or production workflows.
* Path to Purchase: Track how customers move through a purchase decision, identifying key drop-off points.

How to Use Them Effectively:
🧘‍♂️ Simplicity is Key: Keep it simple. Too many stages can make the chart hard to read.
🎨 Color Coding: Use distinct colors for different stages for instant comprehension.
🔢 Contextual Data: Pair with relevant data points (like percentages or numbers) at each stage for depth and clarity.

Funnel charts aren’t just visually engaging; they are a powerhouse in conveying complex processes in an intuitive manner. 🌟

Incorporate these in your dashboards and watch your data storytelling reach new heights! 🎢📈

#FunnelCharts #DataVisualization #BusinessIntelligence #Dashboards #DataDriven #MarketingAnalytics

The Future of Market Research – 10 Reasons why Data Visualization is Crucial!

In a world where data is ubiquitous, the clear presentation and visualization of data in market research are playing an increasingly significant role. As a leading SaaS startup in data visualization for Insights Professionals, we would like to present you with 10 compelling reasons why, in our view, data visualization is the future of market research.

1. Instant Understanding:
Data visualization allows you to transform complex and unwieldy datasets into clear and compelling graphics. At a glance, you can discern patterns, trends, outliers, and relationships. This visual approach provides an immediate grasp of information, making complex data more intuitive to understand.

2. Effective Communication:
Visualized data is more easily comprehensible and is excellent for conveying insights to teams, customers, and other stakeholders. Instead of slogging through lengthy reports, visualizations can present complex information in a more digestible form. This fosters clear communication and facilitates collaboration within organizations (and can even be enjoyable).

3. Rapid Decision-Making:
In today’s fast-paced business environment, making timely decisions is of paramount importance. With data visualization, you can make informed decisions more swiftly by analyzing data in real-time through automated imports or APIs. This enables companies to respond to shifting market conditions and customer needs before it’s too late.

4. Understanding Customer Behavior:
The ability to comprehend customer behavior is invaluable for businesses. Data visualization allows you to correlate and represent demographic data, interests, and behaviors in meaningful graphics. This supports audience segmentation and the ongoing customization of marketing strategies to cater to customer needs.

5. Elevating Customer Satisfaction:
Visualizing and benchmarking customer surveys enables you to identify weaknesses and take targeted measures for improvement. By analyzing feedback, companies can continuously enhance their products and services, ultimately increasing customer satisfaction.

6. Competitive Advantage:
In a fiercely competitive market landscape, distinguishing oneself from the competition is crucial. Data visualization empowers companies to gain valuable insights by visualizing market trends and competitor data. This helps in crafting effective competitive strategies and establishing a successful market presence.

7. Product Development:
Linking customer feedback and sales data in visualizations assists companies in identifying product improvements and new ideas. This information is pivotal for product development, allowing companies to offer products that align with their customers’ needs.

8. Effortless Reporting:
Effective reporting is an integral component of market research. With software like DataLion, you can seamlessly integrate visualizations into reports through drag-and-drop and export them as PowerPoint presentations or Excel spreadsheets with a simple click. This streamlines the communication of research findings and saves valuable time.

9. Professional Data Visualization:
The quality of visualization plays a pivotal role in data interpretation. “Smart” tools offer professional techniques for effective data visualization, including conveying clear messages, simplicity, and thoughtful color selection. These principles are essential to ensure that the created visualizations are both understandable and persuasive.

10. Prepared for the Future:
The world of data visualization is continually evolving, with even more innovations on the horizon. With the ongoing development of artificial intelligence (AI) and machine learning, data visualization tools will become even more powerful and accessible. DataLion is proud to be at the forefront of this field, assisting customers in harnessing the advantages of these advancements.

Prepare for the future of market research! Data visualization with DataLion is the key to better decision-making and the development of successful marketing strategies. Discover how DataLion can transform your business.

Whether you want to uncover complex data patterns or communicate clear insights, DataLion is your trusted partner for data-driven successes. Contact us today to learn more about how we can elevate your business to the next level in market research.

#DataVisualization #MarketResearch #DataLion #SaaS #DecisionMaking #CustomerBehavior #ProductDevelopment #CompetitiveAnalysis #BusinessIntelligence #Future #ArtificialIntelligence #MachineLearning

DataLion at Succeet21 – AI in Market Research Dashboards

Meet and succeed with DataLion: “Succeet21” – Stand. 114

On October 27th and 28th, the market research fair Succeet21 will take place in Munich – the trade fair for insights and market research. After there was initially a virtual trade fair in spring 2021, a face-to-face event will now also be held. With the motto: Meet and succeed, DataLion will be happy to present as an exhibitor on both days of the fair.

DataLion AI in market research dashboards

Are you on-site? Come by and visit us! Our booth has booth number 114. Let us arrange a meeting in advance by simply sending us a message with the form below. We are ready to show how you can use DataLion dashboard software to quickly and easily create interactive dashboards that enable efficient data visualization and inspire customers. We look forward to welcoming many new and familiar faces to our stand.
Continue reading “DataLion at Succeet21 – AI in Market Research Dashboards”

DataLion at Dmexco and Digitalx

DataLion is exciting to join the two events of DMEXCO & DIGITALX to join the discussions with other businesses in Europe about business analytics, digital business, marketing, and innovation this September. We are fascinated to share with all Data-fan some great insights which are sharing during the events.

Dmexco – Digital Marketing Exposition & Conference

ARTIFICIAL INTELLIGENCE IN MARKETING AND MARKET RESEARCH

Living in the Age of Artificial Intelligence and Machine Learning.

The technology that surrounds us is becoming more and more intelligent. AI and machine learning appear everywhere include in market research, business analytics, data analytics and marketing. The further development of artificial intelligence has led to the fact that we can speak freely with our smartphones, that cars can drive autonomously or that the advantages of humans in disciplines such as chess or Go no longer apply.

Artificial intelligence algorithms, like those behind Alexa, Siri and Co, continuously collect data, evaluate it, develop predictions and models, which are then continuously tested and optimized. Often these processes are not openly visible, but they are based on neural networks – or what these machine learning methods are called today: deep learning.
Continue reading “ARTIFICIAL INTELLIGENCE IN MARKETING AND MARKET RESEARCH”

Dashboards for Market Research – Part 1: Data

From the beginning, we designed DataLion as a dashboard software for market researchers. One reason for this is certainly our professional background in the industry. But what exactly makes a market research dashboard software? Since we are asked time and again what exactly differentiates DataLion from other software platforms, we want to shed light on the topic of “Dashboards for Market Research” from different perspectives in a series of blogposts and go into more detail about the special features in data, chart types, metrics, and reporting, among other things.

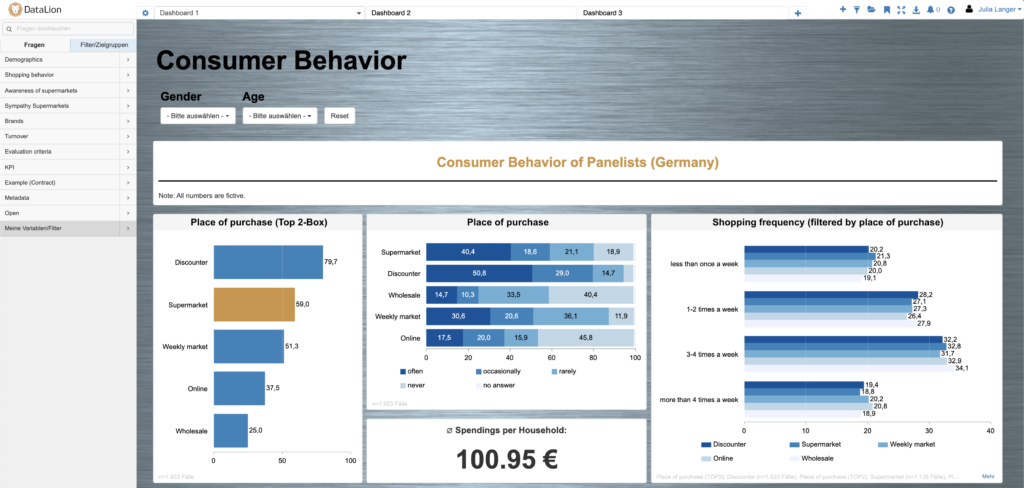
Market research consumer behavior sample in dashboard reports

Continue reading “Dashboards for Market Research – Part 1: Data”

DASHBOARD TOOLS CHECKLIST: HOW TO FIND THE RIGHT DASHBOARD?

Do we all know how important it is to have the right Dashboard Tools?

Dashboard tools are playing an increasingly important role for companies for a reason: Without the right dashboard platform, the growing mountains of data can hardly be analyzed and presented in an understandable way. Business Intelligence (BI) without the appropriate software solution is not possible. However, finding the right software for the company is anything but easy. This article explains what you should consider when looking for a suitable dashboard tool.
Dashboard solution checklist, how to find right dashboard software Continue reading “DASHBOARD TOOLS CHECKLIST: HOW TO FIND THE RIGHT DASHBOARD?”

The 7 most common big data challenges in data analytics

What are the most common big data challenges when it comes to your data analytics? How to use a holistic data strategy to make big data and data analytics child’s play and maximize your return on data?

7 big data challenges, data consulting services for data analytics
Data is the gold of digital transformation. A holistic data strategy is necessary to unearth this treasure. Learn how to identify and avoid the 7 most common pitfalls of big data challenges in data management. Big data and data analytics are child’s play and you can maximize your return on data. Continue reading “The 7 most common big data challenges in data analytics”

Big Data Design Thinking

Solving problems and developing innovations for Big Data

design thinking for big data, data visualization tools, dashboard solution

Data is the new oil. But while the use of oil was relatively clearly defined, there are much more possibilities in data. It’s an endless story.
Almost all companies are facing the challenge of having tons of data from very heterogeneous sources. But often, they lack a clear vision of what the data could be used for. What are new business models that can be fueled with the data? Which data products can be defined and sold by the company? The solution is big data Design Thinking.
Continue reading “Big Data Design Thinking”

WHY DASHBOARDS ARE A GOOD FIT FOR DATA SYSTEMS?

Why Dashboards is a good fit for Data Systems ?
Image by Rawpixel via Pixabay

Dashboards for data systems

Why exactly do dashboards and data systems go so well together? That is the topic of the article by Benedikt Droste, Senior Data Analyst at MSR Consulting Group, and Holger Geißler, CMO of DataLion, which was published on Marktforschung.de as part of the topic dossier “Plattformen und Datensysteme 2019”. First, the authors explain how data systems are created in the first place. The way to create a data system is described in five steps: Continue reading “WHY DASHBOARDS ARE A GOOD FIT FOR DATA SYSTEMS?”